Abstract
Thalamocortical connectivity plays a vital role in brain function. The anatomy and function of thalamocortical networks have been extensively studied in animals by numerous invasive techniques. Non-invasively mapping thalamocortical networks in humans has also been demonstrated by utilizing resting-state functional magnetic resonance imaging (rsfMRI). However, success in simultaneously imaging multiple thalamocortical networks in animals is rather limited. This is largely due to the profound impact of anesthesia used in most animal experiments on functional connectivity measurement. Here we have employed an awake animal imaging approach to systematically map thalamocortical connectivity for multiple thalamic nuclei in rats. Seed-based correlational analysis demonstrated robust functional connectivity for each thalamic nucleus in the cortex, and the cortical connectivity profiles revealed were in excellent accordance with the known thalamocortical anatomical connections. In addition, partial correlation analysis was utilized to further improve the spatial specificity of thalamocortical connectivity. Taken together, these findings have provided important evidence supporting the validity of rsfMRI measurement in awake animals. More importantly, the present study has made it possible to non-invasively investigate the function, neuroplasticity and mutual interactions of thalamocortical networks in animal models.
Keywords: Resting-state functional connectivity, Rat, Brain, Thalamocortical Networks
Introduction
The thalamus and cerebral cortex are connected through topologically well-organized connections. Studies have long revealed that the thalamus acts as the “gateway” for almost all extrinsic and intrinsic information before they reach the cortex via thalamocortical connections (Guillery and Sherman, 2002). More recently, research has suggested that the thalamus plays many significant roles that extend beyond the relay function. For instance, it has been shown that the lateral geniculate (LG) nucleus—a thalamic nucleus that transmits visual information—is actively involved in information processing (Schmid et al., 2010), binocular rivalry (Haynes et al., 2005; Wunderlich et al., 2005), visual attention (O'Connor et al., 2002), perception and cognition (Saalmann and Kastner, 2009). In addition, the function of thalamus is critical to the states of wakefulness, sleep and consciousness (Alkire et al., 2008; Poulet et al., 2012). It has also been reported that thalamocortical connectivity is essential for the establishment of oscillatory brain waves (Jones, 2001). Importantly, abnormal thalamocortical connectivity has been observed in multiple brain disorders like schizophrenia (Welsh et al., 2010; Woodward et al., 2012), suggesting its vital psychopathological relevance.
Given the critical importance of thalamocortical networks, numerous studies have examined the anatomical and functional aspects of thalamocortical connectivity through a wide range of invasive techniques such as retrograde/anterograde tracing and electrophysiological methods (Krettek and Price, 1977; Van Groen and Wyss, 1995; Vertes and Hoover, 2008). These studies have identified characteristic connectivity patterns for separate thalamic nucleus groups (Swanson, 2004). Specifically, thalamocortical connect1ions related to primary sensory and motor cortices are relatively simple and well organized. For instance, LG nucleus is predominantly connected to the visual system; medial geniculate (MG) nucleus is essentially connected to the auditory system; and ventral group of dorsal thalamus (VENT) is primarily linked to the sensorimotor system. Interestingly, these thalamocortical connectivity patterns are well preserved in multiple species from rodents to humans (Jones, 2007). In contrast, thalamic nuclei connected to higher-tier association cortices can have more complex connectivity patterns with possible overlapping cortical projections. For example, medial group of dorsal thalamus (MED) has connections to the prefrontal cortex and cingulate; midline group of dorsal thalamus (MTN) and anterior group of dorsal thalamus (ATN) both contain connections to the prefrontal cortex, cingulate and hippocampal formation; MTN is also connected to subcortical regions like lateral septal complex (LSX); and lateral group of dorsal thalamus (LAT) projects to association cortices in parietal, temporal and occipital regions. A summary of the thalamocortical connectional relationship in the rat brain was shown in a diagram in SI Figure 1.
Most techniques for studying thalamocortical connectivity suffer from invasiveness and inability to systematically trace connectivity across multiple thalamocortical networks. Non-invasively and simultaneously examining functional connectivity between separate thalamic nuclei and their corresponding cortices has posed a significant challenge, albeit this ability can be extremely important in further understanding the characteristic functions of individual thalamocortical networks as well as their mutual interactions. To bridge this gap, Zhang and colleagues (Zhang et al., 2008; Zhang et al., 2010a) have successfully demonstrated the feasibility of mapping the thalamocortical networks in humans by utilizing an emerging brain mapping technique of resting-state functional magnetic resonance imaging (rs-fMRI). rs-fMRI measures functional connectivity between brain regions based on synchronized spontaneous fluctuations of the rsfMRI signal (Biswal et al., 1995). With this technique, the thalamocortical connectivity patterns revealed in humans well agreed with the known anatomical connectivity relationship (Zhang et al., 2008; Zhang et al., 2010a). However, success in this research topic in animals is rather limited (Pawela et al., 2008). This can largely be attributed to the profound impact of anesthesia used in most animal experiments on the measurement of resting-state functional connectivity (Liang et al., 2012b; Liu et al., 2011; Lu et al., 2007). Indeed, our recent study showed that thalamocortical connectivity and local network organizations of the rat brain can be significantly altered by using routine anesthetizing procedures (Liang et al., 2012a). Consequently, the confounding effects of anesthesia have significantly hindered the exploration of thalamocortical networks in animals using rsfMRI.
In the present study we have employed a previously established awake animal rsfMRI approach to map thalamocortical connectivity in rats. This imaging method can avoid the confounding effects of anesthesia on rsfMRI measurement. To examine whether specific thalamocortical connectional relationship in rodents can be reliably revealed by this approach, anatomically defined thalamic nucleus groups were used as separate seed regions of interest (ROIs) to generate the corresponding functional connectivity maps. Resulting functional connectivity in the cortex demonstrated high spatial specificity and was in excellent accordance with the known thalamocortical anatomical connectivity.
Materials and Methods
Animal Preparation and MR Experiment
rsfMRI data collected at the identical condition from several previous studies (Liang et al., 2011, 2012a; Zhang et al., 2010b) were pooled and re-analyzed for the purpose of the present study. Detailed descriptions of the experimental procedures can be found in aforementioned studies. Briefly, 42 adult male Long-Evans rats were acclimated to MRI restraint and noise for seven days to minimize imaging-induced stress and movement during imaging as described before (Liang et al., 2011, 2012a; Zhang et al., 2010b). During the experimental setup, the rat was briefly anesthetized by isoflurane (2%) and the head was secured into a head restrainer with a build-in coil, and the body was fit into a body restrainer. After the setup was completed, isoflurane was removed and the whole system was positioned in magnet. Rats were all fully awake during imaging sessions. In order to compare the thalamocortical connectivity at the awake and anesthetized conditions, 16 of 42 rats underwent the imaging session at the anesthetized condition at minimum 7 days after they were imaged at the awake condition. In this experiment, the animal preparation procedure was the same as that in the awake imaging experiment. Isoflurane gas (2%) was then delivered to the animal through a nose cone in the magnet to maintain the anesthetized state. The body temperature of the animal was monitored and maintained at 37°C ± 0.5°C by using a feedback controlling heating pad. All studies were approved by IACUC of the University of Massachusetts Medical School.
All MRI experiments were conducted on a Bruker 4.7 T magnet. A dual 1H radiofrequency (RF) coil configuration (Insight NeuroImaging Systems, Worcester, MA) consisting of a volume coil for exciting the water proton spins and a surface coil for receiving MRI signal was used; the volume and surface coils were actively tuned and detuned to prevent mutual coil coupling. This dual-coil configuration allows for sufficient RF field homogeneity in the rat brain for RF transmission, while preserving the advantage of higher signal-to-noise ratio (SNR) provided by the smaller reception coil. For each MRI session, RARE sequence was used to acquire anatomical images with the following parameters: TR = 2125ms, TE = 50ms, matrix size = 256×256, FOV = 3.2×3.2cm2, slice number = 18, slice thickness = 1mm, RARE factor = 8. Gradient-echo images were then acquired using the echo-planar imaging (EPI) sequence with the following parameters: TR = 1s, TE = 30ms, flip angle = 60°, matrix size = 64×64, FOV = 3.2cm×3.2cm, slice number=18, slice thickness = 1mm. Two hundred volumes were acquired for each scan, and six to nine scans were obtained for each session.
rsfMRI Data Analysis
rsfMRI images of all rats were first co-registered to a fully segmented rat atlas based on anatomical images by using Medical Image Visualization and Analysis (MIVA, http://ccni.wpi.edu/). Preprocessing steps included motion correction with SPM8 (http://www.fil.ion.ucl.ac.uk/spm/), spatial smoothing (FWHM = 1mm), regression of motion parameters and the signals of white matter and ventricles to eliminate the contributions of physiologic noise to the rsfMRI signal, and 0.002–0.1Hz band-pass filtering. Scans with excessive motion (>0.25 mm) were discarded.
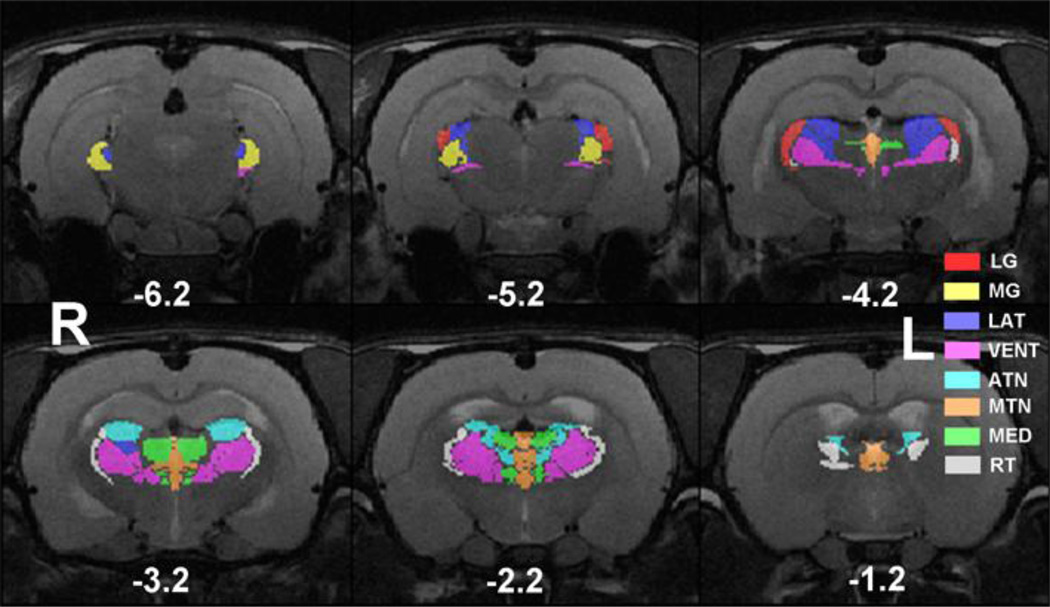
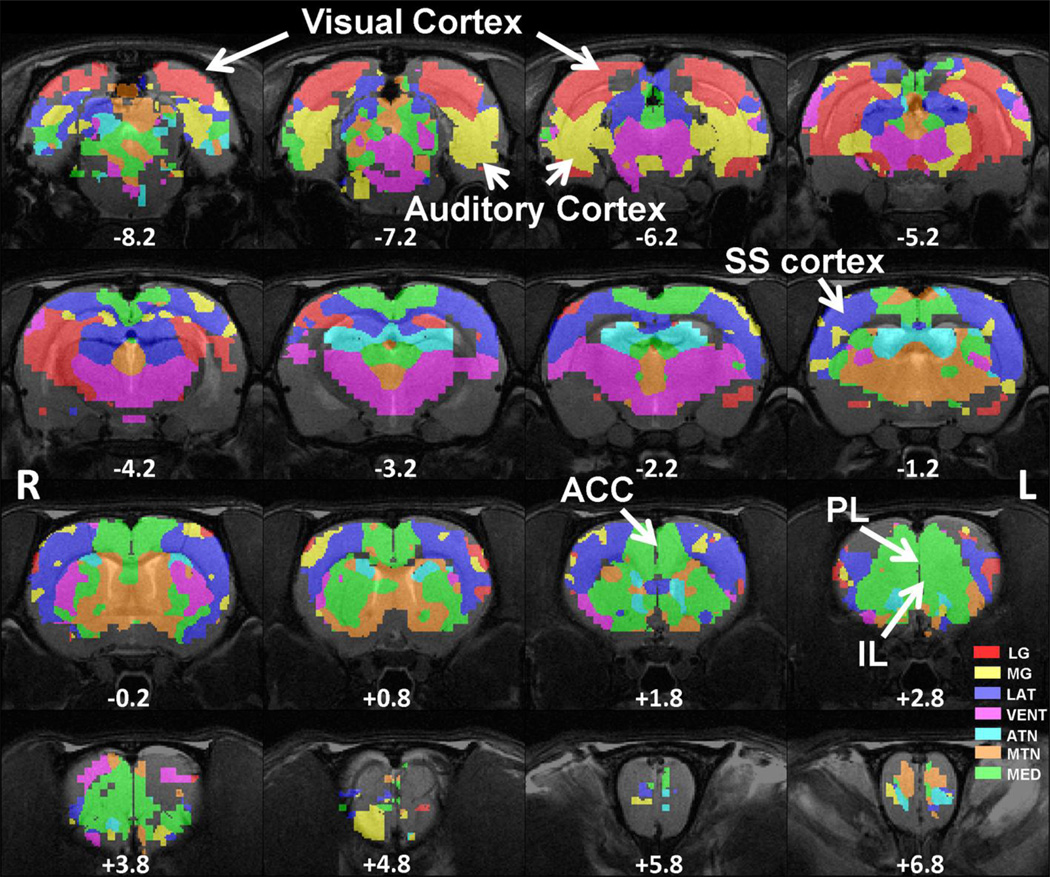
To accommodate the spatial resolution of rsMRI, the thalamus was partitioned into eight bilateral thalamic nuclei ROIs as seeds for functional connectivity analysis (Figure 1). The total number of voxels in EPI images that fit into the ROI of each individual thalamic nucleus was LG: 15, MG: 17, VENT: 79, LAT: 34, MED: 26, MTN: 26, ATN: 30 and RT: 21. This calculation was based on our segmented atlas template that was resampled to the spatial resolution of EPI images (0.5×0.5×1mm3), which gave the volume of each individual thalamic nucleus (in mm3): LG: 3.75, MG: 4.25, VENT: 19.75, LAT: 8.5, MED: 6.5, MTN: 6.5, ATN: 7.5 and RT: 5.25. Anatomical definitions were based on the Swanson atlas (Swanson, 2004). Detailed anatomical information of all seed ROIs can be found in SI Table 1.
Figure 1.
ROI definitions of thalamic nucleus groups. Spatial maps of eight thalamic nucleus groups were displayed in different colors overlaid on anatomical images. Distance to bregma (in mm) is labeled at the bottom of each slice. L, left, R, right.
Functional connectivity was evaluated using seed-based correlational analysis on a voxel-by-voxel basis (Liang et al., 2012a; Zhang et al., 2010b). Time courses from all voxels within individual seed regions were averaged and used as reference time courses. Pearson cross-correlation coefficients between these reference time courses and the time course of each individual voxel were then calculated. Correlation coefficients (i.e. r values) were transformed to z scores using Fisher’s z transformation. This correlational analysis was carried out for each scan.
To assess the reproducibility of functional connectivity maps, rats were randomly split into two subgroups for each (awake or anesthetized) condition. A thalamocortical connectivity map was generated for each seed in each subgroup. The correlation coefficient of z scores between individual corresponding voxels from two subgroups was then calculated. This process was repeated for 100 times. Averaged correlation coefficients from 100 repetitions provided a measure of reproducibility of functional connectivity maps.
Statistics
For each seed ROI, a linear mixed-effect model was calculated using the lme4 package in the R environment (http://www.r-project.org, version 2.15.1) with the random effect of rats and the fixed effect of z scores. The p value of the fixed effect for each voxel was then calculated by using the Markov chain Monte Carlo (MCMC) method with 10000 samples (implemented in the languageR package in R). Maps were thresholded at p value < 0.05, corrected for multiple comparisons with the False Discovery Rate (FDR) criteria. Maps of t values were displayed.
Winner-take-all approach
To simultaneously display multiple thalamocortical networks for all ROIs, a winner-take-all approach was utilized. For each voxel that showed significant connectivity with at least one seed ROI (i.e. p<0.05, FDR corrected), it was assigned to the ROI with the highest z score in all thalamic nucleus connectivity maps. Winning voxels that did not pass the statistical threshold were not displayed. Due to little cortical connectivity both reported in the literature (Swanson, 2004) and confirmed by our data (SI Figure 4), the functional connectivity map of reticular nucleus (RT) was not included in the winner-take-all approach.
Results
Cortical connectivity of individual thalamic nucleus groups
The connectivity profiles of individual seeds were generated by the correlational analysis of the rsfMRI signal in rats. All thalamic nucleus groups except RT can be broadly divided into two categories: nucleus groups related to sensory-motor cortices and nucleus groups related to polymodal association cortices.
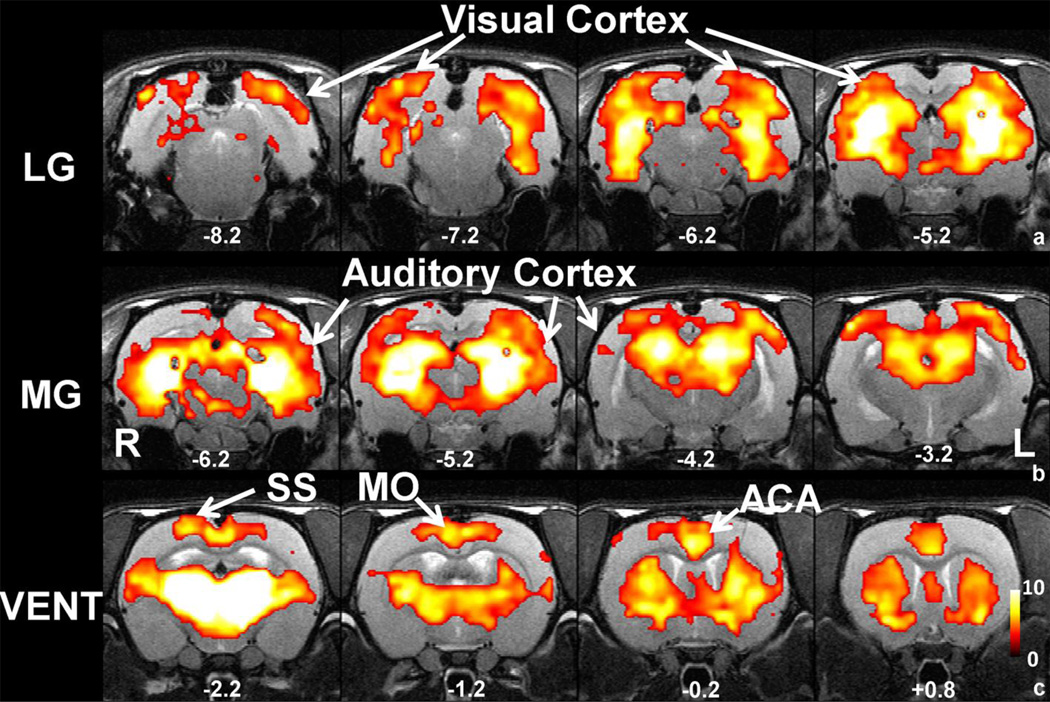
Sensory-motor related thalamic nucleus groups (SI Figure 1) included LG (visual), MG (auditory) and VENT (somatosensory and motor). In awake rats, the LG connectivity map showed robust functional connectivity with the visual cortex (Figure 2a). Other subcortical and cortical brain regions revealed in the LG functional connectivity map included part of thalamus, hypothalamus, hippocampus and temporal cortex. In the MG connectivity map shown in Figure 2b, connectivity with the auditory cortex was clearly observed. In addition, part of hippocampus and thalamus appeared to connect to MG. With respect to VENT, the connectivity map revealed prominent cortical connectivity in somatomotor, somatosensory and anterior cingulate cortices, as shown in Figure 2c. Strong subcortical connections were also evident in caudateputamen (CPu).
Figure 2.
Functional connectivity maps of sensory-motor related thalamic groups. a) Map of LG connectivity. b) Map of MG connectivity. c) Map of VENT connectivity. All maps were thresholded at p value<0.05, FDR corrected and t values were color coded and displayed. Distance to bregma (in mm) is labeled at the bottom of each slice. L, left, R, right.
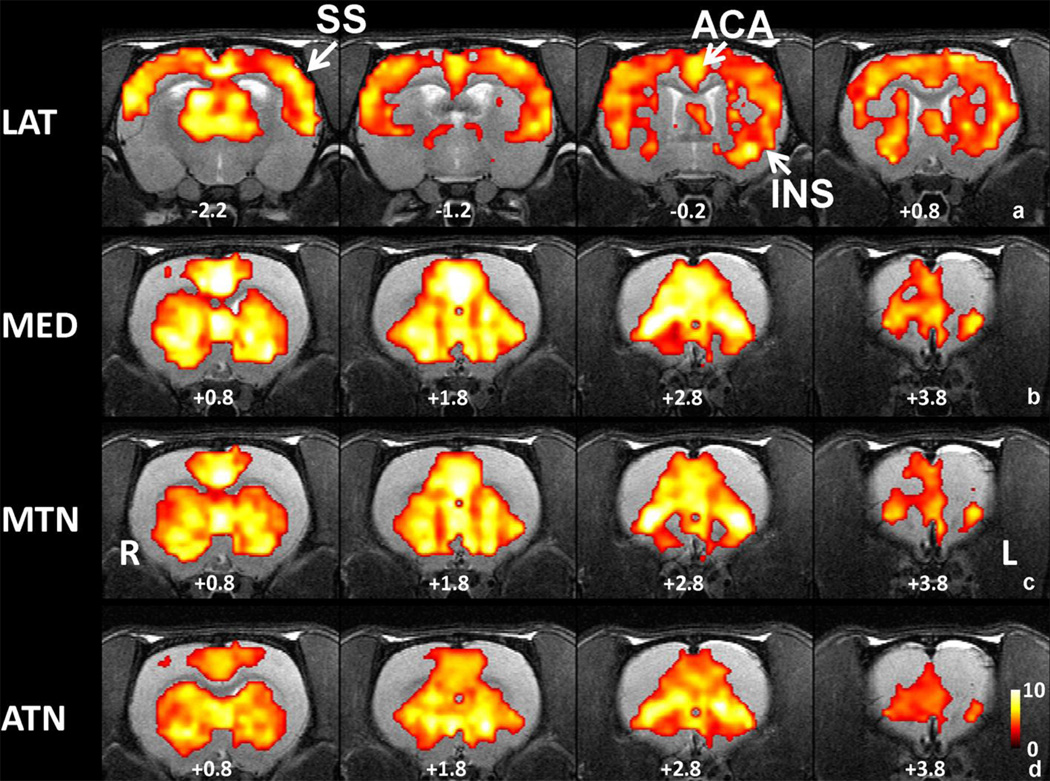
Four thalamic nucleus groups were related to polymodal association cortices (SI Figure 1): LAT, MED, MTN and ATN. In awake rats, widespread cortical connections were observed in the LAT connectivity map (Figure 3a), prominently involving somatosensory, motor, anterior cingulate and insular cortices. In addition, the LAT connectivity map showed functional connectivity with subcortical regions such as CPu (Figure 3a). The other three thalamic groups, MED, MTN and ATN, all showed very similar connectivity profiles, mostly with the prefrontal cortex, cingulate and CPu (Figure 3b, c, d).
Figure 3.
Functional connectivity maps of poly-modal association cortices related thalamic groups. a) LAT connectivity map. b) MED connectivity map. c) MTN connectivity map. d) ATN connectivity map. All maps were thresholded at p value<0.05, FDR corrected and t values were color coded and displayed. Distance to bregma (in mm) is labeled at the bottom of each slice. L, left, R, right.
The sagittal and axial views of the connectivity maps for these seven thalamic nuclei groups in awake rats were shown in SI Figure 2. The cortical connectivity patterns for the same seven thalamic nuclei in the anesthetized rat were shown in SI Figure 3. The results indicated that the thalamocortical connectivity was significantly compromised in all thalamocortical networks at the anesthetized condition. These results were also consistent with the finding in our previous publication (Figure 7 in Liang et al., 2012b).
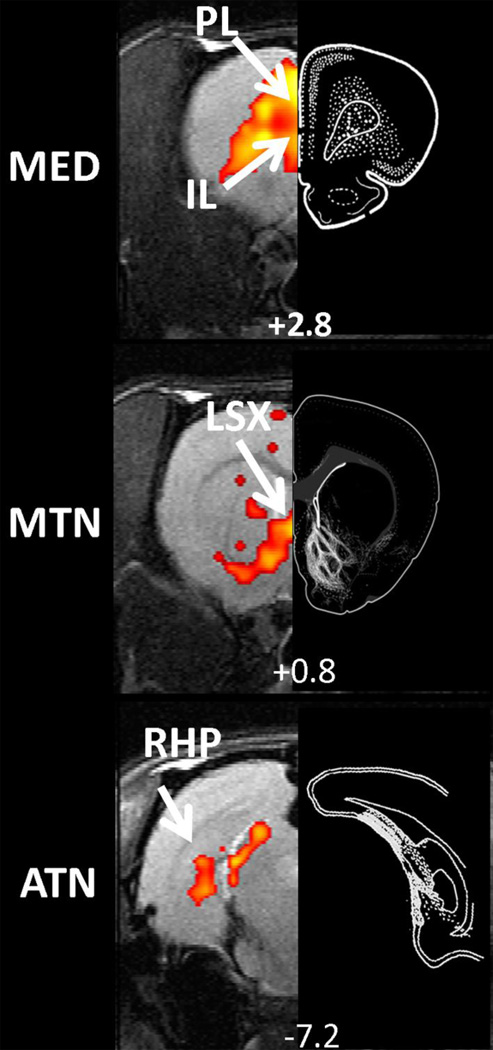
Figure 7.
The spatial patterns of thalamocortical connectivity showed great agreement with the corresponding anatomical connectivity patterns identified in literature tracing studies. Left panels are functional connectivity map obtained by partial correlation analysis. Right panels are adopted from tracing studies with the injections sites originating from mediodorsal nucleus (part of MED, Panel a), paraventriclar nucleus (part of MTN, Panel b), anterodorsal nucleus (part of ATN, Panel c), respectively, in the rat (Krettek and Price, 1977; Van Groen and Wyss, 1995; Vertes and Hoover, 2008). White dots or lines indicated labeled neurons in destination regions.
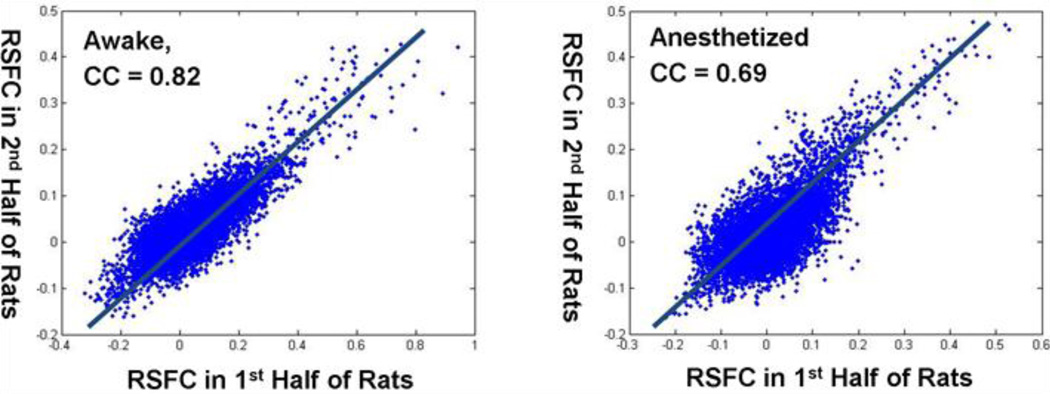
To estimate the reproducibility of functional connectivity maps, voxel-wise correlation between two randomly divided subgroups was calculated for individual nuclei and repeated for 100 times. Averaged correlation coefficients across 100 repetitions were highly significant for all seeds in awake rats (CCaverage = 0.74, 0.82, 0.80, 0.81, 0.82, 0.82 and 0.80 for LG, MG, VENT, ATN, LAT, MED and MTN, respectively, p<10−7 for all seeds). In anesthetized rats, averaged correlation coefficients were also high but tended to be lower than those in awake rats (CCaverage= 0.65, 0.63, 0.73, 0.71, 0.72, 0.72 and 0.71 for LG, MG, VENT, ATN, LAT, MED and MTN, respectively). Two representative examples of voxel-wise correlations between two randomly divided subgroups in awake and anesthetized rats were shown in Figure 4.
Figure 4.
Two representative examples of voxel-wise resting-state functional connectivity (RSFC) correlations between two randomly divided subgroups in awake and anesthetized rats.
Consistent with the literature report (Swanson, 2004), RT showed little functional connectivity in the cortex (SI Figure 4). Also to examine unilateral thalamocortical connectivity, unilateral thalamic nuclei were used as seeds to generate functional connectivity maps by using correlational analysis. All unilateral seed maps demonstrated strong ipsilateral cortical connectivity, with somewhat weaker contralateral cortical connectivity (see SI Figure 5 for a representative example).
Multiple thalamocortical networks revealed by the winner-take-all approach
Multiple thalamocortical networks measured by resting-state functional connectivity in awake rats were simultaneously displayed by using the whole-brain winner-take-all approach (Figure 5, see Methods for details). The map clearly showed highly organized cortical connectivity patterns for individual thalamic nucleus groups that were in excellent accordance with the known anatomical connectivity. For example, dominant LG connectivity was observed in the visual cortex (labeled in red); and MG connectivity was mostly in the auditory cortex (labeled in yellow). In addition, LAT showed robust connectivity in somatosensory cortex (labeled in blue). Interestingly, MED, MTN and ATN showed differential connectivity patterns in the winner-take-all map, and these patterns also agreed with their anatomical connections (Krettek and Price, 1977; Van Groen and Wyss, 1995; Vertes and Hoover, 2008). Specifically, dominant MED cortical connectivity was seen in the prefrontal cortex and cingulate (labeled in green). MTN connectivity (labeled in brown) was evident in subcortical regions of lateral septal complex (LSX).
Figure 5.
Multiple thalamocortical networks revealed by the winner-take-all map approach. The color of each voxel was labeled as the color of the winning thalamic nucleus seed. Colors of all thalamic nucleus seeds are identical to those in Figure 1. Distance to bregma (in mm) is labeled at the bottom of each slice. L, left, R, right.
Improved spatial specificity of cortical connectivity with partial correlation
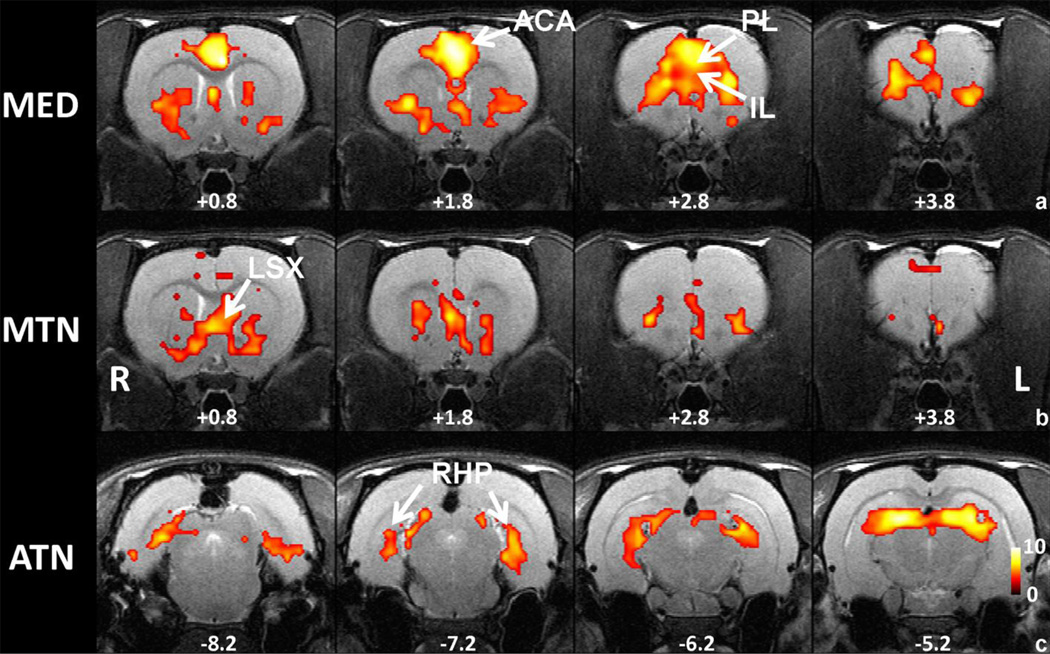
Functional connectivity maps of MED, MTN and ATN revealed by full correlation analysis (Figures 3b, c and d) showed almost identical profiles in the prefrontal regions. It is likely that similar cortical connectivity patterns among these nucleus groups resulted from indirect connectivity to the cortex mediated by inter-nucleus connections. To examine this possibility, we further inspected inter-nucleus connectivity between all nucleus groups. The result indicated that these three thalamic nucleus groups indeed had very high mutual connectivity among themselves. Mean connectivity strength (estimated by r values) between MED-MTN, MED-ATN and MTN-ATN were 0.66, 0.50 and 0.38 respectively, while the mean connectivity of these three nucleus groups with the other four nucleus groups were considerably lower (MED: 0.26, MTN: 0.18, ATN: 0.26). Therefore, strong inter-nucleus connections among MED, MTN and ATN could mediate indirect connectivity to the cortex, resulting in apparently similar cortical connectivity patterns among these three nucleus groups. For the purpose of differentiating the connectivity pattern for MTN, MED and ATN, the method of partial correlation was utilized. For each of the three nucleus groups, the time courses of the other two nucleus groups were used as covariates when evaluating its specific functional connectivity. Similar to the full correlation analysis, partial correlation coefficients (i.e. r values) were transformed to z scores using Fisher’s z transformation. The same statistical analysis and threshold were applied. The resulting maps showed distinct connectivity patterns for the three seeds (Figure 6). MED retained the characteristic functional connectivity with prefrontal regions including infralimbic (IL), prelimic (PL), anterior cingulate and orbital frontal cortices. Interestingly, its connectivity pattern obtained by partial correlation analysis was consistent with the pattern in the winner-take-all map (Figure 5, labeled in green). Also similar to the pattern in the winner-take-all map, MTN connectivity was dominant in subcortical areas including LSX (Figure 5, labeled in brown). In contrast, the ATN showed a distinct pattern with its specific connectivity in retrohippocampal regions—a more posterior part of the brain.
Figure 6.
Functional connectivity maps of MED, MTN and ATN generated by partial correlation analysis. The functional connectivity map of one nucleus group was obtained by controlling for the rsfMRI signals of the other two nucleus groups. a) MED connectivity map. b) MTN connectivity map. c) ATN connectivity map. All maps were thresholded at p value<0.05, FDR corrected and t values were color coded and displayed. Distance to bregma (in mm) is labeled at the bottom of each slice. L, left, R, right.
To further examine the validity of connectivity profiles revealed by partial correlation analysis, we compared the functional connectivity results of the three nucleus groups with their anatomical connectivity pattern in well-established tracing studies (Figure 7, results of tracing studies were respectively adopted from (Krettek and Price, 1977; Van Groen and Wyss, 1995; Vertes and Hoover, 2008). In these tracing studies anterograde tracers were injected respectively in mediodorsal nucleus (part of MED, Figure 7a), paraventriclar nucleus (part of MTN, Figure 7b), and anterodorsal nucleus (part of ATN, Figure 7c) in rats. For each of all three nucleus groups, remarkable correspondence was observed between the functional connectivity pattern and the tracer destination from the injection site. These results collectively provided strong evidence validating partial correlation analysis in improving the spatial specificity of rsfMRI.
Discussion
In the present study we have investigated the patterns of thalamocortical connectivity in rodents by utilizing resting-state functional connectivity (Liang et al., 2012a; Zhang et al., 2010b). We found that the functional connectivity to the cortex from separate thalamic nuclei well agreed with the known thalamocortical anatomical connections in awake rats. In addition, the cortical connectivity for each thalamic nucleus was highly reproducible and more prominent at the awake condition relative to the anesthetized condition. Furthermore, greater spatial specificity of functional connectivity was obtained by partial correlation analysis in nucleus groups with high mutual connectivity, which was validated by previous tracing studies (Krettek and Price, 1977; Van Groen and Wyss, 1995; Vertes and Hoover, 2008). To our best knowledge, it is the first study that simultaneously mapped multiple distinct thalamocortical networks in the rat brain.
The significance of the present study is in two folds. First, the excellent consistency between the cortical functional connectivity profiles for multiple thalamic nuclei and the known thalamocortical connectional relationship has provided very important evidence supporting the measurement of resting-state functional connectivity in awake rat brain. The establishment of this approach can significantly extend the applicability of rsfMRI research in numerous animal models which currently remains tremendously underexplored. Second, the present study demonstrated the feasibility of simultaneously mapping multiple thalamocortical networks in the rat brain. This ability makes it possible to further non-invasively investigate the function, neuroplasticity and mutual interactions of thalamocortical networks.
Robust functional connectivity was observed between thalamic nucleus groups subserving sensory-motor functions and their corresponding cortices (i.e., LG was connected with visual cortex, MG was connected with the auditory cortex and VENT was connected with motor/somatosensory cortices). The anatomical circuitries of these first-order thalamic nuclei are relatively simple as they all project to their corresponding sensory and motor cortices with little overlap. For example, axons of LG project to layer 4 of the primary visual cortex through excitatory synapses (Sherman, 2005). Accordingly, the observed functional connectivity of sensory-motor related thalamic nucleus groups all had quite distinct connectivity profiles that well agreed with their respective anatomical connectivity patterns. Nevertheless, it is still worth to note that even for sensory-motor related thalamic nuclei, significant overlaps in their cortical connectivity were still observed. Overlaps in the connectivity maps in the sensory-motor related thalamic seeds, though not as significant as polymodal association cortex-related nuclei, can be induced by several factors including the partial volume effect and indirect cortico-coritical connectivity. At the rsfMRI spatial resolution of the present study (0.5×0.5×1mm3), when calculating the reference time course of a thalamic nucleus (see Materials and Methods), it is virtually impossible to avoid the partial volume effect from its neighboring nuclei. This partial volume effect can induce overlapping cortical connectivity between sensory-motor related nuclei. In addition, indirect cortico-cortical connectivity can also cause overlaps in cortical connectivity between sensory-motor related nuclei.
Thalamic nucleus groups related to higher-order polymodal functions also showed significant connectivity with various cortical regions (Figure 3). LAT had obvious functional connectivity with somatosensory, motor, insular and cingulate regions. This connectivity pattern was consistent with its anatomical connectivity profile (Paxinos, 2004). In addition, MED, MTN and ATN all showed robust connectivity with prefrontal regions (Figure 3b, c, d). Notably, when full correlation analysis was used to assess functional connectivity, the connectivity profiles of MED, MTN and ATN did not appear much difference. This situation can be attributed to the indirect connectivity mediated through strong mutual connectivity among these three nucleus groups. It was previously shown that the thalamus had strong inter-nucleus correlations in resting-state activities (Zhang et al., 2010b). In the present study, these three thalamic nucleus groups also showed considerably stronger connectivity among themselves than with other nucleus groups. Therefore, to examine that whether similar functional connectivity profiles of MED, MTN and ATN resulted from the mediating effects of inter-nucleus connectivity, partial correlation analysis was applied. This analysis method generated the functional connectivity map of one nucleus group by controlling for the resting-state activities of the other two nucleus groups. Our results clearly revealed distinct spatial patterns among the three nucleus groups. More interestingly, in the partial correlation maps, MED still showed robust functional connectivity with the prefrontal cortex, while this particular connectivity almost completely diminished in the connectivity maps of the other two seeds (Figure 6b, c). These results suggest that the prefrontal connectivity of MTN and ATN showed in full correlation maps were very likely mediated by MED. Anatomically, MED and the prefrontal cortex have robust and reciprocal connections (Paxinos, 2004). This connectional relationship revealed in tracing studies (Krettek and Price, 1977) also well corresponded to the functional connectivity pattern observed in the partial correlation map (Figure 7a). In addition, MTN consists of several small nucleus groups and has diverse afferent and efferent connections. Interestingly, part of efferent projections of MTN are in subcortical areas such as LSX (Vertes and Hoover, 2008). Again this result was consistent with the functional connectivity pattern revealed by partial correlation analysis (Figure 7b). With respect to ATN, two major nuclei of ATN, anterodorsal nucleus and anteroventral nucleus, both have projections in retrohippocampal regions (Van Groen and Wyss, 1995), which was also clearly revealed in the partial correlation map of ATN (Figure 7c). Taken together, these results strongly suggest that partial correlation analysis can significantly improve the spatial specificity of rsfMRI while maintaining great sensitivity.
In addition to the well-established cortical connectivity patterns, we also observed prominent resting-state functional connectivity that was not extensively reported. For instance, strong connectivity between CPu and several thalamic nuclei was observed in the present study (Fig. 3), whereas the only anatomical connection reported was between CPu and parafasicular nucleus, a small region in dorsal thalamus (Cornwall and Phillipson, 1988). This discrepancy might indicate a previously overlooked connection, or it may originate from indirect connections between CPu and other cortical regions.
The major limitation of the current study is the relatively low spatial resolution of rsfMRI images. Thalamus is a highly heterogeneous brain region consisting of many small nuclei with both common and distinct anatomical connectivity. In the current study, thalamic nuclei were clustered into several groups (see Table 1 in SI) as seed regions due to the resolution limit of rsMRI. This limitation could potentially reduce the sensitivity and specificity of functional connectivity mapping due to the averaging of time courses of potentially heterogeneous voxels within one thalamic nucleus group. rsfMRI with higher spatial resolutions can be applied to more accurately delineate individual thalamic nucleus or even sub-nucleus in future studies. In addition, it should be noted that in the tracing studies cited in Figure 7 the injection sites were only a part of nucleus groups used as seed ROIs in the present study. Thus it may not be realistic to expect completely identical spatial patterns between the anatomical connectivity and functional connectivity.
In the past decade, rsfMRI has been shown to be a powerful tool to noninvasively probe dynamic communications between brain regions. Measuring resting-state functional connectivity in awake animals is an emerging technique that has the potential to substantially extend the applicability of rsfMRI in numerous preclinical animal models. Therefore, rigorously validating this approach is of critical importance. The thalamocortical networks are perhaps the most well studied neural networks in the brain. Given the well-known connectivity patterns, the thalamocortical networks provide an ideal model for validating the resting-state functional connectivity measurement in awake animals. Our results clearly indicated robust thalamo-cortical connectivity that is in excellent consistency with the known anatomical connectivity, and therefore provided strong evidence validating the approach of measuring rsfMRI in awake animals. More importantly, the current study further extended rsfMRI to establish a novel animal model of functional thalamocortical connectivity, and thus offered a tool for preclinical research of thalamus and thalamocortical connectivity. Given the vital importance of thalamocortical connectivity in brain functions such as consciousness, our resting-state animal model represents enormous opportunities of studying this functional connectivity at normal as well as pathological conditions.
Supplementary Material
Research Highlights.
-
❖
Thalamocortical connectivity for multiple thalamic nuclei in rats was measured
-
❖
Robust functional connectivity in the cortex was observed for each thalamic nucleus
-
❖
Cortical connectivity profiles well agreed with the known thalamocortical networks
-
❖
Partial correlation analysis significantly improved the spatial specificity
Acknowledgement
We would like to thank Dr. Wei Huang for her technical support and anonymous reviewers for constructive comments. This publication was made possible by the NIH Grant Number 1R01MH098003 (PI: Nanyin Zhang, PhD) from the National Institute of Mental Health of the National Institutes of Health.
Footnotes
Publisher's Disclaimer: This is a PDF file of an unedited manuscript that has been accepted for publication. As a service to our customers we are providing this early version of the manuscript. The manuscript will undergo copyediting, typesetting, and review of the resulting proof before it is published in its final citable form. Please note that during the production process errors may be discovered which could affect the content, and all legal disclaimers that apply to the journal pertain.
References
- Alkire MT, Hudetz AG, Tononi G. Consciousness and anesthesia. Science. 2008;322:876–880. doi: 10.1126/science.1149213. [DOI] [PMC free article] [PubMed] [Google Scholar]
- Biswal B, Yetkin FZ, Haughton VM, Hyde JS. Functional connectivity in the motor cortex of resting human brain using echo-planar MRI. Magn Reson Med. 1995;34:537–541. doi: 10.1002/mrm.1910340409. [DOI] [PubMed] [Google Scholar]
- Cornwall J, Phillipson OT. Afferent projections to the parafascicular thalamic nucleus of the rat, as shown by the retrograde transport of wheat germ agglutinin. Brain Res Bull. 1988;20:139–150. doi: 10.1016/0361-9230(88)90171-2. [DOI] [PubMed] [Google Scholar]
- Guillery RW, Sherman SM. Thalamic relay functions and their role in corticocortical communication: generalizations from the visual system. Neuron. 2002;33:163–175. doi: 10.1016/s0896-6273(01)00582-7. [DOI] [PubMed] [Google Scholar]
- Haynes JD, Deichmann R, Rees G. Eye-specific effects of binocular rivalry in the human lateral geniculate nucleus. Nature. 2005;438:496–499. doi: 10.1038/nature04169. [DOI] [PMC free article] [PubMed] [Google Scholar]
- Jones EG. The thalamic matrix and thalamocortical synchrony. Trends Neurosci. 2001;24:595–601. doi: 10.1016/s0166-2236(00)01922-6. [DOI] [PubMed] [Google Scholar]
- Jones EG. The Thalamus. 2 ed. Cambridge University Press; 2007. [Google Scholar]
- Krettek JE, Price JL. The cortical projections of the mediodorsal nucleus and adjacent thalamic nuclei in the rat. J Comp Neurol. 1977;171:157–191. doi: 10.1002/cne.901710204. [DOI] [PubMed] [Google Scholar]
- Liang Z, King J, Zhang N. Uncovering intrinsic connectional architecture of functional networks in awake rat brain. J Neurosci. 2011;31:3776–3783. doi: 10.1523/JNEUROSCI.4557-10.2011. [DOI] [PMC free article] [PubMed] [Google Scholar]
- Liang Z, King J, Zhang N. Anticorrelated resting-state functional connectivity in awake rat brain. Neuroimage. 2012a;59:1190–1199. doi: 10.1016/j.neuroimage.2011.08.009. [DOI] [PMC free article] [PubMed] [Google Scholar]
- Liang Z, King J, Zhang N. Intrinsic organization of the anesthetized brain. J Neurosci. 2012b;32:10183–10191. doi: 10.1523/JNEUROSCI.1020-12.2012. [DOI] [PMC free article] [PubMed] [Google Scholar]
- Liu X, Zhu XH, Zhang Y, Chen W. Neural origin of spontaneous hemodynamic fluctuations in rats under burst-suppression anesthesia condition. Cereb Cortex. 2011;21:374–384. doi: 10.1093/cercor/bhq105. [DOI] [PMC free article] [PubMed] [Google Scholar]
- Lu H, Zuo Y, Gu H, Waltz JA, Zhan W, Scholl CA, Rea W, Yang Y, Stein EA. Synchronized delta oscillations correlate with the resting-state functional MRI signal. Proc Natl Acad Sci U S A. 2007;104:18265–18269. doi: 10.1073/pnas.0705791104. [DOI] [PMC free article] [PubMed] [Google Scholar]
- O'Connor DH, Fukui MM, Pinsk MA, Kastner S. Attention modulates responses in the human lateral geniculate nucleus. Nat Neurosci. 2002;5:1203–1209. doi: 10.1038/nn957. [DOI] [PubMed] [Google Scholar]
- Pawela CP, Biswal BB, Cho YR, Kao DS, Li R, Jones SR, Schulte ML, Matloub HS, Hudetz AG, Hyde JS. Resting-state functional connectivity of the rat brain. Magn Reson Med. 2008;59:1021–1029. doi: 10.1002/mrm.21524. [DOI] [PMC free article] [PubMed] [Google Scholar]
- Paxinos G. The Rat Nervous System. Elsevier; 2004. [Google Scholar]
- Poulet JF, Fernandez LM, Crochet S, Petersen CC. Thalamic control of cortical states. Nat Neurosci. 2012;15:370–372. doi: 10.1038/nn.3035. [DOI] [PubMed] [Google Scholar]
- Saalmann YB, Kastner S. Gain control in the visual thalamus during perception and cognition. Curr Opin Neurobiol. 2009;19:408–414. doi: 10.1016/j.conb.2009.05.007. [DOI] [PMC free article] [PubMed] [Google Scholar]
- Schmid MC, Mrowka SW, Turchi J, Saunders RC, Wilke M, Peters AJ, Ye FQ, Leopold DA. Blindsight depends on the lateral geniculate nucleus. Nature. 2010;466:373–377. doi: 10.1038/nature09179. [DOI] [PMC free article] [PubMed] [Google Scholar]
- Sherman SM. Thalamic relays and cortical functioning. Prog Brain Res. 2005;149:107–126. doi: 10.1016/S0079-6123(05)49009-3. [DOI] [PubMed] [Google Scholar]
- Swanson LW. Brain Maps: Structure of the Rat Brain. Elsevier; 2004. [Google Scholar]
- Van Groen T, Wyss JM. Projections from the anterodorsal and anteroventral nucleus of the thalamus to the limbic cortex in the rat. J Comp Neurol. 1995;358:584–604. doi: 10.1002/cne.903580411. [DOI] [PubMed] [Google Scholar]
- Vertes RP, Hoover WB. Projections of the paraventricular and paratenial nuclei of the dorsal midline thalamus in the rat. J Comp Neurol. 2008;508:212–237. doi: 10.1002/cne.21679. [DOI] [PubMed] [Google Scholar]
- Welsh RC, Chen AC, Taylor SF. Low-frequency BOLD fluctuations demonstrate altered thalamocortical connectivity in schizophrenia. Schizophr Bull. 2010;36:713–722. doi: 10.1093/schbul/sbn145. [DOI] [PMC free article] [PubMed] [Google Scholar]
- Woodward ND, Karbasforoushan H, Heckers S. Thalamocortical dysconnectivity in schizophrenia. Am J Psychiatry. 2012;169:1092–1099. doi: 10.1176/appi.ajp.2012.12010056. [DOI] [PMC free article] [PubMed] [Google Scholar]
- Wunderlich K, Schneider KA, Kastner S. Neural correlates of binocular rivalry in the human lateral geniculate nucleus. Nat Neurosci. 2005;8:1595–1602. doi: 10.1038/nn1554. [DOI] [PMC free article] [PubMed] [Google Scholar]
- Zhang D, Snyder AZ, Fox MD, Sansbury MW, Shimony JS, Raichle ME. Intrinsic functional relations between human cerebral cortex and thalamus. J Neurophysiol. 2008;100:1740–1748. doi: 10.1152/jn.90463.2008. [DOI] [PMC free article] [PubMed] [Google Scholar]
- Zhang D, Snyder AZ, Shimony JS, Fox MD, Raichle ME. Noninvasive functional and structural connectivity mapping of the human thalamocortical system. Cereb Cortex. 2010a;20:1187–1194. doi: 10.1093/cercor/bhp182. [DOI] [PMC free article] [PubMed] [Google Scholar]
- Zhang N, Rane P, Huang W, Liang Z, Kennedy D, Frazier JA, King ME. Mapping resting-state brain networks in conscious animals. J Neurosci Methods. 2010b;189:186–196. doi: 10.1016/j.jneumeth.2010.04.001. [DOI] [PMC free article] [PubMed] [Google Scholar]
Associated Data
This section collects any data citations, data availability statements, or supplementary materials included in this article.


