

SUMMARY
Down syndrome (DS) results from full or partial trisomy of chromosome 21. However, the consequences of the underlying gene-dosage imbalance on adult tissues remain poorly understood. Here we show that in Ts65Dn mice, trisomic for 132 genes homologous to HSA21, triplication of Usp16 reduces self-renewal of hematopoietic stem cells and expansion of mammary epithelial cells, neural progenitors, and fibroblasts. Moreover, Usp16 is associated with decreased ubiquitination of Cdkn2a and accelerated senescence in Ts65Dn fibroblasts. Usp16 can remove ubiquitin from H2AK119, a critical mark for the maintenance of multiple somatic tissues. Downregulation of Usp16, either by mutation of a single normal USP16 allele or by shRNAs, largely rescues all these defects. Furthermore, in human tissues overexpression of USP16 reduces the expansion of normal fibroblasts and post-natal neural progenitors while downregulation of USP16 partially rescues the proliferation defects of DS fibroblasts. Taken together, these results suggest that USP16 plays an important role in antagonizing the self-renewal and/or senescence pathways in Down syndrome and could serve as an attractive target to ameliorate some of the associated pathologies.
Keywords: Down syndrome, Ts65Dn, Ts1Cje, hematopoietic stem cell, breast, senescence, brain, neurosphere, histone ubiquitination, H2A, polycomb, PRC1, Bmi-1, Usp16, cdkn2a
INTRODUCTION
Down syndrome (DS) is a complex clinical syndrome associated with multiple pathological conditions including deficits in motor skills and learning 1,2. DS has also been associated with early onset and higher incidence of aging-related phenomena such as Alzheimer’s disease 3,4. Recently, it has been proposed that the aging process is correlated with an impaired or exhausted ability of stem cells to self-renew 5, raising the possibility that stem cell defects play a role in DS.
To gain insights into the molecular mechanisms underlying abnormalities of tissue homeostasis in Down syndrome, we investigated hematopoietic stem cells in two DS mouse models, Ts65Dn and Ts1Cje (Figure 1a). Ts65Dn mice have a third copy of approximately two thirds of the murine genes homologous to human Chromosome 21 and recapitulate several traits of the human DS, including learning and memory deficits 6. Ts1Cje mice present only 79 of the 132 trisomic genes of Ts65Dn mice (Figure 1a)1 and certain defects, such as neurologic impairment, are less severe in these mice 7,8. One of the genes uniquely triplicated in Ts65Dn is Usp16, a de-ubiquitination enzyme involved in chromatin remodeling and cell cycle progression 9. Our studies implicated Usp16 as a major factor causing expansion defects and senescence in multiple somatic tissues of Ts65Dn mice.
Figure 1. Usp16 contributes to defective HSCs in Ts65Dn mice.

a, DS mouse models. b,c, HSC frequency is decreased in Ts65Dn, but not in Ts1Cje bone marrow. Representative plots are shown (n=4). d, Colony formation assay from single HSCs. (n=3). e, Limiting dilution analysis (ELDA) of marrow cells. f, Secondary engraftment three months after transplantation, shown as percentage of donor cells in the peripheral blood. Transplants were repeated twice. g, Quantification of Usp16 mRNA. h,i, H2AK119 immunofluorescence in HSCs. The arrows indicate the stained H2AK119 foci in one representative picture. Bottom panel, quantification of positive foci (n=100 cells analyzed in two experiments). j, Knockdown of Usp16 in Ts65Dn HSCs rescues colony formation (n=3). k,l, Knockdown of Usp16 improves the engraftment potential of Ts65Dn and their ability to undergo secondary transplantation. Transplants were repeated twice.
RESULTS
Ts65Dn, but not Ts1Cje, mice have defective hematopoietic stem cells (HSCs)
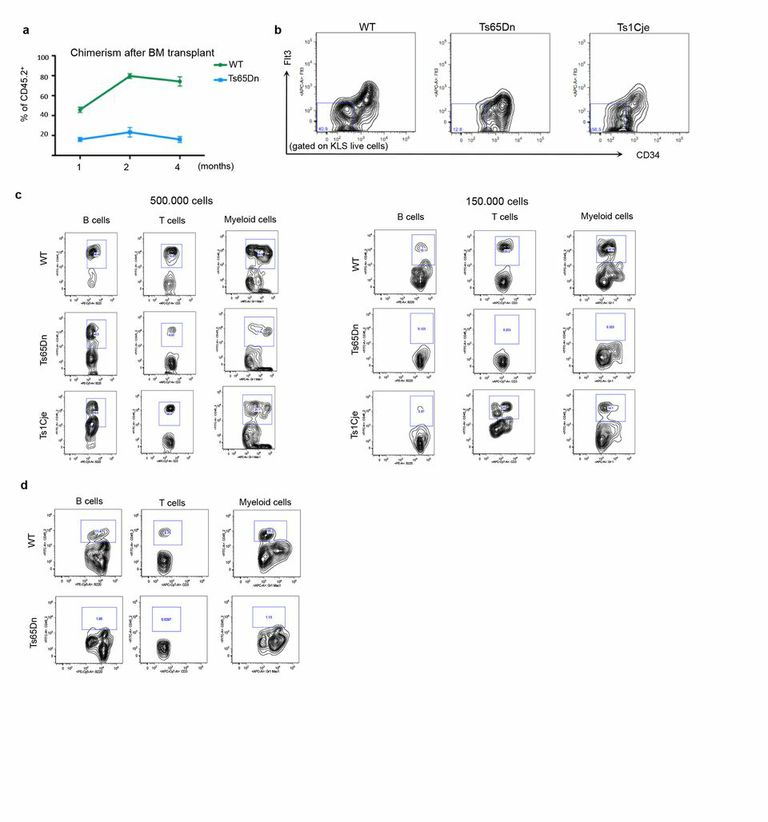
Consistent with previous observations10, transplantation of 5×10⁵ CD45.2 Ts65Dn cells resulted in lower hematopoietic chimerism in recipient mice compared to transplantation of control bone marrow cells (Extended Data Figure 1a). To elucidate the trisomic genes responsible for the impaired engraftment potential of the Ts65Dn bone marrow cells, we investigated the frequency and properties of HSCs in Ts65Dn and Ts1Cje mice. Immunophenotypical analyses showed that the fraction of CD150+CD48− or CD34−Flt3− KLS (ckit+ Lin− Sca+) cells, both of which enrich for HSCs in mice 1,2,11, was reduced by more than three-fold in Ts65Dn mice, but not in Ts1Cje mice (Figure 1b-c and Extended Data Figure 1b).
A 50% reduction in in vitro colony formation by single CD34−CD150+CD48− KLS cells compared to controls further suggested an impairment of Ts65Dn HSCs (Figure 1d) 3,4,12. To definitively assess the function of HSCs in DS, we performed serial dilution bone marrow transplantations with euploid, Ts65Dn and Ts1Cje cells. Wild type and Ts1Cje bone marrow cells reconstituted the bone marrow of lethally irradiated recipient mice with a similar HSC calculated frequency (1/80,338 and 1/103,553 respectively). However, there was a three-fold reduction in the frequency of Ts65Dn stem cells (1/307,431; p=0.0294) (Figure 1e and Extended Data Figure 1c). Furthermore, multi-lineage engraftment of Ts65Dn bone marrow cells was not observed in secondary transplants after three months (Figure 1f and Extended Data Figure 1d), confirming a severe impairment in the self-renewal ability of Ts65Dn hematopoietic cells.
Downregulation of Usp16 ameliorates the self-renewal defects of HSCs in Ts65Dn mice
Usp16 is one of the genes uniquely triplicated in Ts65Dn mice but not in Ts1Cje mice. Previous studies have reported that Usp16 can remove ubiquitin moieties from histone H2A, opposing the ubiquitination function of the Polycomb complex PRC15,9. Since Bmi1, a crucial member of the PRC1 complex, is essential for the self-renewal of stem cells in multiple tissues6,13-15, we postulated that an extra copy of Usp16, an antagonist of PRC1, could impair the self-renewal ability of stem cells in Ts65Dn mice. Consistent with the presence of three alleles, Usp16 mRNA was expressed 1.5 fold higher in Ts65Dn HSCs compared to control HSCs (Figure 1g). Moreover, immunofluorescence studies showed a two-fold reduction in the number of ubiquitinated chromatin foci in Ts65Dn CD34−CD150+CD48− KLS cells (Figure 1h-i). Both immunofluorescence and Western blots analyses also demonstrated a reduction in the level of H2AK119 ubiquitin in Ts65Dn MEF cells (Extended Data Figure 2).
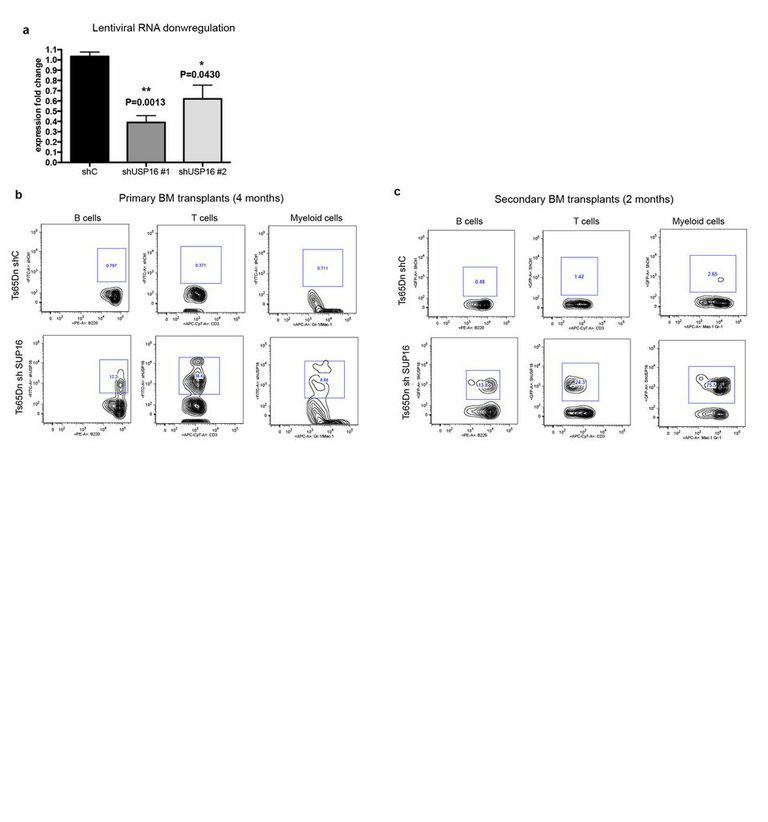
To determine whether elevated levels of Usp16 contribute to abnormalities of Ts65Dn HSCs, we generated lentiviral constructs encoding GFP and shRNAs directed against a scrambled sequence (shC) or Usp16 (shUsp16 #1 and shUsp16 #2). These hairpins reduce Usp16 expression to 40-50% leading to a final expression level similar to the one observed in control animals (Extended Data Figure 3a). 40% of single CD34− CD150+CD48− KLS Ts65Dn bone marrow cells infected with the shUsp16 lentivirus formed in vitro colonies in Methocult, compared to 20% of the shC-infected cells (Figure 1j) (p-value<0.04).
To assess the effect of Usp16 in vivo, Ts65Dn KLS cells were infected with shUsp16 or shC lentivirus and then injected into lethally irradiated C57Bl6 recipient mice. shUsp16 infected cells, but not shC cells, significantly engrafted in recipient mice (Figure 1k and Extended Data Figure 3b). Unlike Ts65Dn bone marrow cells treated with a control lentivirus, the cells transduced with the shUsp16 lentivirus could also give rise to multipotent differentiation upon serial transplantation (Figure 1l and Extended Data Figure 3c). These results demonstrate that the self-renewal defect of Ts65Dn HSCs can be substantially rescued by downregulation of Usp16 alone.
Usp16 plays a role in the expansion defect of Ts65Dn neural progenitors
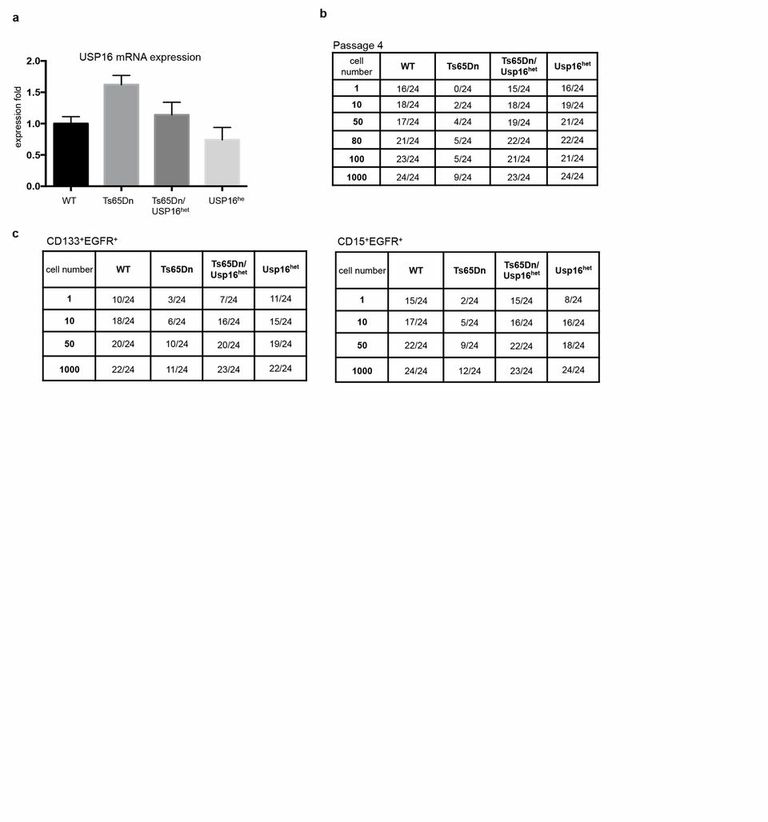
Usp16 is expressed in a major site of adult neurogenesis, the brain sub-ventricular zone (SVZ) (Extended Data Figure 4a). Since Bmi1 is known to be critical for the maintenance of neural progenitors1,15,16, we hypothesized that an extra copy of the PRC1 antagonist Usp16 could have a role in regulating also their expansion in Ts65Dn mice. To test this hypothesis, the SVZ was micro dissected from 8 week old mice brains and Lineage− cells (CD24−CD31−CD45−Ter119−) were enriched by flow cytometry and assayed for neurosphere formation during serial passaging in vitro. As previously reported, in vitro sphere formation by Ts65Dn neural progenitors is impaired7,8,17. By the fourth passage, 1/21 wild type cells formed neurospheres, while only 1/958 Ts65Dn Lin− cells could do so (p<0.0001) (Figure 2a and Extended Data Figure 4b). To define the role of an extra copy of Usp16 in neural progenitor expansion, Ts65Dn mice were bred with mice in which one of the normal Usp16 alleles was mutated (Usp16het). The offspring have a normal diploid dosage of Usp16, but retain three copies of the other genes present in the Ts65Dn parental strain (Ts65Dn/Usp16het mice). Notably, Ts65Dn/Usp16het neural progenitor cells maintained a normal frequency of Nsp-IC during serial passage (p<0.0001) (Figure 2a, b).
Figure 2. Ts65Dn mice, but not Ts65Dn/Usp16het mice, show defective neuralprogenitor cells.

a, ELDA for SVZ Lin− cells (at P4). b,c, Nsp-IC frequency and Sox2 mRNA levels decrease only in Ts65Dn culture. d,e, ELDA and secondary sphere formation experiments with the indicated populations show an neural progenitor expansion deficit specific to Ts65Dn mice. (n=3 per group in all experiments).
After four passages, expression of Sox2 (a known neural progenitor cell marker)9,18 increased two-fold in control Lin− neurospheres, but it was not detected in Ts65Dn Lin−neurospheres By contrast, Ts65Dn/Usp16het cells express comparable levels of Sox2 as control cells (Figure 2c).
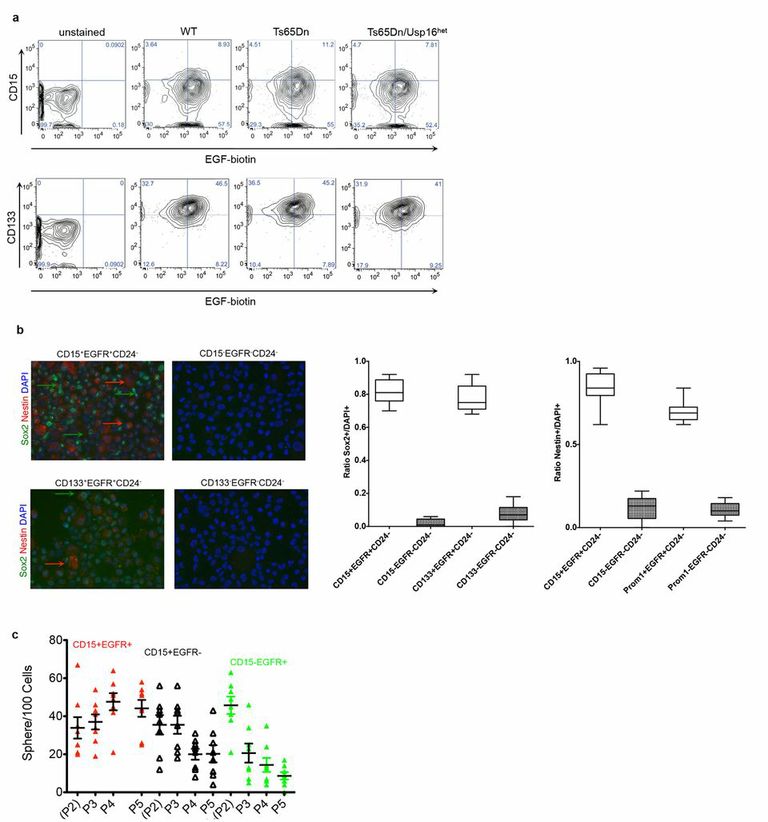
Next we analyzed, CD133+EGFR+ Lin− and CD15+EGFR+ Lin− SVZ cells10,19,20, which are enriched for neural progenitor cells. These cells express high levels of Nestin and Sox2 and retain the ability to expand in vitro upon serial passaging (Extended Data Figure 5). Sphere limiting dilution analyses of either CD133+EGFR+Lin− cells or CD15+EGFR+Lin− cells revealed a significant decrease in the frequency of Nsp-Ic in the Ts65Dn mice as compared to wild type or to Ts65Dn/Usp16het mice (Figure 2d and Extended Data Figure 4c). Moreover, Ts65Dn, but not Ts65Dn/Usp16het neural progenitors, showed a significant decrease in formation of secondary neurospheres (p<0.0001) (Figure 2e). Taken together, these data show that Ts65Dn mice have a defect in the expansion of neural progenitors that can be partially rescued by eliminating an extra allele of Usp16.
Usp16 plays a role in the in the mammary epithelium of Ts65Dn mice
Loss of Bmi1 results in severe mammary epithelium growth defects14. We therefore asked whether the extra copy of Usp16 in Ts65Dn mice might also affect the expansion of mammary epithelial cells. Like HSCs, Usp16 mRNA expression was increased approximately 1.5 fold in Ts65Dn CD49f+CD24medLin− cells (which are enriched for Mammary Repopulating Units or MRUs21,22) compared to control cells (Extended Data Figure 6a). Moreover, several Hox genes, usually repressed by the polycomb complex PRC1, were highly expressed in Ts65Dn cells (Extended Data Figure 6b). Immunophenotypical analysis of the breast tissue from Ts65Dn mice revealed a significant reduction of the overall number of CD31−CD45−Ter119− (Lin−) cells (Figure 3a and Extended Data Figure 6c). Cytokeratin staining showed that compared to wild type or Ts1Cje mice, Ts65Dn mice have an increased number of cells that co-express the luminal cell cytokeratin CK8 and the basal cell cytokeratin CK14 (Figure 3b and Extended Data Figure 6d), suggesting abnormalities in the development of the mammary epithelium.
Figure 3. Ts65Dn mammary cells are affected by levels of Usp16.

a, Lin− cells are reduced in Ts65Dn, but not in Ts1Cje glands. (n=5). b, Immunofluorescence staining shows an increase overlapping of luminal and basal cytokeratins in Ts65Dn glands. c, Ts65Dn sorted MRUs form fewer colonies then controls (n=4) d, ELDA shows a decrease number of repopulating cells in Ts65Dn, but not in Ts65Dn/Usp16het glands. Three independent experiments were performed, two for Ts65Dn/Usp16het.
To functionally test CD49f+CD24medLin− cells, a population enriched with regeneration potential 21,22, we performed 3D in vitro colony assays. Ts65Dn, but not Ts1Cje, cultures showed a reduced number of colonies (Figure 3c). Moreover, in vivo mammary transplantation assays with Lin− cells showed a significant decrease in repopulating ability of Ts65Dn Lin− cells compared to wild type or Ts65Dn/Usp16het Lin− cells (Figure 3d). As in HSCs and neural progenitors, lentiviral downregulation of Usp16 in Ts65Dn Lin− cells partially rescued mammary epithelium defects. There was a two-fold increase in the calculated frequency of MRUs in shUSP16 infected Lin- Ts65Dn cells, and the derived outgrowths were larger compared to cells infected with control shRNA (Extended Data Figure 6e). However, we were unable to generate mammary glands in secondary transplants of the Ts65Dn/ Usp16het mammary epithelial cells, suggesting that other genes may affect the proliferation of these cells in Ts65Dn mice.
Modulation of Ink4a/Arf by Usp16 in Ts65Dn cells
One of the best-characterized Bmi1/PRC1 target loci is CDKN2a23, which encodes two distinct tumor suppressors, p16Ink4a and p19Arf. Expression of p16Ink4a and p19Arf normally increases with age in both rodent and human tissues and is involved in senescence-induced loss of proliferation 24-26. To determine whether Usp16 trisomy affects proliferation and senescence, we used mouse embryonic fibroblasts (MEFs) and terminal-tip fibroblasts (TTFs). Ts65Dn, but not Ts65Dn/Usp16het TTFs, showed a marked proliferation deficit and high levels of senescence as shown by SA-βGal staining and by p16Ink4a expression (Figure 4a,b). These defects were partially rescued by an shRNA targeting Cdkn2a (Figure 4a,b and Extended Data Figure 7a-c). Ts65Dn MEF cultures showed high levels of senescence and a rapid increase of p16Ink4a and p19Arf expression levels upon passaging (Figure 4c and Extended Data Figure 7d). However, lentiviral downregulation of Usp16 with two different hairpins decreased p16Ink4a and p19Arf expression (Figure 4d). Western blots showed decreased levels of H2AK119 ubiquitination in Ts65Dn MEFs (Extended Data Figure 2) and chromatin immunoprecipitation (ChIP) analyses demonstrated a decrease in H2AK119 ubiquitin on the Ink4a/Arf locus in Ts65Dn MEFs (Figure 4e). These results strongly suggest that trisomy of Usp16 contributes to the cellular defects observed in Ts65Dn mice through increased removal of ubiquitin moieties from H2A, with an impact on the CDKN2a site. However, mutational analyses of the de-ubiquitinase domains would be required to confirm this model.
Figure 4. Usp16 contributes to proliferation defects and senescence in Ts65Dn fibroblasts.

a, Proliferation of TTFs seeded at P2. b, Senescent cells are frequent in Ts65Dn, but not in Ts65Dn/USP16het TTFs, as shown by SA-βgal and p16Ink4a staining at P3. Downregulation of cdkn2a blocks senescence. c, p16Ink4a and p19Arf mRNA levels rapidly increase during passaging in Ts65Dn MEFs. d, Downregulation of Usp16 normalizes mRNA expression of Ink4a/Arf by P6 Ts65Dn MEFs. e, ChIP analyses at the cdkn2a locus show lower levels of H2AK119 binding by two Ts65Dn MEF chromatin samples.
USP16 has a potential role in human Down syndrome
As previously reported 27,28, fibroblasts derived from Down syndrome patients showed a strong proliferation defect. Moreover, they appear to senesce prematurely (Figure 5a). Gain of function experiments were performed using normal fibroblasts to determine whether USP16 overexpression might contribute to the proliferation defects. Transduction of normal foreskin fibroblasts with a vector overexpressing USP16 slowed their proliferation (Figure 5b and Extended Data Figure 8a). Conversely, shRNA mediated downregulation of USP16 or overexpression of BMI1 resulted in increased proliferation capacity of DS fibroblasts (Figure 5c and Extended Data Figure 8b-c). Interestingly, overexpression of USP16 in two different cultures of human neural progenitor cells (from one pediatric and one adult patient) reduced their in vitro expansion potential and the formation of neurospheres. (Figure 5d and Extended Data Figure 8d). These experiments suggest a role for the third copy of USP16 in the pathologies associated with Down syndrome.
Figure 5. Human cells are affected by USP16 levels.

a, Proliferation analysis, as well as SA-βgal and p16Ink4a staining, of three control and four DS human fibroblast cultures show growth impairment and senescence of DS cells. b,c, Lentiviral overexpression of USP16 decreases the proliferation of two different control fibroblast lines, while donwregulation of USP16 in DS fibroblasts promotes proliferation. d, Overexpression of USP16 reduces the formation of neurospheres derived from human adult SVZ cells. The right panel quantifies the number of spheres in the first and second passage. (p<0.0001). All the experiments were replicated at least twice.
Discussion
Our data show that the change in self-renewal capacity of HSCs and neural progenitors, as well as the proliferation defects of mammary epithelial cells and fibroblasts in Ts65Dn mice, is linked in part to trisomy of Usp16, a negative modifier of the Polycomb Repressive Complex 1 (PRC1) activity 9. Since Bmi1, a component of PRC1, is known to regulate senescence and self-renewal of multiple somatic stem cells, this suggests that some of the pathologies associated with Down syndrome may result from a stem cell imbalance secondary to overexpression of Usp16. Clearly, other genes also play a role in traits associated with Down syndrome patients such as the increased incidence of leukemia and the decreased incidence of solid tumors (Extended Data Figure 9) 2,29, and there are likely differences between humans with Down syndrome and Ts65Dn mice. Nonetheless, the defects of human fibroblasts mirror those seen in the mouse models, and the effect of overexpression of Usp16 in human neural progenitors suggest that this gene has a similar function in human Down syndrome and in Ts65Dn mice. Although we cannot unequivocally state that the HSCs are reduced in Down syndrome patients, in two children we examined they were not increased as they might be in the liver of some human Down syndrome fetuses (Extended Data Figure 9) 30.
In conclusion, our data demonstrate a new axis of regulation of tissue homeostasis in multiple tissues. We believe that our study has broad implications for understanding one of the most common genetic abnormalities in humans, Down syndrome, and targeting the USP16 pathway may ameliorate some of the associated pathologies.
MATERIALS AND METHODS
Mice
Ts65Dn, Ts1Cje and euploid littermates mice (mixed background B6EiC3SnF1/J) were purchased from Jackson Laboratories. Mice were genotyped by real-time or by PCR as previously published (31 and Jackson website). Control littermates were used as wild type mice. These mice are heterozygous for B6 and C3H alleles at all loci in their genome. C57BL CD45.1 mice, used for bone marrow transplantation experiments, were kindly provided by Dr. Weissman, Stanford University. Usp16het mice (FVB/N-Usp16Tg(Tyr)2414FOve/Mmjax) were ordered from MMRRC. Weaning age NOD/SCID female mice were purchased by Jackson Laboratories. Mice were housed in accordance with the guidelines of Institutional Animal Care Use Committee.
Bone marrow and peripheral blood analyses
Isolation and analyses of bone marrow cells were performed as previously described 12. In brief, bone marrow cells were isolated by crushing long bones and hips with mortal and pestle in Calcium and Magnesium free HBSS with 2% heat-inactivated bovine serum. The cells were drawn by passing through a 25G needle several times, treated with ACK for 1 minute and filtered with a 40 mm nylon mesh. Before sorting, progenitor cells were enriched through magnetic isolation with Lineage cell depletion kit (Miltenyi Biotec) using an autoMACS pro Separator. Antibodies used for analyses and sort of bone marrow cells were lineage markers (CD3, CD5, CD8, Gr-1, B220 and Ter119), Sca-1, c-kit, CD150, CD48, CD135 (Flt3) and CD34.
For peripheral blood analysis, red blood cells were lysed with hypotonic buffer, and nucleated cells were stained with antibodies against CD45.1, CD45.2, Ter119, Gr-1, Mac-1, CD3 and B220.
All antibodies were directly conjugated or biotinylated and purchased from e-Bioscience, BD Biosciences, or Biolegend. Cells were gated based upon forward and side-scatter profiles, and live/dead discrimination was obtained with 7-Amino-Actinomycin D (7-AAD) or DAPI. Analyses and sorting was performed using a FACS Aria II (BD Biosciences). Data was also analyzed with FlowJo software.
Bone marrow transplants
Recipient C57Bl CD45.1 mice (8 to 12 weeks old) were lethally irradiated (1,140 rad), with two doses of radiations delivered 3 hours apart. Bone marrow single cell suspensions were obtained from long bones and hips of Ts65Dn, Ts1Cje and wild type mice (8 to 12 weeks old) and treated for 1 minute with ACK for red cells lysis. Only donor animals with a matching haplotype for the major histocompatibility antigens were used (H2K b/b)10. Recipient mice were competitively reconstituted by retro-orbital venous sinus injection with three different doses (5×10⁵ cells, 1.5×10⁵ cells, 0.5×10⁵ cells) of whole bone marrow cells from donor mice and a radioprotective dose of 3×10⁵ bone marrow cells from non irradiated C57Bl/Ka-CD45.1 mice. Five mice were used for each group. Mice were analyzed monthly for reconstitution of peripheral blood. For secondary transplants, 5×10⁶ bone marrow cells were collected at least four months after primary transplants from engrafted recipients, and injected in lethally irradiated C57Bl CD45.1 mice. Reconstitution was measured in peripheral blood at the indicated time points.
For transplantation of lentivirus-infected Ts65Dn marrow cells, KLS cells were isolated and sorted from 8 to 12 weeks old Ts65Dn H2K b/b mice. Sorted KLS were incubated overnight with the indicated lentivirus (MOI=200). The morning after, KLS were washed, mixed with a radioprotective dose of 3×10⁵ bone marrow cells from unirradiated C57Bl/Ka-CD45.1 mice, and injected in lethally irradiated mice. In parallel, 48 hours after infection we verified by FACS the level of GFP expression in infected cells, to make sure that the level of lentiviral integration would be similar between multiple samples.
For all the transplantation experiments, we consider as repopulated by donor cells the mice that had more than 1% donor-derived (CD45.2+) cells in both lymphoid (CD3+ and B220+) and myeloid (Gr-1+ and Mac-1+) subpopulations. Frequency of long-term reconstituting cells from limiting dilution experiments was calculated using ELDA software 32. All the transplants were repetead at least twice.
In vitro colony formation of hematopoietic stem cells
For Methocult cultures, we double-sorted single HSCs into U-bottom 96-well plates containing 100μl of Methocult GF M3434 media (StemCell Technologies) as previously described 12. Positive colonies were scored after seven days of culture.
Neurosphere assays
Wild type, Ts65Dn, Ts65Dn/USP16het and USP16het mice were euthanized by CO2, decapitated and their brains were immediately removed. The sub ventricular zone (SVZ) was micro dissected and stored in ice-cold PBS for further processing. The tissue was digested using TryPLE express (Invitrogen) and DNase I (250units/ml) at 37C for 10 minutes followed by trituration using a fire-polished pipette. Digested tissue was washed in ice cold PBS without calcium and magnesium, filtered through a 40um filter and resuspended in neurospheres growth media i.e Neurobasal-A (Invitrogen) and DMEM F/12 (1:1) supplemented with 2% B27-A (Invitrogen), 1%N2 (Invitrogen), mouse recombinant EGF (20ng/ml) and bFGF (20ng/ml) (Shenandoah Biotechnology) and 2ug/ml heparin (Sigma). Lineage cells were depleted using mouse CD45, CD31, CD34 and Ter119 microbeads (Miltenyi Biotec) and the negative fraction collected. For FACS analysis the cells were stained with anti-CD15-FITC (MMA; BD), anti-Prominin1-APC (ebiosciences) and biotinylated EGF complexed with PE-Cy7–streptavidin (2 μg/mL; Invitrogen)
For limiting dilution analysis, cells were directly plated in 96 wells in limiting dilution down to one cell per well. Each plating dose was done in 24 wells and the number of wells with neurospheres was counted after 10 days. For serial passaging neurospheres from each passage were collected and replated either as 100 cells per well in a 48 well dish or in a similar limiting dilution fashion as described above.
Micro dissected mouse SVZ was dissociated as described above and FACS sorted into Lin−CD15+EGFR+CD24− and Lin-CD15−EGFR−CD24− or Lin−Prom1+EGFR+CD24− and Lin−Prom1−EGFR−CD24− cells.10,000 cells were sorted for each population and concentrated by centrifugation. Cells were collected on a glass slide by cytospin and air dried prior to methanol fixation. Fixed cells were blocked using 5% normal goat serum and incubated in Rabbit anti-SOX2 antibody (ab97959, Abcam) and mouse anti-Nestin antibody (2Q178, Abcam), followed by secondary anti-mouse alexa594 and anti-rabbit alexa488 respectively. Fluorescence was visualized using standard epiflourescence microscopy. Six random fields were imaged and data represented as ratio of Sox2 or nestin positive cells per DAPI positive cells in the same field.
Mouse breast analyses
Mammary glands were dissected from either wild type, Ts65Dn or Ts1Cje mice and analyzed as previously described 21. Briefly the glands were digested in Collagenase/Hyaluronidase followed by ACK lysis, trypsin and DNAase/Dispase. The cells were then stained with the following antibodies: CD45, CD31, Ter119, CD49f and CD24 (Biolegend).
For all experiments, antibodies were directly conjugated or biotinylated and purchased from e-Bioscience, BD Biosciences, or Biolegend. Cells were gated based upon forward and side-scatter profiles, and live/dead discrimination was obtained with 7-Amino-Actinomycin D (7-AAD) or DAPI. Analyses and sorting was performed using a FACS Aria II (BD Biosciences).
In vitro mammary colony forming assays
96-well ultra-low attachment plates (BD) were prepared with a feeder layer of irradiated L-WNT3a mixed with 60μl of growth factor reduced Matrigel (BD) per well. 1000 sorted MRUs from WT, Ts65Dn or Ts1Cje mice were then plated into liquid media as previously described 33,34. 10% FBS and 2.5% growth factor reduced Matrigel were added as supplements.
Mammary transplants
Lineage− (CD45+CD31+Ter119+) cell populations were isolated from 12-week mice in staining media and resuspended in 10μl of sterile PBS + 30% matrigel per transplant before being injected into the cleared fat pads of 21-28 day old recipient NOD/SCID mice as previously described 21. All transplants were allowed to grow for at least 6 weeks but not more than 10 weeks before analysis. For knockdown of Ups16, Lineage− cells were infected with either control lentivirus or shRNA against Usp16 in DMEM/F12 + 10% FBS overnight. The cells were then washed and resuspended in sterile PBS + 30% matrigel for transplant.
For mammary transplant outgrowth area calculation, NIH Image J software was used. Briefly, GFP positive mammary ducts were measured with the free-hand tool by drawing a shape around the duct. Measurements were performed in a ‘blind’ fashion and at the same magnification for all samples. The entire fat pad was used to determine the maximum area coverage (100%). Only positive outgrowths were used in the measurement.
Immunofluorescence of mammary tissue
12 week old mice were euthanized and mammary glands were surgically removed. Glands were fixed in formalin overnight and then transferred to 70% ethanol. They were then embedded in paraffin and sectioned for histology. For staining the slides were deparafinised in xylene and alcohol grades. Antigen retrieval was carried out in Tris-EDTA buffer by heating in a microwave for 20min. Primary antibodies CK14 (Covance) and CK8 were applied overnight. Secondary antibodies were anti-rat DyLight 488 and anti-rabbit DyLight 594 (both from Jackson Labs). Sections were then mounted using Prolong Anti-fade reagent (Invitrogen). Images were taken with a NIKON inverted microscope. Lumosity software was used to quantify the Pearson’s correlation of overlapping between CK8 and CK14.
Western Blot and Chromatin Immunoprecipitation
For Western blot analyses, chromatin extracts were prepared with subcellular protein fractionation kit (Thermo Scientific). H2AK119 antibody (rabbit) was purchased from Cell Signaling; H2A antibody was purchased from Millipore.
Chromatin Immunoprecipitation was performed essentially as previously described 35 using the polyclonal antibody for H2AK119 (Cell Signaling).
Lentivirus preparation
The lentiviral vector that we used for downregulation was vector pSicoR-GFP 36. We cloned the following hairpins: shC (TTCTCCGAACGTGTCACGT) shUSP16 #1 (CGAGTGCTGTATTCCTTATAT), shUSP16 #2 (TTCTCTGGAAATACACCTATG), shp16 (CATCAAGACATCGTGCGATAT), shp19 (GCCATCTAAACGGTTCAGTTT), human shUSP16 (TA TAT CAG TTC ACC CGT AAT). A lentivirus construct expressing Cherry and Bmi1 (pEIZ-HIV-mCherry-Bmi1) was kindly provided by Dr. Y. Shimono 37. USP16 overexpression vector was obtained by subcloning USP16 clone (ATCC) in pCDH-MSCV-GFP vector or pCDH-EF1A-GFP vector (SBI).
Viruses were produced in 293T cells with a second-generation lentivirus system. Supernatants were collected at 48hrs and 72hrs, and concentrated through ultracentrifugation 38. Viral titers were calculated by FACS analyses of 293T cells infected with serial dilution of concentrated virus.
Mouse Embryonic Fibroblasts (MEFs) and Terminal Tip-Tail Fibroblasts (TTFs)
Mouse embryonic fibroblasts (MEFs) were generated from E14.5 embryos obtained from Ts65Dn mothers. Genotype was verified by real time PCR. Cells were passaged 1:4 when almost confluent. To culture mouse primary tip-tail fibroblasts (TTFs), the skin was peeled from tail tips of wild type (n=4), Ts65Dn (n=3), Ts65Dn/Usp16het (n=3) and Usp16het (n=1) 8-weeks old mice, finely minced with a blade and shortly digested in trypsin. Resulting pieces were incubated in DMEM containing 20% FBS for three weeks. Derived fibroblasts were then passaged to new plates and considered P2. Human fibroblasts (WT: CRL-2088, CRL-2076; DS: CCL-54, CRL-7090, CRL-7031) were purchased by ATCC. Other fibroblast cultures (DS:GM2508 and normal fibroblasts) were kindly provided by Dr. James Weimann and Dr. Samuele Marro (Stanford University).
Fibroblasts proliferation, SA-ßGal and p16 staining
5×10³ fibroblasts were seeded in a 24-well plate and viable cells were counted by trypan blue exclusion at the indicated time points.
For SA-ßGal staining of senescent cells, the Senescence Detection Kit (Abcam, ab65351) was used according to manufacturer’s protocol.
For p16 staining, fibroblasts were permeabilized with 0,2% Triton-PBS, blocked in 3% BSA-PBS and stained with a mouse anti-human p16 (JC8, Santa Cruz Biotechnology, CA) or rabbit anti-mouse p16. Specific secondary antibodies (Alexa Fluor 488 anti-mouse and Alexa Fluor 647 anti-rabbit) were used 1:1000.
SA-ßGal and p16 staining were detected by microscope at 10× and the positive cells were evaluated in three different fields per well. Three technical replicates were performed. In experiments with infected cells, cells were sorted based on GFP or Cherry expression and expression of the construct was verified by real-time PCR.
Human neurospheres assays
Human adult SVZ neurospheres were derived from a rapid autopsy excised adult human brain (National disease research interchange) sub ventricular zone (SVZ). Pediatric SVZ neurospheres were derived from sub ventricular tissue surgically excised during a functional hemispherectomy. Human tissue was acquired under Institutional approved IRB protocol no. 18672 and the Stanford stem cell research oversight committee (SCRO) no. 370.
Human tissue was digested using collagenase IV (1mg/ml) and DNase I (250units/ml) at 37 degees for 30 minutes followed by trituration using a fire polished pipette. Digested tissue was washed in ice cold HBSS without calcium and magnesium, filtered through a 40um filter and resuspended in neurospheres growth media i.e Neurobasal-A (Invitrogen) and DMEM F/12 (1:1) supplemented with 2% B27-A (Invitrogen), 1%N2 (Invitrogen), human recombinant EGF (20ng/ml) and bFGF (20ng/ml) (Shenandoah Biotechnology) LIF (20ng/ml) (millipore) and 2ug/ml heparin (Sigma).
For lentiviral infection, neurospheres were dissociated into single cells and 50,000 cells were infected with pCDH-EF1a-GFP-Luc or pCDH-EF1a-GFP-USP16 at MOI of 25 and followed for GFP expression. Live GFP+ cells were clone sorted at a count of 100 cells/well were in a 96 well plate and number of neurospheres was counted after 7 days in culture. For secondary sphere forming ability, neurospheres formed during the previous experiment were re-dissociated and again plated at 100 cells/well in a 96 well plate and number of spheres per well were counted. Experiment was repeated at two different passages.
RNA expression analyses
For real-time analyses, cells were collected in Trizol (Invitrogen), and RNA was extracted following the manufacturer’s protocol. cDNA was obtained using Superscript III First Strand Synthesis (Invitrogen).
Real time reactions were assembled using Taqman probes (Applied Biosystem) in accordance with the manufacturers’ directions. Expression data were normalized by the expression of housekeeping genes ActB and GAPDH. Probes used in this study: USP16 (mouse: Mm_00470393, Mm_00470406; human: Hs01062190_m1, Hs01062191_m1), p16Ink (Mm_01257348, Mm_00494449), p19Arf (Mm_00486943), ActB (Mm_00607939), GAPDH (Mm_99999915), Hoxa1 (Mm00439359_m1), Hoxa3 (Mm01326402_m1), Hoxa5 (Mm01326402_m1), Bmi1 (Hs00995519_g1), Sox2 (NM_011443, System Bioscencies).
Immunofluorescence of histones in MEFs and HSCs
Cells were cultured for 48 hours (for MEFs) or directly cytospinned on glass slides after purification (for HSC). Cells were fixed in PFA 2% for 10 minutes and washed in PBS triton 0.1%. We performed a blocking incubation in PBS with Donkey serum 10% for 1 hour at room temperature prior to incubation with primary antibody at 4 C overnight. Incubation with secondary antibody and DAPI was set for 45 minutes at RT. Alternatively antibody staining was performed with Zenon Kit (Invitrogen) following manufacturer’s directions. Samples were then mounted and imaged.
Imaging was performed using a Zeiss Observer Z1 fluorescent microscope (Zeiss) equipped with a Hamamatsu Orca-ER camera or a Zeiss confocal system LSM710 (Zeiss). Data acquisition and foci measurements were performed using Improvision Volocity software (Perkin Elmer).
The primary antibody used in this study was anti Ubiquityl-histone H2A D27C4 (Cell Signaling). Secondary antibodies were Alexa 488 and 594.
Details of antibodies and primary cells
Detailed information regarding antibodies and primary cells used in the experiments are listed below.
| Vendor | Catalog # | Item Description | |
|---|---|---|---|
| Antibodies used for mouse hematopoiesis studies | |||
| eBioscience | 15-0031-82 | CD3e | Anti-mCD3e PeCy5 |
| Biolegend | 100609 | CD5 | Antibody, anti-mouse CD5-PE/Cy5 |
| eBioscience | 15-0081-81 | CD8a | Antibody, anti-mouse CD8a-PE/Cy5 |
| eBioscience | 17-5931-81 | Gr-1 | Antibody, anti-mouse LY-6G (Gr-1)-APC |
| eBioscience | 15-0452-82 | B220 | PeCy5 anti-mouse/human CD45R (B220) |
| Biolegend | 116232 | Ter119 | Mouse Ter119-PacB |
| Biolegend | 108120 | Sca-1 | Antibody, Pac Blue Sca-1 clone D7 |
| eBioscience | 47-1171-82 | c-kit | c-kit APC 780 |
| Biolegend | 115904 | CD150 | CD150 PE |
| Biolegend | 103411 | CD48 | CD48 APC |
| eBioscience | 17-1351-82 | CD135 (Flt3) | Anti-Mouse CD135 (Flt3) APC |
| eBioscience | 11-0341-82 | CD34 | Anti-mouse CD34-FITC |
| eBioscience | 12-0453-81 | CD45.1 | Antibody, anti-mouse CD45.1-PE |
| eBioscience | 11-0454-81 | CD45.2 | Antibody, anti-mouse CD45.2-FITC |
| Biolegend | 116232 | Ter119 | Mouse Ter119-PacB |
| Biolegend | 101211 | Mac-1 | Antibody, anti-mCD11b(Mac-1)-APC |
| eBioscience | 15-0031-82 | CD3e | Anti-mCD3e PeCy5 Antibody, anti-human/mouse |
| eBioscience | 12-0452-81 | B220 | CD45R (B220)-PE |
| Antibodies used for murine mammary epithelial studies | |||
| Biolegend | 313616 | CD49f | APC anti-human/mouse CD49f |
| Biolegend | 101822 | CD24 | PECy7 anti-mouse CD24 |
| Biolegend | 103126 | CD45 | Mouse CD45-PacB |
| Biolegend | 116232 | Ter119 | Mouse Ter119-PacB |
| Biolegend | 102422 | CD31 | Mouse CD31-PacB |
| DSHB, University of Iowa | TROMA-I | CK8 | TROMA-I, cytokeratin Endo-A, marker for mouse endoderm |
| Covance | PRB-155P-100 | CK14 | Keratin14(AF64) |
| Antibodies used for chromatin studies | |||
| Ubiquityl-histone H2A (Lys119) | |||
| Cell Signaling Tech | 8240S | (D27C4) XP rabbit mAb | |
| Millipore | 05-678 | Antibody, ant ubiquityl histone h2a | |
| Invitrogen | A11001 | Alexa Fluor 488 | Alexa Fluor 488 goat anti-mouse IgG (H+L) |
| Invitrogen | A11037 | Alexa Fluor 594 | Alexa Fluor 594 goat anti-rabbit IgG (H+L) |
| For Lineage Gating (Flow cytometry) | |||
| Biolegend | 103133 | CD45 | Brilliant Violet 421™ anti-mouse CD45 Antibody |
| Biolegend | 102423 | CD31 | Brilliant Violet 421™ anti-mouse CD31 Antibody |
| Biolegend | 119321 | CD34 | Brilliant Violet 421™ anti-mouse CD34 Antibody |
| Biolegend | 116233 | Ter119 | Brilliant Violet 421™ anti-mouse TER-119/Erythroid Cells Antibody |
| For Lineage Depletion (MACS) | |||
| Biolegend | 103104 | CD45 | Biotin anti-mouse CD45 Antibody |
| Biolegend | 102504 | CD31 | Biotin anti-mouse CD31 Antibody |
| Biolegend | 119304 | CD34 | Biotin anti-mouse CD34 Antibody |
| Biolegend | 116204 | Ter119 | Biotin anti-mouse TER-119/Erythroid Cells Antibody |
| Miltenyi | 130-090-485 | anti-biotin | Anti-Biotin MicroBeads |
| Antibodies for neural progenitor studies | |||
| BD Biosciences | 340703 | CD15 | CD15 (SSEA-1, Lewis X)- FITC |
| eBioscience | 17-1331-81 | Prominin1 | Anti-Mouse CD133 (Prominin-1) APC |
| Biolegend | 101808 | CD24 | PE anti-mouse CD24 Antibody |
| Life Technologies | E-3477 | EGF | Epidermal Growth Factor, Biotin-XX Conjugate (biotin EGF) |
| Biolegend | 405206 | Streptavidin | PE/Cy7 Streptavidin |
| Immunocytochemistry | |||
| Abcam | ab97959 | Sox2 | Rabbit polyclonal Anti-SOX2 antibody (ab97959) |
| Abcam | ab6142 | Nestin | Anti-Nestin antibody [2Q178] |
|
Fibroblast cell culture
cells |
|||
| ATCC | CCl-54 | fibrobalsts Down Syndrome | |
| ATCC | CRL-7090 | fibrobalsts Down Syndrome | |
| ATCC | CRL-7031 | fibrobalsts Down Syndrome | |
| ATCC | CRL-2088 | fibrobalsts Down Syndrome | |
| ATCC | CRL-2076 | fibrobalsts Down Syndrome | |
| Antibodies used for p16 detection | |||
| Santa Cruz | sc-56330 | p16 (JC8) | |
| Invitrogen | A11001 | Alexa Fluor 488 | Alexa Fluor 488 goat anti-mouse IgG |
| Invitrogen | A21245 | Alexa Fluor 647 | Alexa Fluor 647 goat anti-rabbit IgG (H+L) |
Supplementary Material
ED Figure 1. Ts65Dn, but not Ts1Cje bone marrow, show a decreased number of functional HSCs.
a, Impaired engraftment ability of Ts65Dn bone marrow cells in transplantation experiments. The percentage of donor cells (CD45.2+) was evaluated at the indicated time point. (5 mice per group, repeated twice). b, Representative FACS plot of KLS cells show a reduced number of CD34− Flt3− cells in Ts65Dn marrows. (4 mice of each genotype were examined) c, Peripheral blood analyses four months after bone marrow transplant revealed multineage engraftment in Ts65Dn mice only with 500.000 donor cells; lower doses of Ts65Dn donor bone marrow failed to reconstitute hematopoietic lineages. d, Multilineage analyses of peripheral blood three months after bone marrow transplantation showed that Ts65Dn bone marrow cells failed to reconstitute secondary recipients. Representative FACS plots are shown.
ED Figure 2. HSCs in Ts65Dn mice have lower levels of H2A ubiquitination.
a, Immunofluorescence for H2A on Lys119 show a decrease in the number of positive foci in MEFs derived from Ts65Dn embryos compared to controls. Each dot represents a different cell and each column a different mouse. One hundred cells per group were analyzed and the experiment was repeated twice. b, H2AK119+ staining is decreased in Ts65Dn compared to control MEFs. c, Western blot analyses of chromatin extracts from MEFs. H2AK119+ levels are decreased in Ts65Dn (quantification performed using ImageJ software). H2A Western blotting verifies equal loading of extracts.
ED Figure 3. Downregulation of Usp16 improves engraftment of Ts65Dn KLS cells in primary and secondary transplants.
a, Usp16 mRNA quantification after infection of KLS cells with the indicated lentivirus. b, Peripheral blood analyses revealed multineage engraftment from Ts65 KLS bone marrow cells infected with a shUsp16 hairpin. Representative FACS plots are shown. c, Two months after transplantation in secondary recipients, shC Ts65Dn bone marrow cells fail to engraft, while shUsp16 Ts65Dn cells show multilineage reconstitution. Representative FACS plots are shown.
ED Figure 4. Analyses of Nsp-IC frequency in neurospheres cultures.
a, Usp16 mRNA quantification in murine neurospheres cultures (P4). b,c, Raw data used for ELDA analyses of Nsp-IC derived from Lin− SVZ cells or for the indicated sorted population. For each cell dilution, 24 replicates were tested. The table indicates the number of positive wells in each condition.
ED Figure 5. CD15+ EGFR+ and Prom1+ EGFR+ populations are enriched for neuronal progenitors in mice.
a, Representative FACS plots are shown for viable Lin- cells derived from SVZ preparations. Double positive cells were sorted and used for testing neurosphere-formation potential. b, Representative pictures of immunofluorescence staining for Sox2 and Nestin on the indicated sorted populations. The arrows indicate cells scored positive for Sox2 (green) or Nestin (red). For this analysis, the indicated Lin− cell populations were FACS sorted and collected by cytospin. On the right, twelve fields were randomly selected for analyses from four wild type mice from different litters. The percentage of positive cells is given by the ratio of cells positive for Sox2 or Nestin among the DAPI+ cells. c, Neurosphere expansion in vitro during passaging by different sorted populations derived from mouse SVZ. CD15+ EGFR+ cells are able to expand upon passaging.
ED Figure 6. Defects in mammary glands in DS mice models
a,b. mRNA quantification of Usp16 and different Hox genes in CD49highCD24med mammary cells. Hox1, Hox3 and Hox5 are expressed at higher levels in Ts65Dn cells. c, Representative FACS plot of mammary cells gated on live cells (first row) or live Lin− cells. We observed a perturbation in the overall FACS profile with reduction of basal and luminal cells (indicated gates) in Ts65Dn mice but not in Ts1Cje mice. These experiments were repeated 5 times for each group. d, Quantification of overlap between staining for the basal cytokeratin CK14 (red) and the luminal cytokeratin CK8 (green). Pearson’s correlation analyses (Lumosity software) showed a marked increase in cells that co-stain for both cytokeratins in Ts65Dn mammary epithelium. Each experiment was repeated with 3 mice per group. e, infection partially in vivo Usp16 by shRNA lentiviral Downregulation of by Ts65Dn rescues the defects shown mammary (p=0.03). Three independent On transplantation experiments were performed. cells d filled by GFP outgrowths is significantly higher upon the right, the percentage of fat pa downregulation of Usp16 (p=0.007).
ED Figure 7. Senescence in Ts65Dn fibroblasts is affected by levels of Usp16 and Cdkn2a
a, Western blot analyses verifies knockdown of p16. B-actin was used as a loading control. b, Proliferation of Ts65Dn TTFs increased upon infection with a hairpin targeting cdkn2a. Control TTFs proliferate more upon downregulation of both p16Ink4a and p19Arf. The experiment was repeated three times with similar results. c, Representative pictures of p16Ink4a immunostaining (left) and quantification of the percentage of positive cells (right panel). Each dot represents a TTF culture derived from a different mouse. The hairpin effectively ablates p16Ink4a expression. d, SA-βgal staining in control and Ts65Dn MEFs at P4. Representative pictures are shown on the left. The percentages of positive cells are shown on the right. Experiments were replicated with three different MEF lines per genotype.
ED Figure 8. Human fibroblast cultures
a,b, mRNA quantification of USP16 upon lentiviral overexpression or downregulation. c, BMI1 overexpression significantly increases the proliferation of fibroblasts derived from a DS carrier. The effect on control fibroblasts is not significant. On the right, the levels of expression of Bmi1 mRNA were quantified by quantitative real-time PCR. The experiment was repeated twice with similar results. d, Overexpression of USP16 reduces the formation of neurospheres derived from human pediatric SVZ cells. On the right, the quantification of the number of spheres obtained in the first and in the second passage. All the experiments were replicated twice.
ED Figure 9. HSCs in human bone marrow derived from DS patients
On the left, representative plot of Lin- cells derived from human bone marrow. On the right, a plot of the percentage of CD34+ CD38−CD90+ observed between the Lin- cells (DS: two samples; healthy donors: three samples). Down Syndrome bone marrow samples were retrieved from sternal biopsies obtained from children undergoing heart surgery at Stanford University. The families were consented according to IRB approved protocols. Control bone marrow samples were obtained from AllCells, LLC. All samples were processed and stained as previously published (R. Majeti, Cell Stem Cells 2007).
Although we cannot unequivocally state that the HSCs are reduced in Down syndrome patients, in these children they are not increased as they might be in the liver of some human Down syndrome fetuses. Down syndrome is associated with increased rates of childhood leukemia and decreased rates of some adult solid tumors. We can only speculate as to why Down syndrome predisposes individuals to one type of malignancy and protects from another, and whether USP16 plays a role in either observation. Other syndromes causing bone marrow failure, such as Fanconi’s anemia, predispose to leukemia. Lymphoid leukemias in Down syndrome patients frequently involve mutation of CDKN2a. Since Cdkn2a appears to play a role in the proliferation defects caused by trisomy of Usp16, mutations of CDKN2A could give DS HSCs a strong selection advantage. Differences between fetal liver and adult bone marrow HSCs could provide another explanation for an increased incidence of leukemia in Down syndrome. An expansion of Down syndrome fetal liver HSCs but not of adult bone marrow HSCs could also explain why Down syndrome leukemia appears to originate more often in fetal blood cells.
Acknowledgments
We thank Samuele Marro for help in establishing MEFs and TTFs lines; Dr. Irving L. Weissman for sharing C57Bl CD45.1 mice; the animal core facility of SIM1 and in particular Alexander Valledifiera and Mike Alvarez. This study was supported in part by CIRM basic biology award III, National Institute of Health grant#CA100225, CIRM bridges fellowship (VHA), Fondazione Umberto Veronesi (BNdR), Breast Cancer Research Program sponsored by Department of Defense (SS), Stanford Graduate Fellowship (YO) as well as the Down Syndrome Research and Treatment Foundation (DSRTF) and the Fidelity Foundation (CCG).
Footnotes
Contributions:
MA and MFC designed the project and wrote the manuscript. MA identified Usp16 in a genetic screen, constructed the lentiviral constructs and carried out bone marrow experiments. SS performed most of the breast experiments. SM performed most of the neural experiments. MA, BNdR, DQ, AK, VHA, JR and YO contributed to mouse colony handling, lentivirus preparation and to mouse fibroblast experiments. MQ performed the imaging studies. VR provided the bone marrow specimens. SC and CG oversaw the neural progenitor experiments, provided animals and reagents, and revised the manuscript. Project management was carried out by MA. There is no conflict of interest to declare.
REFERENCES
- 1.Antonarakis SE, Lyle R, Dermitzakis ET, Reymond A, Deutsch S. Chromosome 21 and down syndrome: from genomics to pathophysiology. Nat. Rev. Genet. 2004;5:725–738. doi: 10.1038/nrg1448. [DOI] [PubMed] [Google Scholar]
- 2.Yang Q, Rasmussen SA, Friedman JM. Mortality associated with Down’s syndrome in the USA from 1983 to 1997: a population-based study. Lancet. 2002;359:1019–1025. doi: 10.1016/s0140-6736(02)08092-3. [DOI] [PubMed] [Google Scholar]
- 3.Roth GM, Sun B, Greensite FS, Lott IT, Dietrich RB. Premature aging in persons with Down syndrome: MR findings. AJNR Am J Neuroradiol. 1996;17:1283–1289. [PMC free article] [PubMed] [Google Scholar]
- 4.Zigman WB, Lott IT. Alzheimer’s disease in Down syndrome: neurobiology and risk. Ment Retard Dev Disabil Res Rev. 2007;13:237–246. doi: 10.1002/mrdd.20163. [DOI] [PubMed] [Google Scholar]
- 5.Liu L, Rando TA. Manifestations and mechanisms of stem cell aging. J. Cell Biol. 2011;193:257–266. doi: 10.1083/jcb.201010131. [DOI] [PMC free article] [PubMed] [Google Scholar]
- 6.Reeves RH, et al. A mouse model for Down syndrome exhibits learning and behaviour deficits. Nat. Genet. 1995;11:177–184. doi: 10.1038/ng1095-177. [DOI] [PubMed] [Google Scholar]
- 7.Sago H, et al. Genetic dissection of region associated with behavioral abnormalities in mouse models for Down syndrome. Pediatr. Res. 2000;48:606–613. doi: 10.1203/00006450-200011000-00009. [DOI] [PubMed] [Google Scholar]
- 8.Sago H, et al. Ts1Cje, a partial trisomy 16 mouse model for Down syndrome, exhibits learning and behavioral abnormalities. Proc. Natl. Acad. Sci. U.S.A. 1998;95:6256–6261. doi: 10.1073/pnas.95.11.6256. [DOI] [PMC free article] [PubMed] [Google Scholar]
- 9.Joo H-Y, et al. Regulation of cell cycle progression and gene expression by H2A deubiquitination. Nature. 2007;449:1068–1072. doi: 10.1038/nature06256. [DOI] [PubMed] [Google Scholar]
- 10.Lorenzo LPE, et al. Defective hematopoietic stem cell and lymphoid progenitor development in the Ts65Dn mouse model of Down syndrome: potential role of oxidative stress. Antioxid. Redox Signal. 2011;15:2083–2094. doi: 10.1089/ars.2010.3798. [DOI] [PMC free article] [PubMed] [Google Scholar]
- 11.Chao MP, Seita J, Weissman IL. Establishment of a normal hematopoietic and leukemia stem cell hierarchy. Cold Spring Harb. Symp. Quant. Biol. 2008;73:439–449. doi: 10.1101/sqb.2008.73.031. [DOI] [PubMed] [Google Scholar]
- 12.Akala OO, et al. Long-term haematopoietic reconstitution by Trp53-/-p16Ink4a-/-p19Arf-/- multipotent progenitors. Nature. 2008;453:228–232. doi: 10.1038/nature06869. [DOI] [PubMed] [Google Scholar]
- 13.Park I-K, et al. Bmi-1 is required for maintenance of adult self-renewing haematopoietic stem cells. Nature. 2003;423:302–305. doi: 10.1038/nature01587. [DOI] [PubMed] [Google Scholar]
- 14.Pietersen AM, et al. Bmi1 regulates stem cells and proliferation and differentiation of committed cells in mammary epithelium. Curr. Biol. 2008;18:1094–1099. doi: 10.1016/j.cub.2008.06.070. [DOI] [PubMed] [Google Scholar]
- 15.Molofsky AV, et al. Bmi-1 dependence distinguishes neural stem cell self-renewal from progenitor proliferation. Nature. 2003;425:962–967. doi: 10.1038/nature02060. [DOI] [PMC free article] [PubMed] [Google Scholar]
- 16.Cao G, et al. Bmi-1 absence causes premature brain degeneration. PLoS ONE. 2012;7:e32015. doi: 10.1371/journal.pone.0032015. [DOI] [PMC free article] [PubMed] [Google Scholar]
- 17.Lorenzi HA, Reeves RH. Hippocampal hypocellularity in the Ts65Dn mouse originates early in development. Brain Res. 2006;1104:153–159. doi: 10.1016/j.brainres.2006.05.022. [DOI] [PubMed] [Google Scholar]
- 18.Ellis P, et al. SOX2, a persistent marker for multipotential neural stem cells derived from embryonic stem cells, the embryo or the adult. Dev. Neurosci. 2004;26:148–165. doi: 10.1159/000082134. [DOI] [PubMed] [Google Scholar]
- 19.Fischer J, et al. Prospective isolation of adult neural stem cells from the mouse subependymal zone. Nat Protoc. 2011;6:1981–1989. doi: 10.1038/nprot.2011.412. [DOI] [PubMed] [Google Scholar]
- 20.Pastrana E, Cheng L-C, Doetsch F. Simultaneous prospective purification of adult subventricular zone neural stem cells and their progeny. Proc. Natl. Acad. Sci. U.S.A. 2009;106:6387–6392. doi: 10.1073/pnas.0810407106. [DOI] [PMC free article] [PubMed] [Google Scholar]
- 21.Stingl J, et al. Purification and unique properties of mammary epithelial stem cells. Nature. 2006;439:993–997. doi: 10.1038/nature04496. [DOI] [PubMed] [Google Scholar]
- 22.Shackleton M, et al. Generation of a functional mammary gland from a single stem cell. Nature. 2006;439:84–88. doi: 10.1038/nature04372. [DOI] [PubMed] [Google Scholar]
- 23.Jacobs JJ, Kieboom K, Marino S, DePinho RA, van Lohuizen M. The oncogene and Polycomb-group gene bmi-1 regulates cell proliferation and senescence through the ink4a locus. Nature. 1999;397:164–168. doi: 10.1038/16476. [DOI] [PubMed] [Google Scholar]
- 24.Liu Y, et al. Expression of p16(INK4a) in peripheral blood T-cells is a biomarker of human aging. Aging Cell. 2009;8:439–448. doi: 10.1111/j.1474-9726.2009.00489.x. [DOI] [PMC free article] [PubMed] [Google Scholar]
- 25.Krishnamurthy J, et al. Ink4a/Arf expression is a biomarker of aging. J. Clin. Invest. 2004;114:1299–1307. doi: 10.1172/JCI22475. [DOI] [PMC free article] [PubMed] [Google Scholar]
- 26.Janzen V, et al. Stem-cell ageing modified by the cyclin-dependent kinase inhibitor p16INK4a. Nature. 2006;443:421–426. doi: 10.1038/nature05159. [DOI] [PubMed] [Google Scholar]
- 27.Kimura M, et al. Proliferation dynamics in cultured skin fibroblasts from Down syndrome subjects. Free Radic. Biol. Med. 2005;39:374–380. doi: 10.1016/j.freeradbiomed.2005.03.023. [DOI] [PubMed] [Google Scholar]
- 28.Carmeliet G, David G, Cassiman JJ. Cellular ageing of Alzheimer’s disease and Down syndrome cells in culture. Mutat. Res. 1991;256:221–231. doi: 10.1016/0921-8734(91)90013-2. [DOI] [PubMed] [Google Scholar]
- 29.Arron JR, et al. NFAT dysregulation by increased dosage of DSCR1 and DYRK1A on chromosome 21. Nature. 2006;441:595–600. doi: 10.1038/nature04678. [DOI] [PubMed] [Google Scholar]
- 30.Roy A, et al. Perturbation of fetal liver hematopoietic stem and progenitor cell development by trisomy 21. Proc. Natl. Acad. Sci. U.S.A. 2012;109:17579–17584. doi: 10.1073/pnas.1211405109. [DOI] [PMC free article] [PubMed] [Google Scholar]
- 31.Reinholdt LG, et al. Molecular characterization of the translocation breakpoints in the Down syndrome mouse model Ts65Dn. Mamm. Genome. 2011;22:685–691. doi: 10.1007/s00335-011-9357-z. [DOI] [PMC free article] [PubMed] [Google Scholar]
- 32.Hu Y, Smyth GK. ELDA: extreme limiting dilution analysis for comparing depleted and enriched populations in stem cell and other assays. J. Immunol. Methods. 2009;347:70–78. doi: 10.1016/j.jim.2009.06.008. [DOI] [PubMed] [Google Scholar]
- 33.Dalerba P, et al. Single-cell dissection of transcriptional heterogeneity in human colon tumors. Nat. Biotechnol. 2011;29:1120–1127. doi: 10.1038/nbt.2038. [DOI] [PMC free article] [PubMed] [Google Scholar]
- 34.Zeng YA, Nusse R. Wnt proteins are self-renewal factors for mammary stem cells and promote their long-term expansion in culture. Cell Stem Cell. 2010;6:568–577. doi: 10.1016/j.stem.2010.03.020. [DOI] [PMC free article] [PubMed] [Google Scholar]
- 35.Negishi M, et al. A novel zinc finger protein Zfp277 mediates transcriptional repression of the Ink4a/arf locus through polycomb repressive complex 1. PLoS ONE. 2010;5:e12373. doi: 10.1371/journal.pone.0012373. [DOI] [PMC free article] [PubMed] [Google Scholar]
- 36.Ventura A, et al. Cre-lox-regulated conditional RNA interference from transgenes. Proc. Natl. Acad. Sci. U.S.A. 2004;101:10380–10385. doi: 10.1073/pnas.0403954101. [DOI] [PMC free article] [PubMed] [Google Scholar]
- 37.Shimono Y, et al. Downregulation of miRNA-200c links breast cancer stem cells with normal stem cells. Cell. 2009;138:592–603. doi: 10.1016/j.cell.2009.07.011. [DOI] [PMC free article] [PubMed] [Google Scholar]
- 38.Tiscornia G, Singer O, Verma IM. Production and purification of lentiviral vectors. Nat Protoc. 2006;1:241–245. doi: 10.1038/nprot.2006.37. [DOI] [PubMed] [Google Scholar]
Associated Data
This section collects any data citations, data availability statements, or supplementary materials included in this article.
Supplementary Materials
ED Figure 1. Ts65Dn, but not Ts1Cje bone marrow, show a decreased number of functional HSCs.
a, Impaired engraftment ability of Ts65Dn bone marrow cells in transplantation experiments. The percentage of donor cells (CD45.2+) was evaluated at the indicated time point. (5 mice per group, repeated twice). b, Representative FACS plot of KLS cells show a reduced number of CD34− Flt3− cells in Ts65Dn marrows. (4 mice of each genotype were examined) c, Peripheral blood analyses four months after bone marrow transplant revealed multineage engraftment in Ts65Dn mice only with 500.000 donor cells; lower doses of Ts65Dn donor bone marrow failed to reconstitute hematopoietic lineages. d, Multilineage analyses of peripheral blood three months after bone marrow transplantation showed that Ts65Dn bone marrow cells failed to reconstitute secondary recipients. Representative FACS plots are shown.
ED Figure 2. HSCs in Ts65Dn mice have lower levels of H2A ubiquitination.
a, Immunofluorescence for H2A on Lys119 show a decrease in the number of positive foci in MEFs derived from Ts65Dn embryos compared to controls. Each dot represents a different cell and each column a different mouse. One hundred cells per group were analyzed and the experiment was repeated twice. b, H2AK119+ staining is decreased in Ts65Dn compared to control MEFs. c, Western blot analyses of chromatin extracts from MEFs. H2AK119+ levels are decreased in Ts65Dn (quantification performed using ImageJ software). H2A Western blotting verifies equal loading of extracts.
ED Figure 3. Downregulation of Usp16 improves engraftment of Ts65Dn KLS cells in primary and secondary transplants.
a, Usp16 mRNA quantification after infection of KLS cells with the indicated lentivirus. b, Peripheral blood analyses revealed multineage engraftment from Ts65 KLS bone marrow cells infected with a shUsp16 hairpin. Representative FACS plots are shown. c, Two months after transplantation in secondary recipients, shC Ts65Dn bone marrow cells fail to engraft, while shUsp16 Ts65Dn cells show multilineage reconstitution. Representative FACS plots are shown.
ED Figure 4. Analyses of Nsp-IC frequency in neurospheres cultures.
a, Usp16 mRNA quantification in murine neurospheres cultures (P4). b,c, Raw data used for ELDA analyses of Nsp-IC derived from Lin− SVZ cells or for the indicated sorted population. For each cell dilution, 24 replicates were tested. The table indicates the number of positive wells in each condition.
ED Figure 5. CD15+ EGFR+ and Prom1+ EGFR+ populations are enriched for neuronal progenitors in mice.
a, Representative FACS plots are shown for viable Lin- cells derived from SVZ preparations. Double positive cells were sorted and used for testing neurosphere-formation potential. b, Representative pictures of immunofluorescence staining for Sox2 and Nestin on the indicated sorted populations. The arrows indicate cells scored positive for Sox2 (green) or Nestin (red). For this analysis, the indicated Lin− cell populations were FACS sorted and collected by cytospin. On the right, twelve fields were randomly selected for analyses from four wild type mice from different litters. The percentage of positive cells is given by the ratio of cells positive for Sox2 or Nestin among the DAPI+ cells. c, Neurosphere expansion in vitro during passaging by different sorted populations derived from mouse SVZ. CD15+ EGFR+ cells are able to expand upon passaging.
ED Figure 6. Defects in mammary glands in DS mice models
a,b. mRNA quantification of Usp16 and different Hox genes in CD49highCD24med mammary cells. Hox1, Hox3 and Hox5 are expressed at higher levels in Ts65Dn cells. c, Representative FACS plot of mammary cells gated on live cells (first row) or live Lin− cells. We observed a perturbation in the overall FACS profile with reduction of basal and luminal cells (indicated gates) in Ts65Dn mice but not in Ts1Cje mice. These experiments were repeated 5 times for each group. d, Quantification of overlap between staining for the basal cytokeratin CK14 (red) and the luminal cytokeratin CK8 (green). Pearson’s correlation analyses (Lumosity software) showed a marked increase in cells that co-stain for both cytokeratins in Ts65Dn mammary epithelium. Each experiment was repeated with 3 mice per group. e, infection partially in vivo Usp16 by shRNA lentiviral Downregulation of by Ts65Dn rescues the defects shown mammary (p=0.03). Three independent On transplantation experiments were performed. cells d filled by GFP outgrowths is significantly higher upon the right, the percentage of fat pa downregulation of Usp16 (p=0.007).
ED Figure 7. Senescence in Ts65Dn fibroblasts is affected by levels of Usp16 and Cdkn2a
a, Western blot analyses verifies knockdown of p16. B-actin was used as a loading control. b, Proliferation of Ts65Dn TTFs increased upon infection with a hairpin targeting cdkn2a. Control TTFs proliferate more upon downregulation of both p16Ink4a and p19Arf. The experiment was repeated three times with similar results. c, Representative pictures of p16Ink4a immunostaining (left) and quantification of the percentage of positive cells (right panel). Each dot represents a TTF culture derived from a different mouse. The hairpin effectively ablates p16Ink4a expression. d, SA-βgal staining in control and Ts65Dn MEFs at P4. Representative pictures are shown on the left. The percentages of positive cells are shown on the right. Experiments were replicated with three different MEF lines per genotype.
ED Figure 8. Human fibroblast cultures
a,b, mRNA quantification of USP16 upon lentiviral overexpression or downregulation. c, BMI1 overexpression significantly increases the proliferation of fibroblasts derived from a DS carrier. The effect on control fibroblasts is not significant. On the right, the levels of expression of Bmi1 mRNA were quantified by quantitative real-time PCR. The experiment was repeated twice with similar results. d, Overexpression of USP16 reduces the formation of neurospheres derived from human pediatric SVZ cells. On the right, the quantification of the number of spheres obtained in the first and in the second passage. All the experiments were replicated twice.
ED Figure 9. HSCs in human bone marrow derived from DS patients
On the left, representative plot of Lin- cells derived from human bone marrow. On the right, a plot of the percentage of CD34+ CD38−CD90+ observed between the Lin- cells (DS: two samples; healthy donors: three samples). Down Syndrome bone marrow samples were retrieved from sternal biopsies obtained from children undergoing heart surgery at Stanford University. The families were consented according to IRB approved protocols. Control bone marrow samples were obtained from AllCells, LLC. All samples were processed and stained as previously published (R. Majeti, Cell Stem Cells 2007).
Although we cannot unequivocally state that the HSCs are reduced in Down syndrome patients, in these children they are not increased as they might be in the liver of some human Down syndrome fetuses. Down syndrome is associated with increased rates of childhood leukemia and decreased rates of some adult solid tumors. We can only speculate as to why Down syndrome predisposes individuals to one type of malignancy and protects from another, and whether USP16 plays a role in either observation. Other syndromes causing bone marrow failure, such as Fanconi’s anemia, predispose to leukemia. Lymphoid leukemias in Down syndrome patients frequently involve mutation of CDKN2a. Since Cdkn2a appears to play a role in the proliferation defects caused by trisomy of Usp16, mutations of CDKN2A could give DS HSCs a strong selection advantage. Differences between fetal liver and adult bone marrow HSCs could provide another explanation for an increased incidence of leukemia in Down syndrome. An expansion of Down syndrome fetal liver HSCs but not of adult bone marrow HSCs could also explain why Down syndrome leukemia appears to originate more often in fetal blood cells.