

Abstract
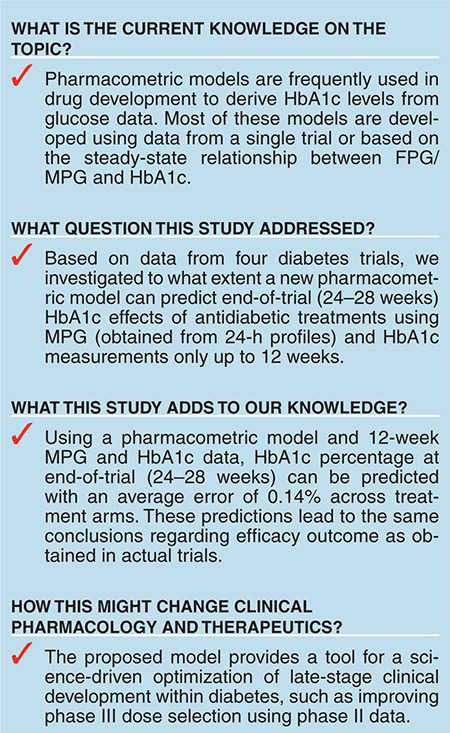
Late-phase clinical trials within diabetes generally have a duration of 12–24 weeks, where 12 weeks may be too short to reach steady-state glycated hemoglobin (HbA1c). The main determinant for HbA1c is blood glucose, which reaches steady state much sooner. In spite of this, few publications have used individual data to assess the time course of both glucose and HbA1c, for predicting HbA1c. In this paper, we present an approach for predicting HbA1c at end-of-trial (24–28 weeks) using glucose and HbA1c measurements up to 12 weeks. The approach was evaluated using data from 4 trials covering 12 treatment arms (oral antidiabetic drug, glucagon-like peptide-1, and insulin treatment) with measurements at 24–28 weeks to evaluate predictions vs. observations. HbA1c percentage was predicted for each arm at end-of-trial with a mean prediction error of 0.14% [0.01;0.24]. Furthermore, end points in terms of HbA1c reductions relative to comparator were accurately predicted. The proposed model provides a good basis to optimize late-stage clinical development within diabetes.
Glycated hemoglobin (HbA1c) is a well-established biomarker for assessing efficacy of new therapeutic agents for diabetes.1,2,3,4 It is a good marker of long-term glucose control and reflects the integrated mean glucose concentration over the past 8–12 weeks.3 HbA1c is thereby a less variable measure of mean glucose in the clinical trial setting compared with daily glucose measurements. Thus, it represents the main efficacy biomarker used in diabetes trials.1,2 Compared with glucose, accurate evaluation based on HbA1c needs longer treatment periods, due to the longer time needed to reach steady state. This generally causes late-phase trials to have a duration of 12–24 weeks, where 12 weeks may be too short to reach steady-state HbA1c and 24 weeks significantly increases the time and cost of development. To improve the utilization of data from these shorter trials, where HbA1c has not always reached a stable level, models of glucose and HbA1c homeostasis have been suggested.5,6,7,8
One approach for predicting HbA1c utilizes the steady-state relations between glucose and HbA1c obtained by regression techniques. However, this approach is hampered by trial-to-trial differences in the glucose–HbA1c relation,9 leading to a wide range of predicted mean HbA1c values. In addition, a clear difference in the glucose–HbA1c regression line was seen between the conventional and the intensive treatment groups in the Diabetes Control and Complications trial,10,11 a finding which we have confirmed using in-house data (unpublished data). This inadequacy of classical regression techniques in predicting HbA1c calls for more advanced methods for predicting HbA1c at steady state.
The first models for glucose and HbA1c were developed to understand the biochemical reactions and the dynamic relationship,12,13,14 whereas a recent approach in this field integrates loss of HbA1c due to erythrocyte turnover and chemical degradation.9 Other models integrate the glucose–HbA1c relationship into a description of drug pharmacokinetics and pharmacodynamics based on clinical data,15 which offers a framework for prediction of HbA1c based on clinical trial data. A recent attempt in this direction also integrates hemoglobin levels into a pharmacokinetics/glucose/HbA1c/Hb model.5
In this work, we used an approach for predicting HbA1c at steady state using the dynamic relation between glucose and HbA1c during the first 12 weeks of treatment. The approach was validated using clinical trial data (mean plasma glucose (MPG) from 24-h profiles and serial measurements of HbA1c) for several different treatments of patients with type 2 diabetes. We optimized the model as a tool for end-of-trial HbA1c prediction, and we focused on model validation and characterization of the predictive performance. The aim of the study was to include only the most dominant factors for explaining the glucose–HbA1c relationship. No covariate factors were included, thus restricting the model to predict results in similar patient populations. In this study, we specifically focused on the ability to predict the end-of-trial HbA1c in phase III/IV trials based on data up to 12 weeks.
Results
Model diagnostics and predictive performance of the final structural model (Figure 1) were assessed using data from four trials including 2,265 individuals with type 2 diabetes (Table 1). For diagnostic purposes, the median and the variability of model simulations were compared with those of the observations within the range of 12 weeks using a visual predictive check (VPC) (Figures 2 and 3). For evaluation of predictive performance, data up to 12 weeks were applied for prediction of HbA1c at end-of-trial. Neither glucose nor HbA1c data after 12 weeks were used when predicting HbA1c at end-of-trial. Baseline characteristics of each arm in the trials are presented in Table 1.16,17,18,19
Figure 1.
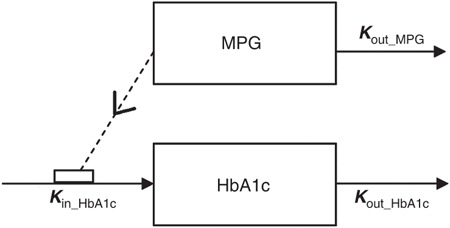
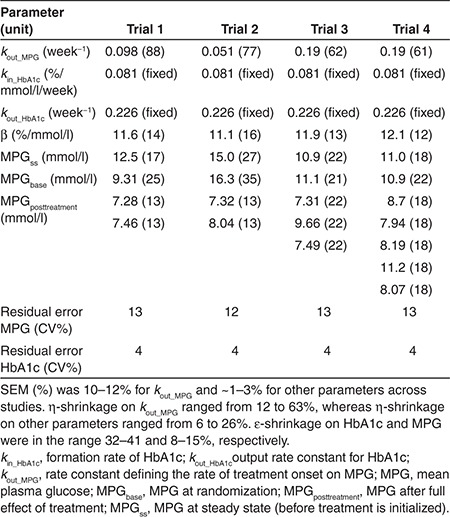
The model is an indirect response model where the production of HbA1c is stimulated by mean plasma glucose (MPG) through the parameter kin_HbA1c that is fixed to 0.081%/mmol/l per week. The model is initialized in steady state, at the time of the screening visit, where MPGss is the value for MPG (see Table 2 for parameter values). MPG is assumed to change during a washout/run-in period toward MPGbase typically obtained at the baseline visit. MPGposttreatment is the stable glucose value obtained after introducing the experimental treatment. kout_MPG is the rate constant defining the rate of treatment onset on MPG. The parameter kout_HbA1c defines the output rate constant for HbA1c and is fixed to 0.226 per week. The present model further introduces a parameter β that allows an offset in the linear relationship between MPG and HbA1c in steady state. Thus, kin_HbA1c is stimulated by MPG + β (see model code in Supplementary Material online).
Table 1. Summary of trials included in validation.
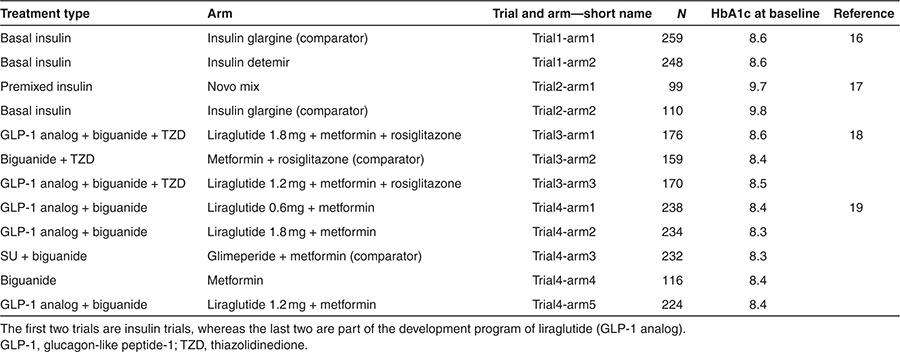
Figure 2.
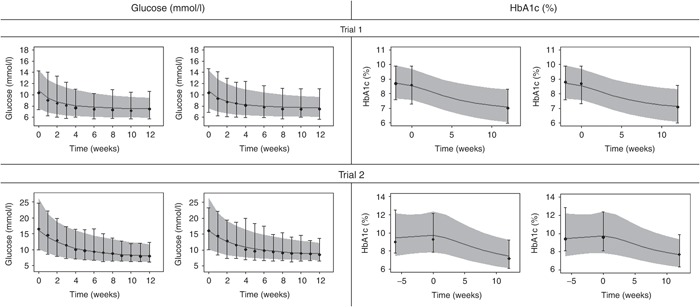
Visual predictive checks for mean plasma glucose (MPG) over time (left) and HbA1c (right) of each arm of the insulin studies16,17 presented in Table 1. The arm numbers are followed from left to right, so left is arm 1 and right arm 2. Further descriptions can be found in Table 1. Solid gray (light) line presents median of predictions and shaded area presents 95% confidence interval for predictions as predicted without uncertainty in parameter estimates. Median and 95% confidence interval of observations are presented by black dots and whiskers. Week 0 corresponds to the week of randomization.
Figure 3.
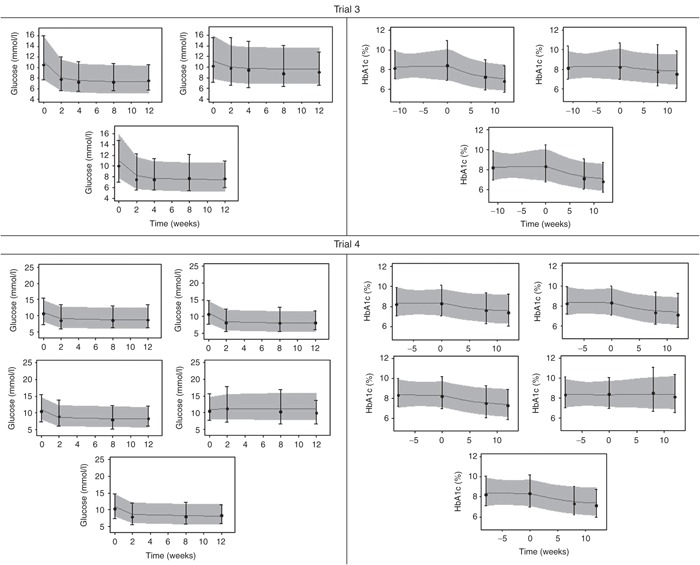
Visual predictive checks for mean plasma glucose over time (left) and HbA1c (right) in each arm of the glucagon-like peptide-1 analogue studies18,19 presented in Table 1. The arm numbers are followed from left to right and top to bottom and descriptions are found in Table 1. Solid gray (light) line presents median of predictions and shaded area presents 95% confidence interval for predictions as predicted without uncertainty in parameter estimates. Median and 95% confidence interval of observations are presented by black dots and whiskers. Week 0 corresponds to the week of randomization.
Structural model for MPG and HbA1c
The structural glucose–HbA1c model uses MPG and HbA1c data as dependent variables (Figure 1). MPG was obtained from 8- to 11-point (24 h) glucose profiles and MPGss, MPGbase, and MPGposttreatment were estimated in the model (Table 2). MPGss, MPGbase, and MPGposttreatment are parameters defining MPG at steady state (before treatment is initialized), MPG at randomization, and MPG after full effect of treatment, respectively. The model is an indirect response model in which MPG stimulates the formation rate (kin_HbA1c) of HbA1c. The total stimulation of HbA1c production in vivo (kin_HbA1c) is driven by MPG + β, where β is a parameter that expresses the intercept between MPG and HbA1c at steady state. Elimination of MPG and HbA1c are both represented as first-order processes governed by kout_MPG and kout_HbA1c, respectively. The development of this model was performed on an extensive in-house database with data from different phases of drug development of both approved and nonapproved drugs under investigation. The selection of the model was based on objective function value and predictive performance in the form of HbA1c prediction error, assessed by comparing the mean of the individual predictions vs. the mean of the observations of HbA1c. As a step in the development, the predictive performance when using fasting plasma glucose (FPG) vs. using MPG was compared, and the mean prediction error was ~0.5 and ~0.4% when using FPG and MPG, respectively (details not shown). The parameters reflecting glycosylation of hemoglobin (kin_HbA1c and kout_HbA1c) were fixed to 0.081% per mmol/l per week and 0.226 per week, respectively. For each trial presented in this article, all parameters, except kin_HbA1c and kout_HbA1c, were estimated using a nonlinear mixed-effects approach as done for the development of the model (Table 2). To assess the impact of keeping kin_HbA1c and kout_HbA1c fixed, we re-estimated these, which caused significantly worse HbA1c predictions. Furthermore, a sensitivity analysis was performed, by changing each of the two parameters by ±25%, which resulted in mean HbA1c prediction errors across the different arms ranging from 0.1 to 0.3%.
Table 2. Typical values of parameter estimates and (CV%) from estimation performed on 12-week data from each trial.
In this article, the predictive performance and validation of the model were assessed specifically by estimating the model from data up to 12 weeks and evaluating HbA1c predictions at end-of-trial (week 24–28).
Model validation
The model was applied to four different trials, and VPCs were generated for each arm by simulation of MPG and HbA1c, respectively (Figures 2 and 3). The VPCs were obtained by simulating predictions from the model based on 12-week data for each arm, 500 times. Thus, the VPCs present a predictive check of the consistency between the model and observed data within the range of the data (up to 12 weeks). The VPCs performed on the insulin trials (Figure 2) and glucagon-like peptide-1 trials (Figure 3) show that both the median and the variability of the MPG and HbA1c data were captured well by the model simulations.
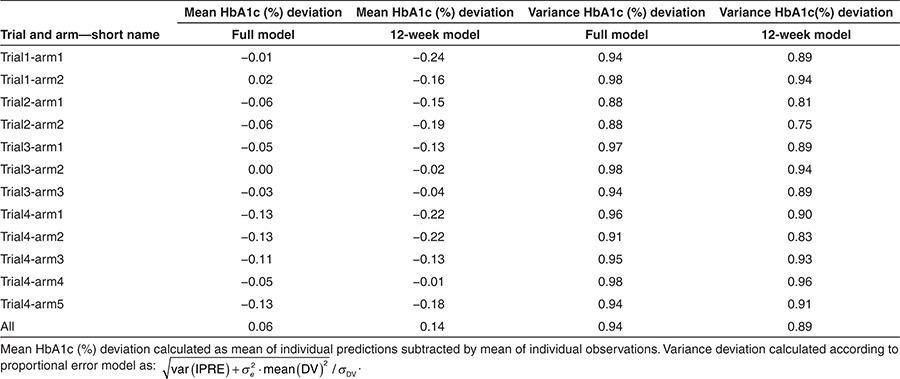
For evaluation of predictive performance, we evaluated the ability of the model to predict mean HbA1c at end-of-trial (Table 3) for subjects with an HbA1c assessment at end-of-trial. The second and third columns in Table 3 present the difference between the mean of the individual predictions and the mean of the individual observations in each arm. Values in column 2 were obtained using the model estimated on all data, whereas values in column 3 were obtained using the model estimated on 12-week data only. Thus, it is expected that the values in column 2 are numerically lower than the ones in column 3. HbA1c, at end-of-trial, was predicted with a mean prediction error of 0.06% (ranging from 0.0 to 0.13%) and 0.14% (ranging from 0.01 to 0.24%), when using all data (full model) and 12-week data only, respectively. To compare the observed vs. predicted variance of HbA1c at end-of-trial, variance ratios are presented in columns 4 and 5. The variance ratio was 0.94 (range: 0.88–0.98) and 0.89 (range: 0.75–0.96) using the full model and 12-week data, respectively. This indicates a slight underprediction of the variance (see Methods for calculation).
Table 3. Evaluation of HbA1c predictions at end-of-trial based on full and 12-week data.
For further evaluation of the model, we investigated whether conclusions regarding treatment outcome in terms of efficacy compared with comparator could be drawn based on 12-week data (Figure 4). Calculations of mean ΔHbA1c and corresponding confidence intervals for each comparison are shown for observations (black dots/lines) and predictions based on 12-week data (gray dots/lines). Similar conclusions based on predictions of end-of-trial (from 12-weeks data) and observed data were obtained for all arms.
Figure 4.
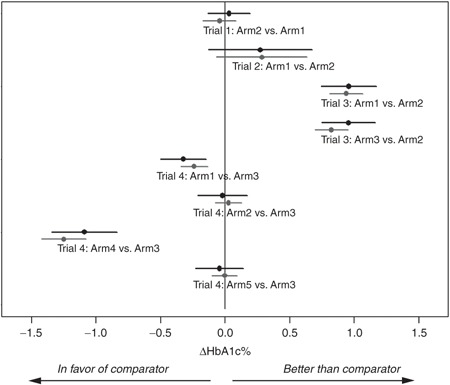
Overview of prediction performance in each arm. Abscissa presents the percentage change in HbA1c (ΔHbA1c) following 24–28 weeks of treatment compared with main comparator (see description in Table 1). Each line presents 95% confidence interval for treatment effect vs. comparator calculated from observations (black) and predictions from 12 weeks (gray). Dots present mean difference in ΔHbA1c between comparator and the specific arm.
Discussion
Our aim was to propose and validate a model for predicting the dynamic relation between glucose and HbA1c within a trial of antidiabetic treatment. The predictive performance was evaluated by estimating the proposed model on 12-week data and predicting end-of-trial (24–28 weeks) HbA1c. The model was validated on phase III/IV trials to evaluate predictions of HbA1c at steady state, which are rarely obtained during earlier phases of clinical drug development. The model was able to predict HbA1c at end-of-trial (24–28 weeks) with a mean prediction error of 0.14% ranging from 0.01 to 0.24% across the different treatment arms.
FPG has previously been applied as the main driver for the glycosylation process;5 and under the development of the presented model, we compared the performance using FPG and MPG, and MPG was shown to be superior. From a prediction point of view, this was in line with our expectations because (i) MPG is derived from more than one glucose measurement making it less sensitive to measurement errors compared with FPG and (ii) contrary to MPG, FPG may produce bias for trials where changes in HbA1c are mainly resulting from changes in postprandial rather than fasting glucose. The strong predictive performance obtained using MPG observed in our study is further supported by the higher correlation found between MPG and HbA1c compared with other glucose measures such as FPG or PPG.20
The number of samples needed to obtain a robust measure of MPG can vary depending on the meal sizes, frequency, and response of the subjects during the day. A premeal sample and a postprandial sample at each meal should be sufficient, but an additional sample at bedtime is generally recommended, and it may be considered to take a sample during the night as well. The timing of the measurement of the postprandial glucose is crucial and will be affected by a subject's response to insulin. Postprandial glucose peak time is typically reported to be around 1 h for healthy subjects. For type 1 diabetics, lacking endogenous insulin secretion, the peak time of glucose after a meal will depend on the pharmacokinetics and pharmacodynamics of the administered exogenous insulin. By contrast, in subjects with type 2 diabetes, who typically secrete insulin, a delayed postprandial glucose peak time as well as a prolonged duration of hyperglycemia after a meal will typically be seen. The accuracy of MPG calculation based on a profile with only one postprandial sample will thus be highly sensitive to when it is taken and sampling at suboptimal time may lead to underestimation of both the peak and duration of hyperglycemia.
We found slight differences between trials and individuals in both the slope and intercept of the relation between MPG and HbA1c at steady state, as shown previously for type 1 diabetes subjects.10 This led us initially to test models in which kin_HbA1c and/or kout_HbA1c were estimated in each arm—but these models resulted in significantly worse end-of-trial HbA1c predictions (from 12-week data) than the final model, in which these parameters were fixed. By contrast, per-individual estimation of the intercept (β in the model) provided improved predictions, and was thus implemented in the model.
Our study shows accurate prediction of changes in HbA1c following initiation of antidiabetic treatment. Investigation of these changes required inclusion of pretreatment data, which cannot be assumed to be at steady state because of short-term changes during the run-in/washout period. The inclusion of non–steady-state data thus required the use of a dynamic model rather than a regression model. Moreover, a flexible initialization was required to include pretreatment data. This flexible initialization was obtained by estimating the pretreatment glucose at steady state (MPGss), which cannot be verified by data since sampling of glucose profiles is rarely done at screening. Clearly, data with 24-h glucose profiles sampled at screening could be valuable to further validate the model of MPGss before treatment.
Theoretically, HbA1c at steady state may depend not only on the corresponding glucose at steady state but also on the patient characteristics. A previous analysis based on continuous glucose profiles performed by Nathan et al.21 investigated whether age, sex, diabetes type, race/ethnicity, and smoking status affect this relation. No difference in the linear relation between the different groups was found. In this analysis, we did not investigate how covariates influence the relation between glucose and HbA1c.
A major part of the recently published models linking glucose to HbA1c have also taken into account the turnover of the red blood cells (RBCs). Three different approaches have been considered: (i) a homogenous life-span model,22 (ii) a random destruction model,6 and (iii) a transit-compartment model, which takes into account variation in life-span of RBC.5 A comparison of the models (based on both clinical data and direct measures of biotin-labeled RBCs) revealed that an extended version of the transit-compartment model with 12 compartments was superior for description of RBC survival.7 Although the choice of RBC model was shown to impact predictions of HbA1c in a clinical trial, our results suggest that accurate predictions can still be obtained in a population with type 2 diabetes subjects without inclusion of difference in RBC life-span.
The presented model differs from previously proposed models in the sense that it is a dynamical model that needs serial samples of both HbA1c and MPG to provide successful predictions of HbA1c at steady state. Potentially, the use of more data can improve both the precision and the accuracy of predictions compared with a steady-state solution as the one derived by Samtani et al.8 or a model using solely MPG values.7 Clearly, this also leads to longer run times for this model. This is a minor issue as the model can estimate and simulate trials with >500 patients in around 3–4 h. Therefore, we do not consider the implementation of the presented model as a potential bottleneck in a drug-development application.
Applications for drug development
Potentially, the presented model has both within-study and between-study applications in drug development. Thus, it is important that the predictive performance is seen in light of what is needed from a drug-development perspective. One way is to compare with the noninferiority margins of 0.3–0.4% appearing in the regulatory guidance documents for the development of antidiabetic treatments.1,2 Relating our results to these criteria, we found the accuracy obtained to be within an acceptable range for direct applications in drug development.
For drug-development purposes and decision making, it is also important to obtain a correct measure of precision. In our study, we did not include parameter uncertainty in predictions, which might be a reason for the higher precision in predictions. Including uncertainty in parameter estimates would result in a wider confidence interval, but it is not expected to impact the mean of the individual predictions.
Within-study prediction using the presented model could support the application of adaptive trial designs. At predefined time points, the model can be used for HbA1c prediction, and decisions could be made, for e.g., to change dosing, if a dose level is predicted to be inferior. Such a design would, compared with a traditional parallel design, optimize the efficacy information. Furthermore, in such a design, it would be possible to maintain some patients on treatment for a long duration and thereby increase the safety information from the trial.
Moreover, in dose-finding trials where HbA1c cannot always be assumed to reach steady state, the ability to predict steady-state outcome based on early data would allow improved estimation of the dose–response curve and thus provides a basis for improved dose selection in phase III trials. Furthermore, the use of a longitudinal modeling approach as applied here would ensure that individuals with long/short treatment duration will accurately support parameter estimation, thus supporting the improved estimation of complete response in the studied population.
In this article, we have evaluated how the presented model can be used to predict within-study HbA1c using phase III/IV data. This enabled us to directly compare end-of-study predictions and observations. A future application of the model is to predict HbA1c across trials, for e.g., by predicting the outcome of phase III trial based on shorter phase II data.
In conclusion, we have presented and evaluated a model describing the dynamic relation between MPG and HbA1c following various antidiabetic treatments. The model predicted HbA1c at end-of-trial (24–28 weeks) based on 12-week data with high accuracy (0.01 to 0.24% prediction error in HbA1c in each arm) and can thus be used as a framework to support trial designs within late-stage drug development in the area of diabetes.
Methods
Trial design and patients. Three phase III trials and one phase IV trial from a clinical database of already approved pharmaceuticals16,17,18,19 were used for the validation of the model. The trials were required to include glucose profile and HbA1c sampling at least three times up to end-of-trial, which dependent on trial was delivered at 24, 26, or 28 weeks. MPG values were obtained from glucose profiles sampled 8–11 times during the day, using AUC0–24 h / 24 h or using an interpolation of the relationship with FPG, as described below. Only trials with HbA1c sampling at baseline were included. The selected trials included treatment arms with oral antidiabetic drugs, glucagon-like peptide-1, and insulin—all administered to subjects with type 2 diabetes (Table 1). Only completers were included in the analysis set. All studies were conducted in accordance with the ethical principles in the Declaration of Helsinki.
Nonlinear mixed-effects model. Model development was performed using nonlinear mixed-effects modeling. The software NONMEM (version 7.1.2 by ICON Development Solutions, Ellicott City, MD)23 with the first-order conditional estimation and the ADVAN13 (linear/nonlinear kinetics) subroutine was used. The programs PsN and Xpose were used to assess VPCs.24 From each model, 500 data sets were simulated using final model parameters and the original data sets. The data were evaluated by graphical comparisons between the model predicted and the observed median and 95% prediction interval.
Comparison of competing models using the objective function values in likelihood ratio tests guided the model development; however, predictive performance evaluation similar to those shown in this study was the primary tool used for model selection. Development was based on data originating from a large database of in-house clinical data consisting of both approved and nonapproved pharmaceuticals. This resulted in the structural model, linking MPG and HbA1c as presented in Figure 1 (see Supplementary Material online for model code).
MPGss, MPGbase, MPGposttreatment, kout_MPG, and β are treatment- or trial-dependent parameters that were estimated for each individual, using a log-normal interindividual variability model, where the covariance matrix for the log-transformed parameters was block diagonal with a 2 by 2 block for MPGbase and MPGposttreatment and a 2 by 2 block for MPGss and β. Correlation between MPGss and β is thought to originate from the inclusion criteria, thus subjects with low MPGss and low β may be excluded due to low HbA1c, which may introduce a correlation. A proportional residual error model was used for both MPG and HbA1c.
For most trials, FPG was measured more frequently than MPG, e.g., to facilitate titration of insulin doses. Thus, it was judged reasonable to utilize these FPG data to more precisely estimate the time course of glucose changes. To convert FPG into MPG, we used a linear relationship between individual FPG and MPG values. This relationship is, however, expected to be treatment and trial dependent, and will thus change from baseline to end-of-trial. To mitigate this error, any FPG value recorded at time points where no 8- to 11-point profiles were taken was transformed into two MPG values, one originating from the time point of the most recent profile and the other from the time point of the next coming profile. The MPG value predicted from the observed FPG value at the relevant time point was then obtained by linear interpolation of these two values.
Diagnostics and evaluation of predictive performance. For diagnostic purposes, we evaluated the final model by VPCs expressing median and variability of individual model-based simulations of MPG and HbA1c for each arm in each of the trials (Figures 2 and 3). To measure predictive performance, we evaluated the ability of the model to predict HbA1c at end-of-trial (24–28 weeks) using 12-week data. Therefore, for each individual, HbA1c was predicted from baseline up to 24–28 weeks dependent on the length of the specific trial using MPG and HbA1c samples up to 12 weeks.
The measure for predictive performance was calculated as the mean prediction error of the individual predicted minus observed HbA1c at end-of-trial for each arm. The variance of the predictions vs. the observations at end-of-trial was evaluated by assessing a variance ratio calculated as follows:
where IPRE is the individual prediction and DV the observed value. These measures are presented in Table 3.
To also check whether the model could predict the outcome of each trial, the change in HbA1c was evaluated against comparator based on both predictions and observations (Figure 4). Confidence intervals and mean values for model predictions and observations were based on calculations of changes against comparator using individual predictions and measurements, respectively.
Conflict of interest
J.B.M., R.V.O., N.R.K., S.K., and S.H.I. are employees of Novo Nordisk A/S and own stock/stock options in the company. No other potential conflicts of interest relevant to this article were reported.
Author contributions
J.B.M, R.V.O, M.C.K, N.R.K, S.K, S.H.I, and M.O.K wrote the manuscript. J.B.M, R.V.O, M.C.K, N.R.K, S.K., S.H.I, and M.O.K designed the research. J.B.M. and R.V.O performed the research. J.B.M. and R.V.O analyzed the data
Acknowledgments
The research leading to these results has received support from the Innovative Medicines Initiative Joint Undertaking under grant agreement n° 115156, resources of which are composed of financial contributions from the European Union's Seventh Framework Programme (FP7/2007–2013) and EFPIA companies' kind contribution. The DDMoRe project is also financially supported by contributions from Academic and SME partners.
References
- Guidance for industry, diabetes mellitus: developing drugs and therapeutic biologics for treatment and preventionUS Department of Health and Human Services, FDA, Center for Drug Evaluation and Research (CDER), February 2008.
- Guideline on clinical investigation of medicinal products in the treatment of diabetes mellitusCommittee for Medicinal Products for Human Use (CHMP), CPMP/EWP/1080/00 Rev. 1, 14 May 2012, EMA.
- Nathan D.M., Turgeon H., Regan S. Relationship between glycated haemoglobin levels and mean glucose levels over time. Diabetologia. 2007;50:2239–2244. doi: 10.1007/s00125-007-0803-0. [DOI] [PMC free article] [PubMed] [Google Scholar]
- Jeff Coate S.L. Diabetes control and complications: the role of glycated haemoglobin, 25 years on. Diabet Med. 2004;21:657–665. doi: 10.1046/j.1464-5491.2003.01065.x. [DOI] [PubMed] [Google Scholar]
- Hamrén B., Björk E., Sunzel M., Karlsson M. Models for plasma glucose, HbA1c, and hemoglobin interrelationships in patients with type 2 diabetes following tesaglitazar treatment. Clin. Pharmacol. Ther. 2008;84:228–235. doi: 10.1038/clpt.2008.2. [DOI] [PubMed] [Google Scholar]
- de Winter W., et al. A mechanism-based disease progression model for comparison of long-term effects of pioglitazone, metformin and gliclazide on disease processes underlying Type 2 diabetes mellitus. J. Pharmacokinet. Pharmacodyn. 2006;33:313–343. doi: 10.1007/s10928-006-9008-2. [DOI] [PubMed] [Google Scholar]
- Lledó-García R., Kalicki R.M., Uehlinger D.E., Karlsson M.O. Modeling of red blood cell life-spans in hematologically normal populations. J. Pharmacokinet. Pharmacodyn. 2012;39:453–462. doi: 10.1007/s10928-012-9261-5. [DOI] [PubMed] [Google Scholar]
- Samtani M.N. Simple pharmacometric tools for oral anti-diabetic drug development: competitive landscape for oral non-insulin therapies in type 2 diabetes. Biopharm. Drug Dispos. 2010;31:162–177. doi: 10.1002/bdd.700. [DOI] [PubMed] [Google Scholar]
- Osterman-Golkar S.M., Vesper H.W. Assessment of the relationship between glucose and A1c using kinetic modeling. J. Diabetes Complicat. 2006;20:285–294. doi: 10.1016/j.jdiacomp.2005.07.009. [DOI] [PubMed] [Google Scholar]
- Kilpatrick E.S., Rigby A.S., Atkin S.L. Variability in the relationship between mean plasma glucose and HbA1c: implications for the assessment of glycemic control. Clin. Chem. 2007;53:897–901. doi: 10.1373/clinchem.2006.079756. [DOI] [PubMed] [Google Scholar]
- Hempe J.M., Gomez R., McCarter R.J., Jr, Chalew S.A. High and low hemoglobin glycation phenotypes in type 1 diabetes: a challenge for interpretation of glycemic control. J. Diabetes Complicat. 2002;16:313–320. doi: 10.1016/s1056-8727(01)00227-6. [DOI] [PubMed] [Google Scholar]
- Beach K.W. A theoretical model to predict the behavior of glycosylated hemoglobin levels. J. Theor. Biol. 1979;81:547–561. doi: 10.1016/0022-5193(79)90052-3. [DOI] [PubMed] [Google Scholar]
- Mortensen H.B., Vølund A., Christophersen C. Glucosylation of human haemoglobin A. Dynamic variation in HbA1c described by a biokinetic model. Clin. Chim. Acta. 1984;136:75–81. doi: 10.1016/0009-8981(84)90249-3. [DOI] [PubMed] [Google Scholar]
- Mortensen H.B., Volund A. Application of a biokinetic model for prediction and assessment of glycated haemoglobins in diabetic patients. Scand. J. Clin. Lab. Invest. 1988;48:595–602. doi: 10.3109/00365518809085778. [DOI] [PubMed] [Google Scholar]
- Landersdorfer C.B., Jusko W.J. Pharmacokinetic/pharmacodynamic modelling in diabetes mellitus. Clin. Pharmacokinet. 2008;47:417–448. doi: 10.2165/00003088-200847070-00001. [DOI] [PubMed] [Google Scholar]
- Rosenstock J., Davies M., Home P.D., Larsen J., Koenen C., Schernthaner G. A randomised, 52-week, treat-to-target trial comparing insulin detemir with insulin glargine when administered as add-on to glucose-lowering drugs in insulin-naive people with type 2 diabetes. Diabetologia. 2008;51:408–416. doi: 10.1007/s00125-007-0911-x. [DOI] [PMC free article] [PubMed] [Google Scholar]
- Raskin P., et al. Initiating insulin therapy in type 2 Diabetes: a comparison of biphasic and basal insulin analogs. Diabetes Care. 2005;28:260–265. doi: 10.2337/diacare.28.2.260. [DOI] [PubMed] [Google Scholar]
- Zinman B., et al. LEAD-4 Study Investigators Efficacy and safety of the human glucagon-like peptide-1 analog liraglutide in combination with metformin and thiazolidinedione in patients with type 2 diabetes (LEAD-4 Met+TZD). Diabetes Care. 2009;32:1224–1230. doi: 10.2337/dc08-2124. [DOI] [PMC free article] [PubMed] [Google Scholar]
- Nauck M., et al. LEAD-2 Study Group Efficacy and safety comparison of liraglutide, glimepiride, and placebo, all in combination with metformin, in type 2 diabetes: the LEAD (liraglutide effect and action in diabetes)-2 study. Diabetes Care. 2009;32:84–90. doi: 10.2337/dc08-1355. [DOI] [PMC free article] [PubMed] [Google Scholar]
- Sarwat S., Ilag L.L., Carey M.A., Shrom D.S., Heine R.J. The relationship between self-monitored blood glucose values and glycated haemoglobin in insulin-treated patients with Type 2 diabetes. Diabet. Med. 2010;27:589–592. doi: 10.1111/j.1464-5491.2010.02955.x. [DOI] [PubMed] [Google Scholar]
- Nathan D.M., Kuenen J., Borg R., Zheng H., Schoenfeld D., Heine R.J. A1c-Derived Average Glucose Study Group Translating the A1C assay into estimated average glucose values. Diabetes Care. 2008;31:1473–1478. doi: 10.2337/dc08-0545. [DOI] [PMC free article] [PubMed] [Google Scholar]
- Uehlinger D.E., Gotch F.A., Sheiner L.B. A pharmacodynamic model of erythropoietin therapy for uremic anemia. Clin. Pharmacol. Ther. 1992;51:76–89. doi: 10.1038/clpt.1992.10. [DOI] [PubMed] [Google Scholar]
- Beal S., Sheiner L.B., Boeckmann A., Bauer R.J. Nonmem Useŕs Guides (1989–2009) Icon Development Solutions; Ellicott City, MD; 2009. [Google Scholar]
- Jonsson E.N., Karlsson M.O. Xpose–an S-PLUS based population pharmacokinetic/pharmacodynamic model building aid for NONMEM. Comput. Methods Programs Biomed. 1999;58:51–64. doi: 10.1016/s0169-2607(98)00067-4. [DOI] [PubMed] [Google Scholar]