Magnetic Resonance Imaging (MRI) has been widely used as a diagnostic tool to detect changes in soft tissue due to its exquisite spatial resolution. One of the standard methods to detect pathologies involves injection of magnetic resonance (MR) contrast agent, such as the gadolinium (III) complexes routinely used for angiography.[1] Chemical exchange saturation transfer (CEST) contrast agents are a new alternative, which have become popular due to the unique features of these agents.[2] One of the features of CEST probes is that MR contrast can be produced by a variety of organic diamagnetic compounds possessing exchangeable protons [3] such as glucose,[4] glycogen,[5] myo-inositol,[6] glutamate,[7] creatine,[8] L-arginine,[9] glycosaminoglycans,[10] nucleic acids,[11] and peptides.[12] The CEST contrast mechanism involves selective irradiation of labile protons on the diamagnetic CEST (diaCEST) agent in order to perturb their signal, with this signal change then transferred to water via exchange between these labile protons and bulk water.[5] Because a number of common metabolites possess labile protons, there can be challenges in discriminating the signal loss associated with the CEST agent of interest and background,[2c] especially between 1 to 3.6 ppm from water. Recently, iopamidol, a computed tomography (CT) agents approved for clinical use, was reported to produce strong CEST contrast at 4.2 and 5.5 ppm.[13] Here we present that salicylic acid (1), one of the main metabolites of aspirin possesses a suitable exchangeable proton which resonates 9.3 ppm from water, a frequency far removed from all other organic diaCEST agents reported to date. In addition, the intramolecular hydrogen bonding found in salicylic acid analogs [14,15] results in strong CEST contrast properties. Seven salicylic acid analogs (4 – 10) produce similar contrast to 1, with labile protons up to 10.8 ppm from water. We were able to measure the proton exchange rate for 1, determine optimum saturation conditions, and detect this agent in the kidneys of mice after intravenous (IV) administration.
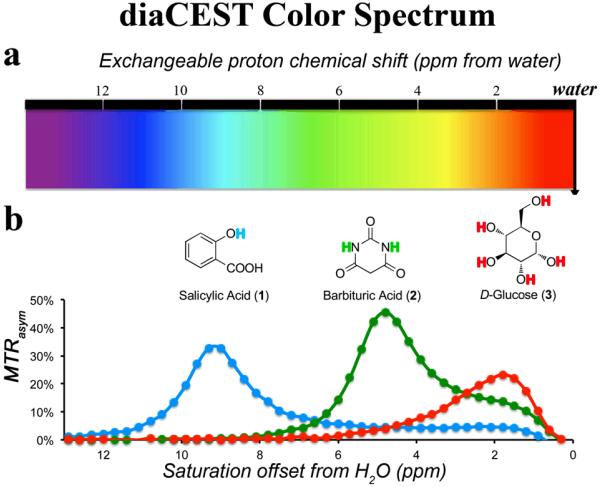
Balaban and co-workers have tabulated a number of organic compounds which display CEST contrast from 1 to 6 ppm including Barbituric Acid (2) and D-Glucose (3).[3] As shown in Figure 1, the MTRasym spectra of 1, 2 and 3 were compared at the same scale. The phenol proton in 1 displays contrast at a much larger chemical shift using a saturation field strength (ω1 ) = 7.2 μT. The maximum CEST contrast occurred at 9.3 ppm from water. Presumably, at neutral pH, the deprotonated carboxylic anion forms a strong hydrogen bond to the phenol proton and results in this dramatic shift [15]. The signal of 1 dropped greatly at either lower pH (<6) when a significant amount of the carboxylate becomes protonated, or at higher pH (>11) when the phenol proton becomes deprotonated. (see supporting information for details).
Figure 1.
Schematic depicting the color spectrum for diaCEST agents. a) range of exchangeable proton shifts observed presently for diaCEST agents; b) CEST contrast curves for three representative agents: Salicylic Acid (1), Barbituric Acid (2), and D-Glucose (3) at concentrations of 25 mM, pH 7.0,, 37°C using ω1 = 7.2 μT, tsat = 3 s for saturation.
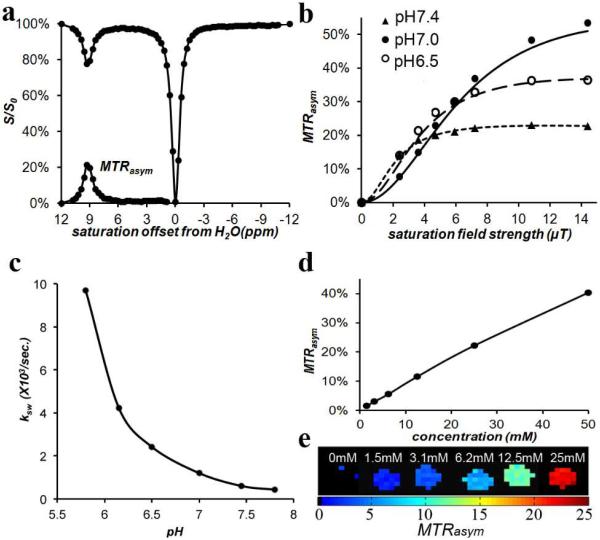
We next measured the CEST properties of compound 1 in vitro. Figure 2a displays a Z-spectrum and MTRasym spectrum for the compound. The proton exchange rate (ksw ) with water for 1 was measured as a function of pH using the QUESP experiment, [16] with the data shown in Figure 2b,c. Compound 1 has a ksw = 1.2 ks−1 at 25 mM, pH 7.0, and as seen in Figure 2b, the ksw is strongly dependent on the pH. Above pH 6.0, ksw is below the chemical shift difference at 11.7 T (Δω = 4,650 Hz) placing the rates in the slow exchange NMR regime and making this agent well suited for CEST imaging. As can also be seen, for pH 7.0, maximum contrast was produced by ω1 = 10.8 μT, although in practice using 7.2 μT or higher would produce similar results. The use of these saturation conditions resulted in CEST contrast = 4% at 1.5 mM concentration. (Figure 2d-e) This is a respectable sensitivity, especially considering in vivo tissue background. (see supporting information).
Figure 2.
CEST properties of 1 at 37°C. a) Z-spectrum and MTRasym for 25 mM at pH 7.0 using ω1 = 3.6 μT. ; b) QUESP data for 25 mM, at pH values 6.5, 7.0, 7.4; c) pH dependence of ksw based on QUESP data; d) CEST contrast at 9.3 ppm as a function of concentration, using ω1 = 7.2 μT, pH 7.0; e) CEST contrast map on phantom with assorted concentrations using ω1 = 7.2 μT, pH 7.0.
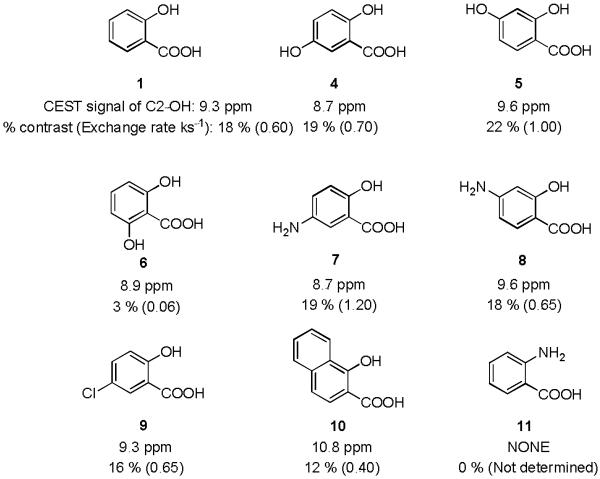
Based on these results, eight analogs of 1 were also tested to determine how electronic effects related to the phenol ring would modify this contrast. The results were shown in Figure 3. Placing an OH or NH2 group (4 or 7) at the para position to the phenol C2-OH reduced the chemical shift to 8.7 ppm, which could be slightly increased to 9.6 ppm by attaching an OH or NH2 group (5 or 8) at C4 position of the salicylic acid. In the case of 2,6-dihydroxybenzoic acid (6), instead of an increase, the contrast dropped dramatically due to a drop in ksw to 60 s−1 although the chemical shift remained similar. A more interesting result was obtained on 1-hydroxy-2-naphthoic acid (10). The naphthalene ring with more electron delocalization helped to shift the CEST peak signal further to 10.8 ppm. Anthranilic acid (11), the substitution of an NH2 for the OH adjacent to the carboxylic acid, did not show any contrast.
Figure 3.
CEST signals of salicylic acid and its analogs; Experimental conditions: CEST agent concentration = 25 mM, pH 7.1 - 7.4, using tsat = 3 sec, ω1 = 3.6 μT. (See supporting information for the Z-spectra.)
As seen in Figures 1 - 3, these analogs possess exchangeable protons which resonate at the furthest downfield from water of all organic CEST agents, further than the 6 ppm protons of thymidine analogs we reported recently.[11] While these protons are not nearly as shifted as the 45 to 52 ppm found for bound water in paramagnetic Eu3+ complexes[17] or the −600 ppm found in paramagnetic Tb3+ complexes,[18] the exchange rates are slow enough relative to the chemical shift difference with water to not produce significant exchange based T2 relaxation, which can darken pixels containing CEST agents.[19] The saturation field strengths shown in Figure 2b can be generated in many imaging coils, making these analogs suitable diaCEST agents. The shifts are approaching, but not quite as large, as those seen for the carbamate protons that generate CEST contrast on Yb3+ agents (~ −16 ppm),[20] osmotic stressed lipoCEST agents based on Tm3+ complexes (~ 18 ppm) or Dy3+ complexes (~ 45 ppm),[21] and larger than the spherical lipoCEST preparations.[22] In addition, as is shown in Figure 3 the salicylic acid scaffold can tolerate chemical modification. This can allow the conjugation of this type of probe to polymers,[23] nanoparticles,[24] or hydrogels [9a] which are suitable for a variety of drug or cell based therapies.
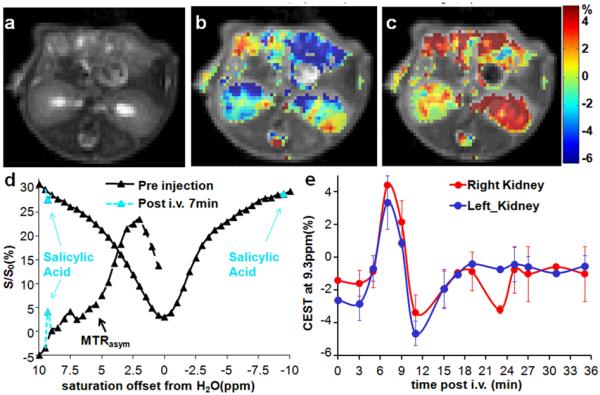
To evaluate whether 1 could be detected after administration into live animals, we injected two mice with 60 μL of a 0.25 M solution of compound 1 and collected CEST images. Images consisting of a single axial slice containing both kidneys were collected. Because the B0 inhomogeneity was less than 200 Hz for these animals, we decided to use a two-point collection scheme to limit the scan time, and a 7.2 μT saturation field strength to reduce the sensitivity to B0 inhomogeneity. We observed a pronounced increase in the CEST contrast at 9.3 ppm which peaked in the kidneys 7 minutes after injection (Figures 4b-c), indicative of probe uptake. The average CEST contrast was 6.0 ± 0.8 % over the whole kidney (Figures 4b-c,e), with the contrast persisting for 8 minutes as displayed in Figure 4e. The advantage of the large shift is evident from Figure 4d, where the peak of 1 is far removed from the large MTRasym seen in the right kidney between 1 - 4.5 ppm, which is the chemical shift of many exchangeable protons seen on common metabolites such as glucose, creatine, L-glutamine, L-glutamate, glutathione and others. In addition, the intensity of the total water signal is 25% larger at 9.3 ppm compared to at 5 ppm due to less direct saturation.
Figure 4.
In vivo contrast for 1. a) T2w image; b) overlay MTRasym (9.3 ppm) map pre-injection; c) overlay MTRasym (9.3 ppm) map at 7 min post-injection; d) Z-spectra and MTRasym for a region of interest (ROI) enclosing the entire right kidney with pre-injection data (black), 7 min post-injection; (light blue) e) dynamic time course of the MTRasym (9.3 ppm) for ROIs enclosing the whole left kidney and right kidney. ω1 = 7.2 μT (n = 2).
The magnitude of the contrast detected is similar to that shown previously by Longo and co-workers[13a] for iopamidol, with a difference in the optimal time to observe the contrast (7 min for 15 μM 1 vs 45 min for 48.5 μM iopamidol). In addition, simple continuous wave irradiation was chosen to detect 1 because of the robustness of this method, however more advanced saturation schemes such as SAFARI,[25] OPARACHEE,[26] FLEX [27], CERT, [28] two-frequency irradiation [29] or LOVARS [30] may improve the detection of this contrast and will be evaluated in future studies.
One of the attractive features of 1 and its analogs is the wealth of literature on the pharmacokinetics, formulation, and toxicity. Compound 1, a well-known nonsteroidal anti-inflammatory drug (NSAID), is a component of human diets [31] and is found at elevated levels in the serum of vegetarians.[32] Salts and esters of salicylic acid have been administered to patients so that low millimolar concentrations are achieved in plasma for the treatment of rheumatoid arthritis.[33] Aspirin is a prodrug of salicylic acid and has beneficial effects in a variety of conditions including inflammation and cancer. [34] We expect these probes to be translatable on the basis of the widespread testing that has been performed on these and similar compounds in patients over many decades.
In conclusion, we demonstrated that salicylic acid (1) and its analogs (4-10) represent a promising new set of diaCEST probes. As a quick in vivo evaluation, 1 was injected into mice and 6% contrast was obtained in kidneys. This type of low-toxicity probe, especially 1, could improve the sensitivity of existing CEST methods. More MRI studies on the pharmacokinetics and tumor uptake of formulated salicylic acid and its analogs are now under investigation in our labs.
Experimental Section
Phantom Preparation and data acquisition
All compounds were purchased from Sigma Aldrich (St. Louis, MO). Samples were dissolved in 0.01 M phosphate-buffered saline (PBS) at concentrations from 1.5 mM to 100 mM, and titrated using high concentration HCl/NaOH to various pH values ranging from 6 to 8. The solutions were placed into 1 mm glass capillaries and assembled in a holder for CEST MR imaging. The samples were kept at 37°C during imaging. Phantom CEST experiments were taken on a Bruker 11.7 T vertical bore MR scanner, using a 20 mm birdcage transmit/receive coil. CEST images were acquired using a RARE (RARE = 8) sequence with CW saturation pulse length of 3 sec and saturation field strength (B1 ) from 1.2 μT to 14.4 μT. The CEST Z-spectra were acquired by incrementing saturation frequency every 0.3 ppm from −15 to 15 ppm for phantoms; TR = 6 s, effective TE = 17 ms, matrix size = 64*48 and slice thickness = 1.2 mm.
Animal preparation and data acquisition
In vivo images were acquired on a Bruker Biospec 11.7 T horizontal bore MR scanner, with one axial slice of 1.5 mm thickness obtained through the medulla of both kidneys. CEST images with saturation frequencies of ± 9.3 ppm were acquired repeatedly every 100 sec. both pre- and post-injection. Image parameters were similar to those for the phantom except for TR/TE = 5s/15 ms, with optimized B1 = 7.2 μT. For MRI the BALB/c mice (n = 2) weighing 20-25 g (Charles River Laboratories, Wilmington, MA) were anesthetized by using 0.5–2% isoflurane and placed in a 23 mm transmit/receive mouse coil. Breath rate was monitored throughout in vivo MRI experiments using a respiratory probe. A 60 μL volume of a 0.25 M solution of 1 in PBS (pH = 7) was slowly injected via a catheter into the tail vein. CEST contrast was quantified by MTRasym = (S−Δω–S+Δω)/S0 for phantom and MTRasym = (S−Δω–S+Δω)/S−Δω in vivo in order to normalize the conventional magnetization transfer of tissue, where S−Δω and S+Δω refer to the water signal intensity with a saturation pulse applied at the frequencies −Δω and +Δω respectively. (See supporting information for the details on the data processing.)
Supplementary Material
Footnotes
Financial support from the National Insitutes of Health (R01EB015031 and U54CA134675).
Supporting information for this article is available on the WWW under http://www.angewandte.org or from the author.
Contributor Information
Xing Yang, The Russell H. Morgan Department of Radiology, The Johns Hopkins University School of Medicine, 991 N. Broadway Baltimore, Maryland 21287 (USA).
Xiaolei Song, The Russell H. Morgan Department of Radiology, The Johns Hopkins University School of Medicine, 991 N. Broadway Baltimore, Maryland 21287 (USA).
Yuguo Li, The Russell H. Morgan Department of Radiology, The Johns Hopkins University School of Medicine, 991 N. Broadway Baltimore, Maryland 21287 (USA).
Prof. Guanshu Liu, The Russell H. Morgan Department of Radiology, The Johns Hopkins University School of Medicine, 991 N. Broadway Baltimore, Maryland 21287 (USA); F.M. Kirby Research Center for Functional Brain Imaging, Kennedy Krieger Institute, 707 N. Broadway Ave., Baltimore, Maryland 21287 (USA)
Prof. Sangeeta Ray Banerjee, The Russell H. Morgan Department of Radiology, The Johns Hopkins University School of Medicine, 991 N. Broadway Baltimore, Maryland 21287 (USA)
Prof. Martin G. Pomper, The Russell H. Morgan Department of Radiology, The Johns Hopkins University School of Medicine, 991 N. Broadway Baltimore, Maryland 21287 (USA).
Prof. Michael T. McMahon, The Russell H. Morgan Department of Radiology, The Johns Hopkins University School of Medicine, 991 N. Broadway Baltimore, Maryland 21287 (USA); F.M. Kirby Research Center for Functional Brain Imaging, Kennedy Krieger Institute, 707 N. Broadway Ave., Baltimore, Maryland 21287 (USA).
References
- [1].a) Caravan P. Chem, Soc. Rev. 2006;35:512–523. doi: 10.1039/b510982p. [DOI] [PubMed] [Google Scholar]; b) Kubicek V, Toth E. In: Advances in Inorganic Chemistry. VanEldik R, Hubbard CD, editors. Vol. 61. Elsevier Academic Press Inc; San Diego: 2009. pp. 63–129. [Google Scholar]
- [2].a) Hancu I, Dixon WT, Woods M, Vinogradov E, Sherry AD, Lenkinski RE. Acta Radiol. 2010;51:910–923. doi: 10.3109/02841851.2010.502126. [DOI] [PMC free article] [PubMed] [Google Scholar]; b) Terreno E, Castelli DD, Aime S. Contrast Media Mol. Imaging. 2010;5:78–98. doi: 10.1002/cmmi.369. [DOI] [PubMed] [Google Scholar]; c) Liu G, Song X, Chan KWY, McMahon MT. NMR Biomed. 2013 doi: 10.1002/nbm.2899. doi:10.1002/nbm.2899. [DOI] [PMC free article] [PubMed] [Google Scholar]; d) van Zijl PCM, Yadav NN. Magn. Reson. Med. 2011;65:927–948. doi: 10.1002/mrm.22761. [DOI] [PMC free article] [PubMed] [Google Scholar]
- [3].Ward KM, Aletras AH, Balaban RS. J. Magn. Reson. 2000;143:79–87. doi: 10.1006/jmre.1999.1956. [DOI] [PubMed] [Google Scholar]
- [4].a) Chan KWY, McMahon MT, Kato Y, Liu GS, Bulte JWM, Bhujwalla ZM, Artemov D, van Zijl PCM. Magn. Reson.Med. 2012;68:1764–1773. doi: 10.1002/mrm.24520. [DOI] [PMC free article] [PubMed] [Google Scholar]; b) Jin T, Autio J, Obata T, Kim SG. Magn. Reson.Med. 2011;65:1448–1460. doi: 10.1002/mrm.22721. [DOI] [PMC free article] [PubMed] [Google Scholar]; c) Torrealdea F, Walker-Samuel S, Ramasawmy R, Rega M, Johnson SP, Rajkumar V, Richardson S, Goncalves M, Thomas DL, Pedley RB, Arstad E, Parkes H, Lythgoe MF, Golay X. Contrast Media Mol. Imaging. 2013 doi: 10.1002/cmmi.1522. [Google Scholar]
- [5].van Zijl PCM, Jones CK, Ren J, Malloy CR, Sherry AD. Proc. Natl. Acad. Sci. USA. 2007;104:4359–4364. doi: 10.1073/pnas.0700281104. [DOI] [PMC free article] [PubMed] [Google Scholar]
- [6].Haris M, Singh A, Cai K, Nath K, Crescenzi R, Kogan F, Hariharan H, Reddy R. J. Neurosci. Meth. 2013;212:87–93. doi: 10.1016/j.jneumeth.2012.09.025. [DOI] [PMC free article] [PubMed] [Google Scholar]
- [7].Cai KJ, Haris M, Singh A, Kogan F, Greenberg JH, Hariharan H, Detre JA, Reddy R. Nat. Med. 2012;18:302–306. doi: 10.1038/nm.2615. [DOI] [PMC free article] [PubMed] [Google Scholar]
- [8].a) Haris M, Nanga RPR, Singh A, Cai K, Kogan F, Hariharan H, Reddy R. NMR Biomed. 2012;25:1305–1309. doi: 10.1002/nbm.2792. [DOI] [PMC free article] [PubMed] [Google Scholar]; b) Kogan F, Haris M, Singh A, Cai K, Debrosse C, Nanga RPR, Hariharan H, Reddy R. Magn. Reson. Med. 2013 doi: 10.1002/mrm.24641. doi: 10.1002/mrm.24641. [DOI] [PMC free article] [PubMed] [Google Scholar]
- [9].a) Chan KWY, Liu G, Song X, Kim H, Yu T, Arifin DR, Gilad AA, Hanes J, Walczak P, van Zijl PCM. Nat Mater. 2013;12:268–275. doi: 10.1038/nmat3525. [DOI] [PMC free article] [PubMed] [Google Scholar]; b) Liu GS, Moake M, Har-el YE, Long CM, Chan KWY, Cardona A, Jamil M, Walczak P, Gilad AA, Sgouros G, van Zijl PCM, Bulte JWM, McMahon MT. Magn. Reson. Med. 2012;67:1106–1113. doi: 10.1002/mrm.23100. [DOI] [PMC free article] [PubMed] [Google Scholar]
- [10].Ling W, Regatte RR, Navon G, Jerschow A. Proc Natl Acad Sci USA. 2008;105:2266–2270. doi: 10.1073/pnas.0707666105. [DOI] [PMC free article] [PubMed] [Google Scholar]
- [11].Bar-Shir A, Liu GS, Liang YJ, Yadav NN, McMahon MT, Walczak P, Nimmagadda S, Pomper MG, Tallman KA, Greenberg MM, van Zijl PCM, Bulte JWM, Gilad AA. J. Am. Chem. Soc. 2013;135:1617–1624. doi: 10.1021/ja312353e. [DOI] [PMC free article] [PubMed] [Google Scholar]
- [12].a) McMahon MT, Gilad AA, DeLiso MA, Berman SDC, Bulte JWM, van Zijl PCM. Magn. Reson. Med. 2008;60:803–812. doi: 10.1002/mrm.21683. [DOI] [PMC free article] [PubMed] [Google Scholar]; b) Airan RD, Bar-Shir A, Liu GS, Pelled G, McMahon MT, van Zijl PCM, Bulte JWM, Gilad AA. Magn. Reson. Med. 2012;68:1919–1923. doi: 10.1002/mrm.24483. [DOI] [PMC free article] [PubMed] [Google Scholar]; c) Salhotra A, Lal B, Laterra J, Sun PZ, van Zijl PCM, Zhou JY. NMR Biomed. 2008;21:489–497. doi: 10.1002/nbm.1216. [DOI] [PMC free article] [PubMed] [Google Scholar]; d) Liu GS, Chan KWY, Song XL, Zhang JY, Gilad AA, Bulte JWM, van Zijl PCM, McMahon MT. Magn. Reson. Med. 2013;69:516–523. doi: 10.1002/mrm.24271. [DOI] [PMC free article] [PubMed] [Google Scholar]
- [13].a) Longo DL, Dastru W, Digilio G, Keupp J, Langereis S, Lanzardo S, Prestigio S, Steinbach O, Terreno E, Uggeri F, Aime S. Magn. Reson. Med. 2011;65:202–211. doi: 10.1002/mrm.22608. [DOI] [PubMed] [Google Scholar]; b) Aime S, Calabi L, Biondi L, De Miranda M, Ghelli S, Paleari L, Rebaudengo C, Terreno E. Magn. Reson. Med. 2005;53:830–834. doi: 10.1002/mrm.20441. [DOI] [PubMed] [Google Scholar]
- [14].Maciel GE, Savitsky GB. J. Phys. Chem. 1964;68:437–438. [Google Scholar]
- [15].Mock WL, Morsch LA. Tetrahedron. 2001;57:2957–2964. [Google Scholar]
- [16].McMahon MT, Gilad AA, Zhou J, Sun PZ, Bulte JWM, van Zijl PCM. Magn. Reson. Med. 2006;55:836–847. doi: 10.1002/mrm.20818. [DOI] [PMC free article] [PubMed] [Google Scholar]
- [17].Mani T, Tircso G, Togao O, Zhao P, Soesbe TC, Takahashi M, Sherry AD. Contrast Media Mol. Imaging. 2009;4:183–191. doi: 10.1002/cmmi.279. [DOI] [PMC free article] [PubMed] [Google Scholar]
- [18].Aime S, Carrera C, Castelli DD, Crich SG, Terreno E. Angew. Chem. Int. Ed. 2005;44:1813–1815. doi: 10.1002/anie.200462566. [DOI] [PubMed] [Google Scholar]
- [19].Soesbe TC, Wu Y, Sherry AD. NMR in Biomedicine. 2012 doi:10.1002/nbm.2874. [Google Scholar]
- [20].Chauvin T, Durand P, Bernier M, Meudal H, Doan B-T, Noury F, Badet B, Beloeil J-C, Tóth É. Angew. Chem. Int. Ed. 2008;47:4370–4372. doi: 10.1002/anie.200800809. [DOI] [PubMed] [Google Scholar]
- [21].Terreno E, Cabella C, Carrera C, Castelli DD, Mazzon R, Rollet S, Stancanello J, Visigalli M, Aime S. Angew. Chem. Int. Ed. 2007;46:966–968. doi: 10.1002/anie.200604027. [DOI] [PubMed] [Google Scholar]
- [22].Aime S, Castelli DD, Terreno E. Angew. Chem. Int. Ed. 2005;44:5513–5515. doi: 10.1002/anie.200501473. [DOI] [PubMed] [Google Scholar]
- [23].Ali MM, Bhuiyan MPI, Janic B, Varma NRS, Mikkelsen T, Ewing JR, Knight RA, Pagel MD, Arbab AS. Nanomedicine. 2012;7:1827–1837. doi: 10.2217/nnm.12.92. [DOI] [PMC free article] [PubMed] [Google Scholar]
- [24].Winter PM, Cai K, Chen J, Adair CR, Kiefer GE, Athey PS, Gaffney PJ, Buff CE, Robertson JD, Caruthers SD, Wickline SA, Lanza GM. Magn. Reson. Med. 2006;56:1384–1388. doi: 10.1002/mrm.21093. [DOI] [PMC free article] [PubMed] [Google Scholar]
- [25].Scheidegger R, Vinogradov E, Alsop DC. Magn. Reson. Med. 2011;66:1275–1285. doi: 10.1002/mrm.22912. [DOI] [PMC free article] [PubMed] [Google Scholar]
- [26].Vinogradov E, He H, Lubag A, Balschi JA, Sherry AD, Lenkinski RE. Magn. Reson. Med. 2007;58:650–655. doi: 10.1002/mrm.21393. [DOI] [PubMed] [Google Scholar]
- [27].Friedman JI, McMahon MT, Stivers JT, van Zijl PCM. J. Am. Chem. Soc. 2010;132:1813–1815. doi: 10.1021/ja909001q. [DOI] [PMC free article] [PubMed] [Google Scholar]
- [28].Zu Z, Janve VA, Xu J, Does MD, Gore JC, Gochberg DF. Magn. Reson. Med. 2013;69:637–647. doi: 10.1002/mrm.24284. [DOI] [PMC free article] [PubMed] [Google Scholar]
- [29].Lee J-S, Khitrin AK, Regatte RR. J. Chem. Phy. 2011;134:234504–234506. doi: 10.1063/1.3600758. [DOI] [PMC free article] [PubMed] [Google Scholar]
- [30].Song X, Gilad AA, Joel S, Liu G, Bar-Shir A, Liang Y, Gorelik M, Pekar JJ, van Zijl PC, Bulte JW, McMahon MT. Mag. Res. Med. 2012;68:1074–1086. doi: 10.1002/mrm.23312. [DOI] [PMC free article] [PubMed] [Google Scholar]
- [31].Paterson JR, Baxter G, Dreyer JS, Halket JM, Flynn R, Lawrence JR. J. Agr. Food Chem. 2008;56:11648–11652. doi: 10.1021/jf800974z. [DOI] [PMC free article] [PubMed] [Google Scholar]
- [32].Blacklock CJ, Lawrence JR, Wiles D, Malcolm EA, Gibson IH, Kelly CJ, Paterson JR. J. Clin. Pathol. 2001;54:553–555. doi: 10.1136/jcp.54.7.553. [DOI] [PMC free article] [PubMed] [Google Scholar]
- [33].McCarty MF, Block KI. Integr. Cancer Ther. 2006;5:252–268. doi: 10.1177/1534735406291499. [DOI] [PubMed] [Google Scholar]
- [34].Walter S. Br. Med. J. 2000:321. [Google Scholar]
Associated Data
This section collects any data citations, data availability statements, or supplementary materials included in this article.


