Abstract
Current methods of structure identification in mass spectrometry based non-targeted metabolomics rely on matching experimentally determined features of an unknown compound to those of candidate compounds contained in biochemical databases. A major limitation of this approach is the relatively small number of compounds currently included in these databases. If the correct structure is not present in a database it cannot be identified, and if it cannot be identified it cannot be included in a database. Thus, there is an urgent need to augment metabolomics databases with rationally designed biochemical structures using alternative means. In this study, we present a database of in silico enzymatically synthesized metabolites (IIMDB) to partially address this problem. The database, which is available from http://metabolomics.pharm.uconn.edu/iimdb/, includes ~23,000 known compounds (mammalian metabolites, drugs, secondary plant metabolites and glycerophospholipids) collected from existing biochemical databases plus more than 400,000 computationally generated human phase I and phase II metabolites of these known compounds. The IIMDB database features a user-friendly web interface and a programmer-friendly RESTful web service. Ninety-five percent of the computationally generated metabolites in IIMDB were not found in any existing database. However, 21,640 were identical to compounds already listed in PubChem, HMDB, KEGG or HumanCyc. Furthermore, a vast majority of these in silico metabolites were scored as biological using BioSM, a software program that identifies biochemical structures in chemical structure space. These results suggest that in silico biochemical synthesis represents a viable approach for significantly augmenting biochemical databases for non-targeted metabolomics applications.
Keywords: metabolomics, mass spectrometry, in silico structure generation, biochemical databases
Introduction
Most non-targeted metabolomic studies use biochemical databases for structure determination1–5. These studies typically report the identification of fewer than 10% of the total number of compounds detected2–4. This consistently low percentage suggests that current biochemical databases do not contain most endogenous compounds routinely detected in biological samples. Although it is not known how many compounds exist in the human metabolome, one study has suggested that there are over 200,000 lipids alone6. This number, however, is likely an underestimate considering that there are over 8×10⁶ microbial genes comprising the human microbiome7. Thus, with fewer than 70,000 compounds in current biochemical databases, there is an obvious paradox that severely limits the utility of non-targeted metabolomics research; if a structure is not included in a database it cannot be identified, and if it cannot be identified it cannot be included in a database. Discovering, purifying and identifying new biochemical compounds using classical analytical methods is a time consuming, expensive and laborious process, especially using human samples. An alternative approach is to supplement current databases with anticipated compounds (compounds likely to be found in humans, but not yet identified). These anticipated compounds may include compounds consumed by humans, compounds to which humans are frequently exposed, and compounds that may be produced by biochemical pathways (human and microbial) in the human body. Many metabolomics databases have recognized the importance of including expected metabolites. Examples include computationally generated di- and tri-peptide structures in the Metlin database8,9, computationally generated lipid structures in Lipid Maps10,11 and expected compounds (e.g., foods, food additives, environmental pollutants etc.) in HMDB12,13. Inclusion of anticipated metabolites is especially important for mass spectrometry based metabolomics where structure identification relies on all putative compounds being present in the database.
One approach to produce anticipated metabolites (unknown unknowns) would be to use in silico enzymatic synthesis. For this approach to be successful, the selected in silico enzymes would ideally have broad substrate specificity; as these would potentially catalyze the metabolism of a variety of substrates (known and unknown) to produce novel products. Indeed, it has been suggested that broad enzyme specificity and/or side reactions might explain our incomplete knowledge of the human metabolome14. It is well known that phase I and phase II enzymes are non-selective and are found in nearly all cells and tissues; having evolved from promiscuous ancestral enzymes15–17. Since these enzymes typically metabolize multiple drugs to give a variety of metabolites, we reasoned they might also metabolize multiple endogenous compounds to produce a variety of previously unknown products. Indeed, other investigators have identified multiple phase I and phase II metabolites of endogenous biochemicals in mammalian serum18.
Previous studies using in silico enzymatically synthesized databases include the University of Minnesota Biocatalysis/Biodegradation database19 (UM-BBD), the enzyme-catalyzed metabolic pathway predictor: PathPred20 and the evidence-based metabolome library: MyCompoundID21. The UM-BBD system uses a collection of microbial biodegradation pathways to predict one or more reaction steps. The PathPred server uses KEGG biochemical structure transformation patterns called RDM patterns22. This system focuses on predicting pathways for microbial biodegradation (based on 947 RDM patterns) and plant secondary metabolite biosynthesis (based on 1397 RDM patterns). The MyCompoundID database uses 76 literature-derived common metabolic transformations in the form of accurate mass transformations to identify unknown metabolites. This database includes 8021 known human endogenous compounds and their predicted metabolic products using one (375809 metabolites) or two (10583901 metabolites) reaction steps.
Here we present an easily searchable database (IIMDB) comprised of a non-redundant set of known biochemical “parents” collected from existing databases and their in silico phase I and phase II metabolites. The known parent compounds were obtained from HMDB12,13, KEGG23, HumanCyc24, PlantCyc25, Phenol Explorer26, Lipid Maps10,11, Drug Bank27 and the 1989 USAN and the USP dictionary of drug names28. In silico metabolites were generated using phase I and phase II human biotransformation rules as implemented in the program Meteor 1429,30. Interestingly, greater than 21,000 of these in silico generated metabolites are already included in current databases suggesting that this general approach is reasonable. The database features a user-friendly web interface and a programmer friendly RESTful web service.
Methods
Parent Datasets
Mammalian Compounds
A dataset of mammalian compounds was compiled by combining selected chemical structures in KEGG, HMDB and HumanCyc. Compounds that contained any element other than C, H, N, O, P and S were eliminated. The dataset was further limited to the 50–1000 Da molecular weight range. KEGG data was downloaded on 23rd of April 2011. Compounds that belong to at least one of the 63 known KEGG mammalian pathways were selected31. HMDB data (Version 2.5) was downloaded on 15th of July 2012. HumanCyc data (Version 16.0) was downloaded on 24th of May 2012. Duplicate compounds were eliminated by comparing unique SMILES of the chemical structures. The final mammalian dataset contained 1,579 KEGG compounds, 5,267 HMDB compounds and 262 HumanCyc compounds.
Plant Metabolites
A dataset of plant metabolites was compiled by combining plant metabolites from the KEGG database with polyphenols found in the Phenol Explorer database (downloaded on 22nd of October 2012). The plant dataset was curated similarly to that of the mammalian dataset. Any compound already contained in the mammalian dataset was eliminated. The final dataset contained 2,765 KEGG compounds and 190 polyphenols.
Drugs
A dataset of drugs was compiled by combining approved, illicit and withdrawn drugs in Drug Bank 3.0 (downloaded on 18th January 2012) and drugs listed in the 1989 USAN and the USP dictionary of drug names. Polymers, mixtures, single element drugs (e.g. Fe) and compounds already contained in the mammalian and plant datasets were eliminated. The final dataset contained 1,412 compounds from Drug Bank and 4,646 compounds from the 1989 USAN and the USP dictionary of drug names.
Glycerophospholipids
Glycerophospholipid compounds were downloaded from the Lipid Maps database on 23rd of April 2012. The dataset was curated similarly to that of the mammalian and plant datasets. Compounds already contained in other datasets were eliminated. The final dataset contained 6,914 glycerophospholipids.
Structure Generation
In silico metabolites of parent compounds were generated with Meteor 14 (knowledge base version 14.0.0_09_02_2012) from Lhasa Ltd. Meteor is a knowledge-based expert system for predicting likely metabolites of a query chemical structure29,30,32. The Meteor system consists of a knowledge base of phase I and phase II biotransformation rules and a reasoning engine to determine the most likely metabolites. The list of phase I and phase II biotransformation types included in Meteor is given in supplemental Table 1. The Meteor reasoning engine uses two types of rules: absolute and relative to determine the more likely metabolites out of many possibilities32–34. Absolute reasoning rules include 5 levels of uncertainty from most likely to least likely as “probable” “plausible,” “equivocal,” “doubted,” and “improbable.” Relative reasoning rules are used to determine the more likely reaction out of two competing biotransformations. The Meteor processing constraints listed in Table 1 were chosen to strike a balance between likelihood of occurrence and combinatorial explosion29,35,36 of results.
Table 1.
Meteor Processing Constraints Used in the Structure Generation
| Processing Constraint | Value |
|---|---|
| Absolute reasoning level | Plausible |
| Relative reasoning level | Top levels (2) |
| Maximum number of steps in a pathway | 4 |
| Species | Human |
| Phase option | Do not grow from phase II products |
| Maximum total number of metabolites | 100 |
Database Implementation and Access
OrientDB (Version 1.3.0)37 from Orient Technologies was used for the construction of the database. OrientDB is an open source Java based database management system (DBMS) with both the features of document and graph DBMSs. All chemical structures and associated data fields are stored in a single cluster (similar to a table in a relational database) named “UniqueCompound”. The database is hosted on a Linux-based server running OpenSuse 12.1. The database server is equipped with a 3.4 GHz Intel core i7 processor and 12 GB of RAM. The IIMDB database is available at http://metabolomics.pharm.uconn.edu/iimdb/. Access to IIMDB is provided via a password protected web interface (Figure 1) and a web service. The Meteor generated structures in the database are not freely available due to the licensing restrictions (clause 6.1) in the Meteor licensing agreement. The end user is required to have a valid licensed copy (purchasable from http://www.lhasalimited.org) of Meteor to access IIMDB. However, all parent compounds that were used for this work are freely available as a supplementary data file in xlsx format. The web interface is built using HTML5, JavaScript and JQuery. This web interface will operate on most HTML5 compatible web browsers such as Mozilla Firefox (recommended), Google Chrome and Internet Explorer 9 or later. JavaScript must be enabled in the user’s web browser.
Figure 1.
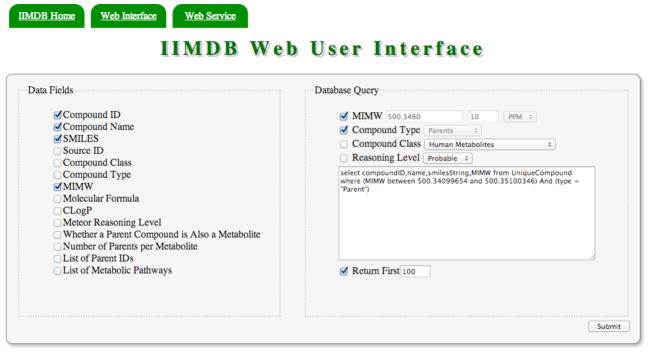
IIMDB Web User Interface
Access to all data fields and most commonly used queries is provided through the web user interface. The actual database querying is done using OrientDB’s own SQL like query language. The end user’s interaction with the checkboxes and drop down menus on the interface is converted into an SQL expression and shown in the large text area to the right. This web interface can also be used as a tool to learn the underlying query language. The predefined queries generated with the web interface can be modified or extended by manually editing the text area. The query results are shown on a paginated data table. The data table includes options to sort, full text search and export data to CSV and PDF file formats. A step-by-step guide to viewing and converting structures is included in the supplementary information. The programmatic access to IIMDB is provided via a RESTful web service. IIMDB allows read only access to database records via OrientDB’s built in web service. The query URI has the following general format: http://metabolomics.pharm.uconn.edu/iimdb/query/iimdb/sql/ “SQL COMMAND” For example, the command line input for listing compound IDs, mono isotopic molecular weights and SMILES of compounds that have mono isotopic molecular weights between 500.2450 and 500.4580 is: http://metabolomics.pharm.uconn.edu/iimdb/query/iimdb/sql/selectcompoundID,MIMW,smilesString from UniqueCompound where MIMW between 500.2450 and 500.4580
ALogP Calculations
Three random samples of parent compounds (each containing 100 compounds) per dataset were drawn from the mammalian, plant, drug and glycerophospholipid datasets using the Knuth shuffle algorithm38. Duplicate structures in datasets were removed after combining random samples. The combined random samples comprised 298 mammalian parent compounds, 294 parent drugs, 288 parent plant compounds, and 295 parent glycerophospholipid compounds. AlogP values of parent compounds and their associated in silico metabolites in random samples were calculated using web based ALOGPS 2.1 algorithm39.
PubChem Search
All in silico generated chemical structures were searched on the National Center for Biotechnology Information’s (NCBI) PubChem40 database (the largest freely accessible compound database). The PubChem database searches were done between 10/01/2012 – 10/31/2012. The structure search was done with an in house program that was built around PubChem’s power user gateway (PUG). Any PubChem compound that had the same connectivity as the query compound or a tautomer of the query compound was considered a match.
BioSM Predictions
Biological Structure Matcher (BioSM) is a computational tool that uses graph matching and known mammalian metabolite structures to identify the biological likeness of a given structure31. Previous studies have shown that BioSM identifies endogenous metabolites with high accuracy. The BioSM algorithm was used to identify biological molecules in parent and in silico-generated structures. Since BioSM was trained to predict the biological likeness of chemical structures with molecular weights 50–700, only this range was considered.
Results and Discussion
Table 2 lists the number of Meteor generated metabolites for each of the 4 different classes of parent compounds. The fourth column in Table 2 lists the fold increase in the number of database compounds for each class of metabolite (i.e. number of in silico compounds/number of parent compounds). Plant compounds produced the largest number of unique metabolites per parent compound, whereas mammalian compounds produced the fewest. On average 18 metabolite structures were generated for each parent compound using the Meteor processing constraints given in Table 1.
Table 2.
Number of in silico Metabolites for Different Classes of Parent Compounds
| Compound Class | No. of Parent Compounds | No. of in silico Metabolites | Fold Increase in Database Size | Probable | Plausible |
|---|---|---|---|---|---|
| Drugs | 6,058 | 115,473 | 19 | 29% | 71% |
| Plant Compounds | 2,955 | 66,942 | 23 | 36% | 64% |
| Mammalian Compounds | 7,108 | 92,693 | 13 | 44% | 56% |
| Glycerophospholipids | 6,914 | 125,006 | 18 | 51% | 49% |
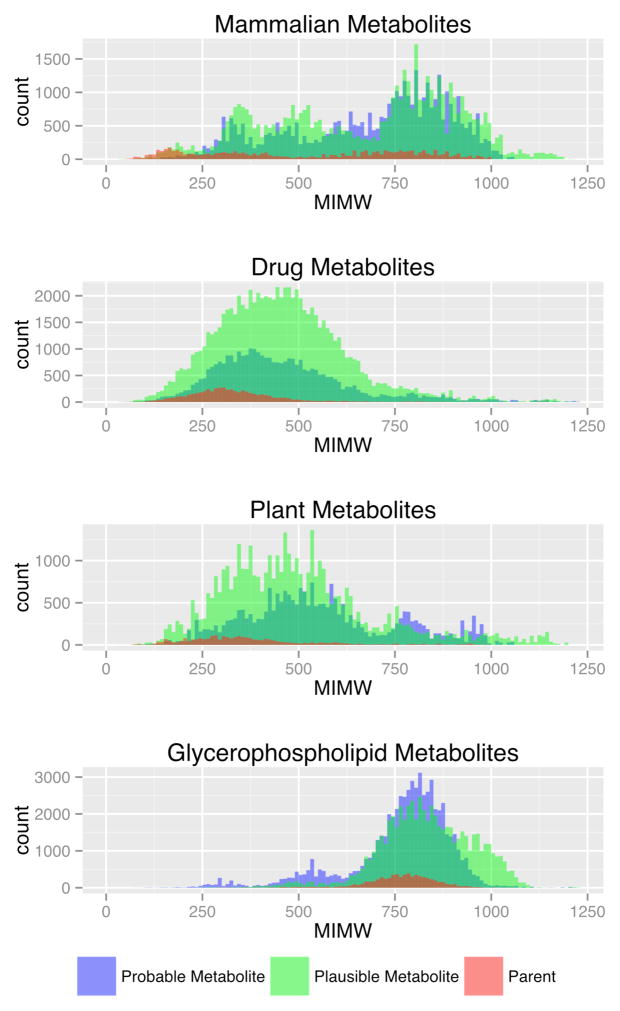
Figure 2 shows the monoisotopic molecular weight (MIMW) distributions for mammalian, drug, plant and glycerophospholipid parents and metabolites. Each individual plot in Figure 2 depicts MIMWs of parents, and probable and plausible metabolites as overlapping histograms. The MIMWs of mammalian parents were spread over a range of approximately 54–999 Da with a mean MIMW of 537 Da. The MIMWs of in silico mammalian metabolites span a range of approximately 31–1201 Da with a mean MIMW of 675 Da. Thus, phase I and phase II metabolic transformations resulted in an expansion of the MIMW range by −23 Da in the lower end and +202 Da in the upper end. The average MIMW of mammalian compounds was increased by approximately 138 Da upon metabolism. Similarly, the MIMW range of drugs was increased by approximately +32 Da with an average MIMW gain of 111 Da. The MIMW range of plant compounds was increased by −37 and +202 Da with an average gain of 142 Da. The glycerophospholipid metabolites showed the largest increase in the lower end of the MIMW range with an increase of approximately −225 Da. The upper end of the glycerophospholipids MIMW range showed a negative shift of 132 Da (i.e. in silico metabolism of higher molecular weight parents resulted in smaller metabolites), but on average, the MIMWs of glycerophospholipids were increased by 34 Da.
Figure 2.
MIMWs for Mammalian, Drug, Plant and Glycerophospholipid Compounds. The histograms were generated with a bin size of 10 Da. Color blending is used to illustrate the MIMW bins shared by different types of compounds. For example, in Figure 2, dark green represents MIMW bins common to probable and plausible metabolites.
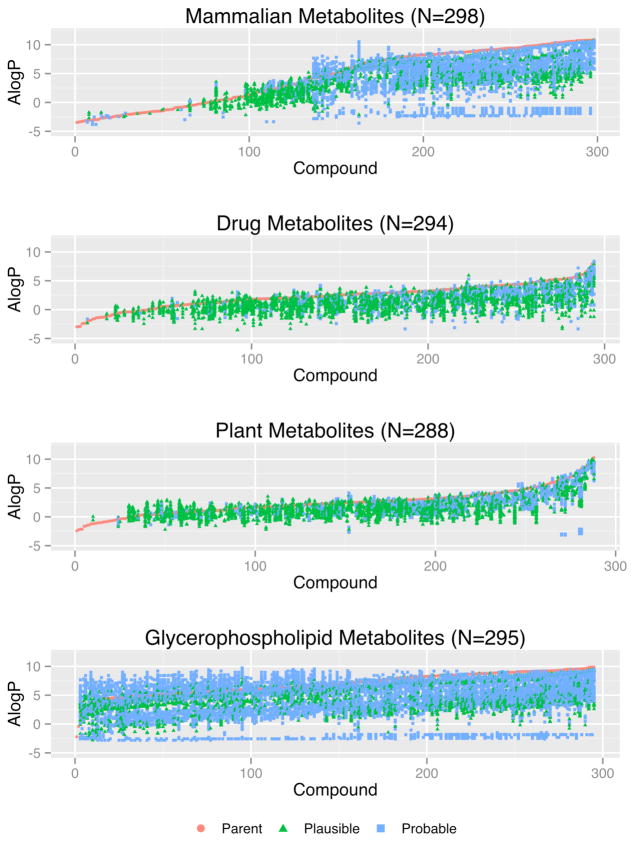
Figure 3 shows AlogP values for parents and metabolites in 4 random samples of approximately 300 compounds collected from the mammalian, drug, plant, and glycerophospholipid datasets. In most cases, the computationally generated metabolites were more polar (lower ALogP) than the parent compounds. These results are consistent with established dogma that phase I and especially phase II biotransformation reactions produce metabolites with increased polarity and thus are more easily eliminated. However, in some cases less polar (higher ALogP) compounds are also observed. Kirchmair et al. reported a similar observation in a recent study41. They found an increase in computational logP values of 4–9% for phase I and 8–13% for phase II metabolic transformation products. These authors also suggested that metabolic reactions leading to more lipophilic molecules might be related to metabolism in skin where an increase in logP allows metabolites to stay attached to lipids and be excreted through desquamation of skin cells. A closer inspection of the chemical structures in Figure 3 reveals that the large majority of in silico metabolites with increased logP are either lipids or lipid related molecules. In the IIMDB the calculated AlogP values can be used to restrict search results. This is especially useful when searching for metabolites in a certain ALogP range (e.g. more polar metabolites that might be found in urine).
Figure 3.
AlogP Values for Random Samples. Each orange point on the x-axis represents a parent compound. In silico metabolites of each parent compound are shown either below (more polar) or above (less polar) the parent that produced it.
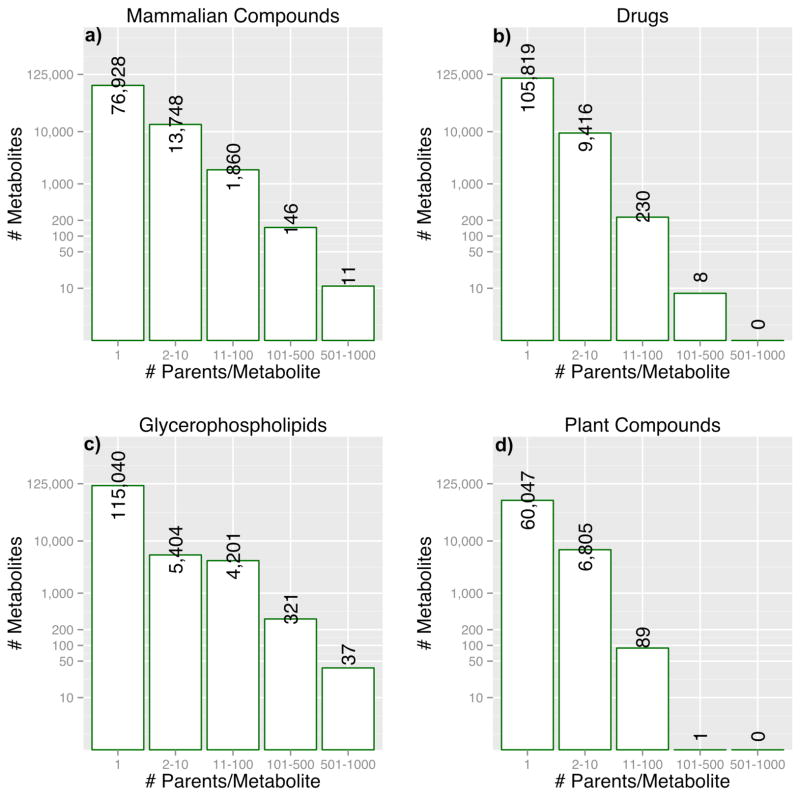
The data in Figure 3 suggest that multiple mammalian and glycerophospholipid parent compounds were being metabolized to form the same final product, since multiple in silico metabolites appear to have the same or very similar AlogP values. Indeed, a closer examination of the four datasets revealed that these metabolites were in fact identical, but were being produced from different parents. Figure 4 shows the number in silico metabolites produced from multiple parents as histograms. For example, 11 in silico metabolites (last bin in the Figure 4-a) were produced from 500–1000 different mammalian parent structures. Interestingly, all of these 11 in silico metabolites were found in PubChem (accessed between 10/01/2012 – 10/31/2012); 72% of them were also found in HMDB 2.5, KEGG (downloaded on 23rd of April 2011) or HumanCyc 16.0. Similarly, 100% of the drug metabolites in the 101–500 bin, 73% of glycerophospholipid metabolites in the 101–500 bin and 61% of plant metabolites in the 11–100 bin were found in PubChem. Acetic acid was produced from 196 different parent plant compounds (Figure 4d). These results suggest that metabolites in IIMDB that are generated from multiple parents are more likely to be present in current database and/or previously found in vivo.
Figure 4.
In Silico Metabolites Produced by Multiple Parents
Figure 5 (top panel) gives an example of a parent mammalian metabolite (2-aminoethoxy(2R)-2,3-bis(tetradecanoyloxy)propoxyphosphinic acid: HMDB08821) metabolized by Meteor. Meteor predicted 50 metabolites of HMDB08821; 35 were not found in any database, 8 were found in HMDB, and 15 were found in PubChem. Figure 5 (bottom panel) shows three of the 50 metabolites. Metabolite-1 (2-aminoethoxy(2S)-2,3-dihydroxypropoxyphosphinic acid: HMDB59660) was found in HMDB and has been identified in vivo42, while the other two compounds were not found in any database even though they are similar to Metabolite-1. Metabolite-1 was produced from HMDB08821 and 753 other parents (most are probably also glycerophospholipids). Metabolites 2 and 3 were produced from HMDB08821 and 80 other parent metabolites. This result is consistent with what is shown in Figure 4; that metabolites produced by multiple parents are more likely to be found in vivo and included in current databases. Selected Meteor generated metabolites for 3 more examples (HMDB06335, HMDB12490, and HMDB00413) can be found in the supplementary information.
Figure 5.
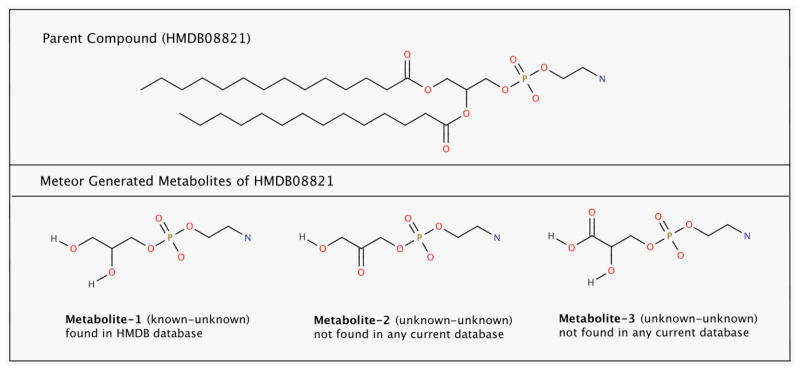
Three Meteor Generated Metabolites of HMDB08821 (Metabolite-1 matched HMDB compound HMDB59660)
As shown in Figure 6, most Meteor generated metabolites are not found in PubChem or any other existing database. Out of 92693 Meteor generated mammalian metabolites, 4578 (~5%) are found in PubChem. Approximately 10% of drug metabolites, 7% of plant metabolites and 2% of glycerophospholipid metabolites are found in PubChem.
Figure 6.
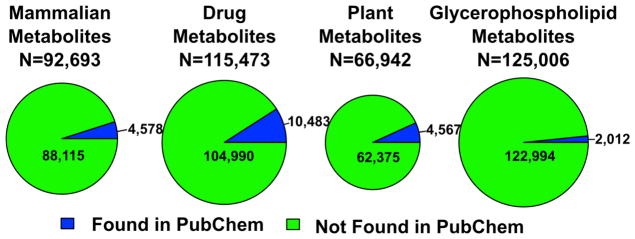
Meteor Generated Metabolites Found in PubChem. Any PubChem compound that had the same connectivity as the query compound or a tautomer of the query compound was considered a match.
Of the 4578 Meteor generated mammalian metabolites found in PubChem, 1682 (1.81%) are also found in HMDB. Approximately 2% (1756) of Meteor generated mammalian metabolites matched a mammalian parent found in HMDB, KEGG or HumanCyc. Thus, of the 7108 mammalian parent compounds, we found that approximately 25% of these were produced by phase I and phase II in silico enzymatic metabolism of other parents. These results confirm that this method produces authentic biochemical metabolites.
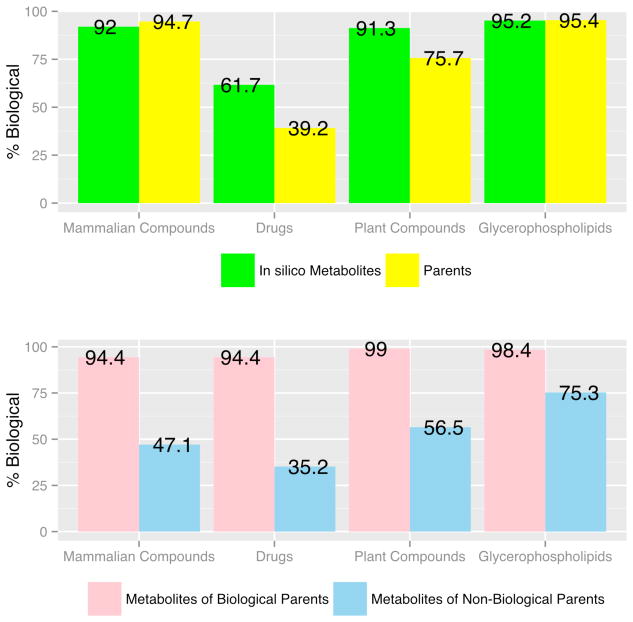
The biological structure matching algorithm BioSM was also used to assess the potential biological relevance of augmenting current databases with computationally generated compounds. Both parent and in silico metabolites were classified as either biological or non-biological (Figure 7). The results indicate that the biological likeness of the mammalian set of compounds compare closely with their in silico metabolites (94.7% vs. 92%). If in silico metabolites of only those parents that are predicted to be biological are considered, they are nearly identical (94.7% vs. 94.4%). Interestingly, 47.1% of in silico metabolites generated from non-biological mammalian parents (i.e. mammalian parents predicted to be non-biological by BioSM) were predicted to be biological. The same trend is observed for all classes of compounds. A greater portion of in silico metabolites of both drugs and plant compounds were predicted to be biological than their parents. In the case of drugs, the number of compounds predicted to be biological increased by 22.5% upon metabolism. As shown in Figure 7 (lower panel), the biological drug metabolites (35.2%) generated from non-biological drug parents (60.8%) account for the observed increase. In most cases, in silico metabolism increased the probability that a compound was scored as biological by BioSM. This seems especially likely when added functional groups are relatively large compared to the parent compound (e.g. glucuronidation).
Figure 7.
Biological Structure Matching with BioSM. Biological Parents refer to parent structures predicted to be biological by BioSM.
IIMDB’s imbedded RESTful web service allows easy integration with third-party applications. Any existing database dependent metabolomics program can use IIMDB as an additional compound source. Obviously, in silico metabolites such as these cannot be annotated with experimental data such as MS/MS spectra or experimental retention times. However, quantitative structure-property relationships (QSPR) based predictive models can be used to efficiently filter out irrelevant metabolites and retain candidates that match experimental values. In this method, in silico generated candidate compounds whose predicted features lie outside the range of values allowed by the QSPR models are removed from consideration. Three such QSPR models (retention index, ECOM50, and drift time) that can be used to filter out IIMDB metabolites are discussed in our previous work43–48 and are implemented within the MolFind46 software. The remaining candidate compounds can then be computationally fragmented and matched with experimental mass spectra to identify unknowns.
Meteor and other in silico metabolism programs are known to over predict the number of possible metabolites if less restrictive constraints are used35,49. However, having a certain number of false positives (i.e. a larger biochemical database) is not a disadvantage if these can be filtered out efficiently. Our previous studies46,48 have shown that predictive models such as those in MolFind can filter out ~87% of candidate compounds in a PubChem bin (monoisotopic molecular weight ± 10 ppm). The remaining candidates are ranked by comparing their predicted properties (retention index, ECOM50, drift index and simulated CID spectrum) with experimental data.
With the inclusion of computationally generated metabolites of additional structures in Lipid Maps and HMDB 3.0, the IIMDB could grow to approximately 2 million structures. Our previous work using BioSM showed that approximately 3 million compounds in PubChem are biological31. Since the majority of compounds in IIMDB (~95%) are not found in PubChem, IIMDB will significantly augment these 3 million biological candidate structures to provide a useful resource for non-targeted metabolomics research.
Summary and Outlook
In summary, IIMDB provides a web accessible, user and programmer friendly metabolite database for mass spectrometry based structure identification. IIMDB is also the largest small molecule database of its kind comprising 23035 known and 400414 computationally generated metabolites. The large majority of in silico compounds are not found in existing databases such as PubChem. Furthermore, most of these compounds are predicted to be biological by BioSM. This article describes the status of the first version of IIMDB. We plan to significantly expand IIMDB by computationally metabolizing additional compounds found in HMDB 3.0 and other classes of lipids in the Lipid Maps Structure Database.
Supplementary Material
Acknowledgments
The authors thank Dr. Augustin Scalbert and Vanessa Neveu of the International Agency for Research on Cancer (IARC) for providing the polyphenol dataset used in this study. This research was funded by the NIH Grant 1R01GM087714, the Agriculture and Food Research Initiative Competitive Grant no. 2011-67016-30331 from the USDA National Institute of Food and Agriculture, and award IIS-0916948 from NSF.
Footnotes
A list of phase-I and phase-II biotransformation types in Meteor, three additional examples of Meteor generated metabolites, a step-by-step guide to viewing and converting structures and a list of all parent structures used in this work are available as supporting information. This material is available free of charge via the Internet at http://pubs.acs.org.
References
- 1.Loftus N, Barnes A, Ashton S, Michopoulos F, Theodoridis G, Wilson I, Ji C, Kaplowitz N. Metabonomic investigation of liver profiles of nonpolar metabolites obtained from alcohol-dosed rats and mice using high mass accuracy MSn analysis. J Proteome Res. 2011;10:705–713. doi: 10.1021/pr100885w. [DOI] [PMC free article] [PubMed] [Google Scholar]
- 2.Hu Y, Yu Z, Yang ZJ, Zhu G, Fong W. Comprehensive chemical analysis of Venenum Bufonis by using liquid chromatography/electrospray ionization tandem mass spectrometry. J Pharm Biomed Anal. 2011;56:210–220. doi: 10.1016/j.jpba.2011.05.014. [DOI] [PubMed] [Google Scholar]
- 3.Baran R, Bowen BP, Bouskill NJ, Brodie EL, Yannone SM, Northen TR. Metabolite Identification in Synechococcus sp. PCC 7002 Using Untargeted Stable Isotope Assisted Metabolite Profiling. Anal Chem. 2010;82:9034–9042. doi: 10.1021/ac1020112. [DOI] [PubMed] [Google Scholar]
- 4.Xu F, Zou L, Lin Q, Ong CN. Use of liquid chromatography/tandem mass spectrometry and online databases for identification of phosphocholines and lysophosphatidylcholines in human red blood cells. Rapid Commun Mass Spectrom. 2009;23:3243–3254. doi: 10.1002/rcm.4246. [DOI] [PubMed] [Google Scholar]
- 5.Yoo BC, Kong SY, Jang SG, Kim KH, Ahn SA, Park WS, Park S, Yun T, Eom HS. Identification of hypoxanthine as a urine marker for non-Hodgkin lymphoma by low-mass-ion profiling. BMC Cancer. 2010;10:1–9. doi: 10.1186/1471-2407-10-55. [DOI] [PMC free article] [PubMed] [Google Scholar]
- 6.Bou Khalil M, Hou W, Zhou H, Elisma F, Swayne LA, Blanchard AP, Yao Z, Bennett SAL, Figeys D. Lipidomics era: accomplishments and challenges. Mass Spectrom Rev. 2010;29:877–929. doi: 10.1002/mas.20294. [DOI] [PubMed] [Google Scholar]
- 7.Wallace BD, Redinbo MR. The human microbiome is a source of therapeutic drug targets. Curr Opin Chem Biol. 2013;17:379–384. doi: 10.1016/j.cbpa.2013.04.011. [DOI] [PMC free article] [PubMed] [Google Scholar]
- 8.Tautenhahn R, Cho K, Uritboonthai W, Zhu Z, Patti GJ, Siuzdak G. An accelerated workflow for untargeted metabolomics using the METLIN database. Nat Biotechnol. 2012;30:826–828. doi: 10.1038/nbt.2348. [DOI] [PMC free article] [PubMed] [Google Scholar]
- 9.Smith Ca, O’Maille G, Want EJ, Qin C, Trauger Sa, Brandon TR, Custodio DE, Abagyan R, Siuzdak G. METLIN: a metabolite mass spectral database. Ther Drug Monit. 2005;27:747–751. doi: 10.1097/01.ftd.0000179845.53213.39. [DOI] [PubMed] [Google Scholar]
- 10.Sud M, Fahy E, Cotter D, Brown A, Dennis Ea, Glass CK, Merrill AH, Murphy RC, Raetz CRH, Russell DW, Subramaniam S. LMSD: LIPID MAPS structure database. Nucleic Acids Res. 2007;35:D527–532. doi: 10.1093/nar/gkl838. [DOI] [PMC free article] [PubMed] [Google Scholar]
- 11.Sud M, Fahy E, Cotter D, Dennis Ea, Subramaniam S. LIPID MAPS-Nature Lipidomics Gateway: An Online Resource for Students and Educators Interested in Lipids. J Chem Educ. 2012;89:291–292. doi: 10.1021/ed200088u. [DOI] [PMC free article] [PubMed] [Google Scholar]
- 12.Wishart DS, Tzur D, Knox C, Eisner R, Guo AC, Young N, Cheng D, Jewell K, Arndt D, Sawhney S, Fung C, Nikolai L, Lewis M, Coutouly M, Forsythe I, Tang P, Shrivastava S, Jeroncic K, Stothard P, Amegbey G, Block D, Hau DD, Wagner J, Miniaci J, Clements M, Gebremedhin M, Guo N, Zhang Y, Duggan GE, Macinnis GD, Weljie AM, Dowlatabadi R, Bamforth F, Clive D, Greiner R, Li L, Marrie T, Sykes BD, Vogel HJ, Querengesser L. HMDB: the Human Metabolome Database. Nucleic Acids Res. 2007;35:D521–526. doi: 10.1093/nar/gkl923. [DOI] [PMC free article] [PubMed] [Google Scholar]
- 13.Wishart DS, Jewison T, Guo AC, Wilson M, Knox C, Liu Y, Djoumbou Y, Mandal R, Aziat F, Dong E, Bouatra S, Sinelnikov I, Arndt D, Xia J, Liu P, Yallou F, Bjorndahl T, Perez-Pineiro R, Eisner R, Allen F, Neveu V, Greiner R, Scalbert A. HMDB 3.0--The Human Metabolome Database in 2013. Nucleic Acids Res. 2013;41:D801–807. doi: 10.1093/nar/gks1065. [DOI] [PMC free article] [PubMed] [Google Scholar]
- 14.Fiehn O, Barupal DK, Kind T. Extending biochemical databases by metabolomic surveys. J Biol Chem. 2011;286:23637–23643. doi: 10.1074/jbc.R110.173617. [DOI] [PMC free article] [PubMed] [Google Scholar]
- 15.Ekroos M, Sjögren T. Structural basis for ligand promiscuity in cytochrome P450 3A4. Proc Natl Acad Sci U S A. 2006;103:13682–13687. doi: 10.1073/pnas.0603236103. [DOI] [PMC free article] [PubMed] [Google Scholar]
- 16.Nam H, Lewis NE, Lerman Ja, Lee D-H, Chang RL, Kim D, Palsson BO. Network context and selection in the evolution to enzyme specificity. Science (New York, NY) 2012;337:1101–1104. doi: 10.1126/science.1216861. [DOI] [PMC free article] [PubMed] [Google Scholar]
- 17.Carbonell P, Lecointre G, Faulon JL. Origins of specificity and promiscuity in metabolic networks. J Biol Chem. 2011;286:43994–434004. doi: 10.1074/jbc.M111.274050. [DOI] [PMC free article] [PubMed] [Google Scholar]
- 18.Wikoff WR, Anfora AT, Liu J, Schultz PG, Lesley Sa, Peters EC, Siuzdak G. Metabolomics analysis reveals large effects of gut microflora on mammalian blood metabolites. Proc Natl Acad Sci U S A. 2009;106:3698–3703. doi: 10.1073/pnas.0812874106. [DOI] [PMC free article] [PubMed] [Google Scholar]
- 19.Gao J, Ellis LBM, Wackett LP. The University of Minnesota Biocatalysis/Biodegradation Database: improving public access. Nucleic Acids Res. 2010;38:D488–D491. doi: 10.1093/nar/gkp771. [DOI] [PMC free article] [PubMed] [Google Scholar]
- 20.Moriya Y, Shigemizu D, Hattori M, Tokimatsu T, Kotera M, Goto S, Kanehisa M. PathPred: an enzyme-catalyzed metabolic pathway prediction server. Nucleic Acids Res. 2010;38:W138–143. doi: 10.1093/nar/gkq318. [DOI] [PMC free article] [PubMed] [Google Scholar]
- 21.Li L, Li R, Zhou J, Zuniga A, Stanislaus AE, Wu Y, Huan T, Zheng J, Shi Y, Wishart DS, Lin G. MyCompoundID: using an evidence-based metabolome library for metabolite identification. Anal Chem. 2013;85:3401–3408. doi: 10.1021/ac400099b. [DOI] [PubMed] [Google Scholar]
- 22.Faust K, Croes D, van Helden J. Metabolic pathfinding using RPAIR annotation. J Mol Biol. 2009;388:390–414. doi: 10.1016/j.jmb.2009.03.006. [DOI] [PubMed] [Google Scholar]
- 23.Kanehisa M, Goto S. KEGG: kyoto encyclopedia of genes and genomes. Nucleic Acids Res. 2000;28:27–30. doi: 10.1093/nar/28.1.27. [DOI] [PMC free article] [PubMed] [Google Scholar]
- 24.Romero P, Wagg J, Green ML, Kaiser D, Krummenacker M, Karp PD. Computational prediction of human metabolic pathways from the complete human genome. Genome Biol. 2005;6:R2. doi: 10.1186/gb-2004-6-1-r2. [DOI] [PMC free article] [PubMed] [Google Scholar]
- 25.Chae L, Lee I, Shin J, Rhee SY. Towards understanding how molecular networks evolve in plants. Curr Opin Plant Biol. 2012;15:177–184. doi: 10.1016/j.pbi.2012.01.006. [DOI] [PubMed] [Google Scholar]
- 26.Pérez-Jiménez J, Neveu V, Vos F, Scalbert A. Systematic analysis of the content of 502 polyphenols in 452 foods and beverages: an application of the phenol-explorer database. J Agric Food Chem. 2010;58:4959–4969. doi: 10.1021/jf100128b. [DOI] [PubMed] [Google Scholar]
- 27.Knox C, Law V, Jewison T, Liu P, Ly S, Frolkis A, Pon A, Banco K, Mak C, Neveu V, Djoumbou Y, Eisner R, Guo AC, Wishart DS. DrugBank 3.0: a comprehensive resource for “omics” research on drugs. Nucleic Acids Res. 2011;39:D1035–1041. doi: 10.1093/nar/gkq1126. [DOI] [PMC free article] [PubMed] [Google Scholar]
- 28.Heller WM, Fleeger CA. USAN and the USP Dictionary of Drug Names. United States Pharmacopeial Convention. 1989:1–761. [Google Scholar]
- 29.Langowski J, Long A. Computer systems for the prediction of xenobiotic metabolism. Adv Drug Delivery Rev. 2002;54:407–415. doi: 10.1016/s0169-409x(02)00011-x. [DOI] [PubMed] [Google Scholar]
- 30.Marchant Ca, Briggs Ka, Long A. In silico tools for sharing data and knowledge on toxicity and metabolism: derek for windows, meteor, and vitic. Toxicol Mech Methods. 2008;18:177–187. doi: 10.1080/15376510701857320. [DOI] [PubMed] [Google Scholar]
- 31.Hamdalla MA, Mandoiu II, Hill DW, Rajasekaran S, Grant DF. BioSM: Metabolomics Tool for Identifying Endogenous Mammalian Biochemical Structures in Chemical Structure Space. J Chem Inf Model. 2013;53:601–612. doi: 10.1021/ci300512q. [DOI] [PMC free article] [PubMed] [Google Scholar]
- 32.Button WG, Judson PN, Long A, Vessey JD. Using absolute and relative reasoning in the prediction of the potential metabolism of xenobiotics. J Chem Inf Comput Sci. 2003;43:1371–1377. doi: 10.1021/ci0202739. [DOI] [PubMed] [Google Scholar]
- 33.Judson PN, Cooke Pa, Doerrer NG, Greene N, Hanzlik RP, Hardy C, Hartmann A, Hinchliffe D, Holder J, Müller L, Steger-Hartmann T, Rothfuss A, Smith M, Thomas K, Vessey JD, Zeiger E. Towards the creation of an international toxicology information centre. Toxicology. 2005;213:117–128. doi: 10.1016/j.tox.2005.05.014. [DOI] [PubMed] [Google Scholar]
- 34.Judson P. Pharmacokinetic Profiling in Drug Research. Wiley-VCH Verlag GmbH & Co. KGaA; 2006. Using Computer Reasoning about Qualitative and Quantitative Information to Predict Metabolism and Toxicity; pp. 417–429. [Google Scholar]
- 35.Kirchmair J, Williamson MJ, Tyzack JD, Tan L, Bond PJ, Bender A, Glen RC. Computational prediction of metabolism: sites, products, SAR, P450 enzyme dynamics, and mechanisms. J Chem Inf Model. 2012;52:617–648. doi: 10.1021/ci200542m. [DOI] [PMC free article] [PubMed] [Google Scholar]
- 36.Mu F, Unkefer CJ, Unkefer PJ, Hlavacek WS. Prediction of metabolic reactions based on atomic and molecular properties of small-molecule compounds. Bioinformatics. 2011;27:1537–1545. doi: 10.1093/bioinformatics/btr177. [DOI] [PMC free article] [PubMed] [Google Scholar]
- 37.OrientDB, version 1.3. Orient Technologies; London: 2012. [Google Scholar]
- 38.Knuth DE. The art of computer programming, volume 2 (3rd ed.): seminumerical algorithms. Addison-Wesley Longman Publishing Co., Inc; Boston, MA, USA: 1997. pp. 1–170. [Google Scholar]
- 39.Tetko IV, Tanchuk VY. Application of associative neural networks for prediction of lipophilicity in ALOGPS 2.1 program. J Chem Inf Comput Sci. 2002;42:1136–1145. doi: 10.1021/ci025515j. [DOI] [PubMed] [Google Scholar]
- 40.Bolton EE, Wang Y, Thiessen PA, Bryant SH. Annual Reports in Computational Chemistry. Vol. 8. Elsevier; 2008. Chapter 12 PubChem: Integrated Platform of Small Molecules and Biological Activities; pp. 217–241. [Google Scholar]
- 41.Kirchmair J, Howlett A, Peironcely JE, Murrell DS, Williamson MJ, Adams SE, Hankemeier T, van Buren L, Duchateau G, Klaffke W, Glen RC. How do metabolites differ from their parent molecules and how are they excreted? J Chem Inf Model. 2013;53:354–367. doi: 10.1021/ci300487z. [DOI] [PubMed] [Google Scholar]
- 42.Yamamoto K, Yoon KD, Ueda K, Hashimoto M, Sparrow JR. A novel bisretinoid of retina is an adduct on glycerophosphoethanolamine. Invest Ophthalmol Vis Sci. 2011;52:9084–9090. doi: 10.1167/iovs.11-8632. [DOI] [PMC free article] [PubMed] [Google Scholar]
- 43.Hall LM, Hall LH, Kertesz TM, Hill DW, Sharp TR, Oblak EZ, Dong YW, Wishart DS, Chen MH, Grant DF. Development of Ecom(50) and Retention Index Models for Nontargeted Metabolomics: Identification of 1,3-Dicyclohexylurea in Human Serum by HPLC/Mass Spectrometry. J Chem Inf Model. 2012;52:1222–1237. doi: 10.1021/ci300092s. [DOI] [PMC free article] [PubMed] [Google Scholar]
- 44.Hill DW, Baveghems CL, Albaugh DR, Kormos TM, Lai S, Ng HK, Grant DF. Correlation of Ecom50 values between mass spectrometers: effect of collision cell radiofrequency voltage on calculated survival yield. Rapid Commun Mass Spectrom. 2012;26:2303–2310. doi: 10.1002/rcm.6353. [DOI] [PMC free article] [PubMed] [Google Scholar]
- 45.Kertesz TM, Hall LH, Hill DW, Grant DF. CE50: quantifying collision induced dissociation energy for small molecule characterization and identification. J Am Soc Mass Spectrom. 2009;20:1759–1767. doi: 10.1016/j.jasms.2009.06.002. [DOI] [PubMed] [Google Scholar]
- 46.Menikarachchi LC, Cawley S, Hill DW, Hall LM, Hall L, Lai S, Wilder J, Grant DF. MolFind: A Software Package Enabling HPLC/MS-Based Identification of Unknown Chemical Structures. Anal Chem. 2012;84:9388–93394. doi: 10.1021/ac302048x. [DOI] [PMC free article] [PubMed] [Google Scholar]
- 47.Kertesz TM, Hill DW, Albaugh DR, Hall LH, Hall LM, Grant DF. Database searching for structural identification of metabolites in complex biofluids for mass spectrometry-based metabonomics. Bioanalysis. 2009;1:1627–1643. doi: 10.4155/bio.09.145. [DOI] [PubMed] [Google Scholar]
- 48.Menikarachchi LC, Hamdalla MA, Hill DW, Grant DF. Chemical Structure Identification in Metabolomics: Computational Modeling of Experimental Features. Comput Struct Biotechnol J. 2013:5. doi: 10.5936/csbj.201302005. [DOI] [PMC free article] [PubMed] [Google Scholar]
- 49.Piechota P, Cronin MTD, Hewitt M, Madden JC. Pragmatic Approaches to Using Computational Methods To Predict Xenobiotic Metabolism. J Chem Inf Model. 2013 doi: 10.1021/ci400050v. [DOI] [PubMed] [Google Scholar]
Associated Data
This section collects any data citations, data availability statements, or supplementary materials included in this article.


