

Abstract
Objective:
This study evaluated longitudinal CSF biomarker measures collected when participants were cognitively normal to determine the magnitude and time course of biomarker changes before the onset of clinical symptoms in subjects with mild cognitive impairment (MCI).
Methods:
Longitudinal CSF collection and cognitive assessments were performed on a cohort of 265 participants who were cognitively normal at their baseline assessment and subsequently developed MCI or dementia. CSF β-amyloid 1–42 (Aβ1–42), total tau (t-tau), and phosphorylated tau (p-tau) were determined longitudinally. Consensus diagnoses were completed annually. Cox regression analyses were performed, with baseline CSF values and time-dependent rate of change in CSF values as covariates (adjusted by baseline age, race, and education), in relation to time to onset of mild cognitive symptoms.
Results:
The mean time from baseline to onset of mild cognitive symptoms was 5.41 years. Increased risk of progressing from normal cognition to onset of clinical symptoms was associated with baseline values of Aβ1–42, p-tau, and the ratios of p-tau/Aβ1–42 and t-tau/Aβ1–42 (p < 0.002). Additionally, the rate of change in the ratios of t-tau/Aβ1–42 (p < 0.004) and p-tau/Aβ1–42 (p < 0.02) was greater among participants who were subsequently diagnosed with MCI.
Conclusions:
Baseline differences in CSF values were predictive of clinical symptoms that were a harbinger of a diagnosis of MCI more than 5 years before symptom onset, and continue to show longitudinal changes as cognitive symptoms develop, demonstrating that baseline and longitudinal changes in CSF biomarkers are evident during the preclinical phase of Alzheimer disease.
There is substantial evidence that a subset of older individuals who are cognitively normal have Alzheimer disease (AD) pathology in their brains, based on both autopsy findings1–3 and amyloid imaging.4–6 It has been presumed that individuals with pathologic change are at high risk of developing cognitive decline over several years, and that the earliest manifestation of this preclinical phase of disease is a change in levels of CSF biomarkers.7
The importance of CSF biomarkers was first emphasized by studies comparing patients with AD dementia with controls.8,9 The most common finding of studies that have examined normal individuals has been that, over a follow-up duration of 1 to 8 years, baseline levels of β-amyloid 1–42 (Aβ1–42) or the ratio of tau or phosphorylated tau (p-tau) to Aβ1–42 is associated with an increased likelihood of being diagnosed with mild cognitive impairment (MCI).10–12
The current study addresses issues that remain unresolved by these studies. First, the outcome in all instances has been the diagnosis of MCI. Because onset of clinical symptoms can precede the diagnosis of MCI by several years,7 it is unclear whether CSF biomarker changes are evident even earlier. Second, most subjects in previous studies were older than 70 years of age; thus, it is unknown whether such CSF changes can be identified at younger ages. Third, no study has examined differences in CSF values at both “baseline” (when subjects were first enrolled) as well as longitudinally, likely because of limitations in sample size and duration of follow-up.
METHODS
Study design.
The study was designed to recruit and follow a cohort of cognitively normal individuals who were primarily in middle age. By design, approximately three-quarters of the participants had a first-degree relative with dementia of the Alzheimer type. The overarching goal was to identify variables among cognitively normal individuals that could predict the subsequent development of mild to moderate symptoms of AD. Subjects were administered a comprehensive neuropsychological battery annually. MRI scans and CSF and blood specimens were obtained approximately every 2 years. The study was initiated at the NIH in 1995, and was stopped in 2005 for administrative reasons. In 2009, a research team at the Johns Hopkins School of Medicine was funded to reestablish the cohort, continue the annual clinical and cognitive assessments, collect blood, and evaluate the previously acquired MRI scans and CSF and blood specimens (see figure e-1 on the Neurology® Web site at www.neurology.org for an outline of the study design).
Standard protocol approvals, registrations, and patient consents.
A total of 349 individuals were initially enrolled in the study, after providing written informed consent.
Selection of participants. Recruitment was conducted by the staff of the Geriatric Psychiatry Branch of the intramural program of the National Institute of Mental Health, with enrollment conducted over time, beginning in 1995 and ending in 2005. Subjects were recruited via printed advertisements, articles in local or national media, informational lectures, or word-of-mouth.
At baseline, all participants completed a comprehensive evaluation at the Clinical Center of the NIH. This evaluation consisted of a physical and neurologic examination, an ECG, standard laboratory studies (e.g., complete blood count, vitamin B12 level, thyroid function), and neuropsychological testing. Individuals were excluded from participation if they were cognitively impaired, as determined by cognitive testing, or had significant medical, psychiatric, or neurologic disorders (e.g., severe cerebrovascular disease, alcohol or drug abuse, epilepsy). See appendix e-1 for further details regarding the evaluation of the participants.
Clinical and cognitive assessment.
The annual cognitive assessment consisted of a neuropsychological battery covering all major cognitive domains (see Albert et al., unpublished, for the contents of the current neuropsychological battery). A clinical assessment was also conducted annually. Since the study has been conducted at Johns Hopkins, the clinical evaluation has included the following: a physical and neurologic examination, assessments of medication use, behavioral and mood assessments,13,14 family history of dementia, history of symptom onset, and a Clinical Dementia Rating, based on a semistructured interview.15,16 The clinical assessments given at the NIH covered similar domains.
Consensus diagnoses.
Each case in the study received a consensus diagnosis that was handled in a similar manner: 1) clinical data pertaining to the medical, neurologic, and psychiatric status of the subject were examined, 2) reports of changes in cognition by the subject and by collateral sources were examined, and 3) decline in cognitive performance was established. The estimated age at which the clinical symptoms began was based primarily on the reports of the subject and collateral. The clinical diagnoses were made blinded to the results of CSF analyses. See appendix e-2 for further details regarding the diagnostic procedures.
CSF assessments.
CSF was collected from 307 participants at baseline. Of these, 199 had CSF collected on more than one visit during the time the study was conducted at the NIH. The mean time between the first and last CSF collection, for those with more than one spinal tap was 4.17 years (SD 2.56) (see table e-1 for details regarding the frequency of CSF collection). No CSF has been collected since the study was reinitiated at Johns Hopkins. The CSF specimens were analyzed using the same protocol used in the Alzheimer's Disease Neuroimaging Initiative. This protocol used the xMAP-based AlzBio3 kit (Innogenetics, Ghent, Belgium) run on the Bioplex 200 system. The kit contains monoclonal antibodies specific for Aβ1–42 (4D7A3), total tau (t-tau) (AT120), and p-tau181p (AT270), each chemically bonded to unique sets of color-coded beads, and analyte-specific detector antibodies (HT7, 3D6). Calibration curves were produced for each biomarker using aqueous buffered solutions that contained the combination of 3 biomarkers at concentrations ranging from 25 to 1,555 pg/mL for recombinant tau, 54 to 1,799 pg/mL for synthetic Aβ1–42, and 15 to 258 pg/mL for a synthetic tau peptide phosphorylated at the threonine 181 position (i.e., the p-tau181p standard). All assays were run in triplicate. Each subject had all their samples analyzed on the same plate. See appendix e-3 for details regarding the CSF assay and the intercorrelations of the CSF measures; additional details have been published elsewhere.17
Statistical methods.
The statistical analyses were designed to determine whether any of the CSF measures obtained from participants when they were first enrolled (i.e., at “baseline”) were related to time to onset of clinical symptoms. A set of Cox regression analyses was then performed for each individual CSF measure separately, using age at onset of clinical symptoms as the outcome variable. These analyses used baseline CSF values and time-dependent rate of change in these values as covariates; the censoring time was defined as the last date of assessment. These models tested whether each of the CSF values (adjusted by baseline age, education, and race) was related to time to onset of clinical symptoms, and whether there was a differential rate of change over time in the CSF values before the onset of symptoms. See figures e-2, e-3, and e-4 for plots showing the CSF values for each subject over time.
Additionally, we calculated hazard ratios for each of the significant variables in the univariate baseline models and in the models examining rate of change over time. Before this analysis, the CSF values were converted to z scores (i.e., scores with a mean of 0 and an SD of 1, averaged over the scores for the normal subjects) so that it would be possible to compare the hazard ratios for each CSF measure along the same metric. The hazard ratio indicates the change in relative risk per 1 unit change in the predictor. For example, if the hazard ratio for CSF Aβ1–42 is 0.66, the hazard of clinical symptom onset is reduced by a factor of 0.66 (i.e., by 66%) for each unit increase in the z score for this CSF value. Likewise, if the hazard ratio for CSF p-tau is 1.54, the hazard of clinical symptom onset is increased by a factor of 1.54 (i.e., by 54%) for each unit increase in the z score for this CSF value. All data analyses presented here were performed using R version 2.14.1 (see appendices e-4 and e-5 for further details regarding the statistical methods).
RESULTS
The CSF findings presented here pertain to 265 participants in the BIOCARD Study. Their demographic characteristics are shown in table 1, as are the characteristics of the cohort as a whole (n = 349). Data from 2 groups were evaluated. Group 1 consisted of subjects who were cognitively normal at last evaluation (n = 186) combined with subjects diagnosed as “impaired not MCI” (n = 26) at their last visit (total group 1 = 212). Group 2 consisted of subjects who received a diagnosis of MCI (n = 42) or dementia (n = 11) at their last visit (total group 2 = 53). Table 2 shows the characteristics of these groups at baseline. The mean duration of follow-up for the participants included in these analyses was 8.17 years (SD 3.38). Although the data presented here include subjects with a diagnosis of “impaired not MCI” in the normal group, results were comparable when these individuals were excluded from the analysis (data not shown). The reasons for exclusion of other subjects from the analyses are summarized in table 2.
Table 1.
Participant characteristics at baseline in relation to the cohort as a whole
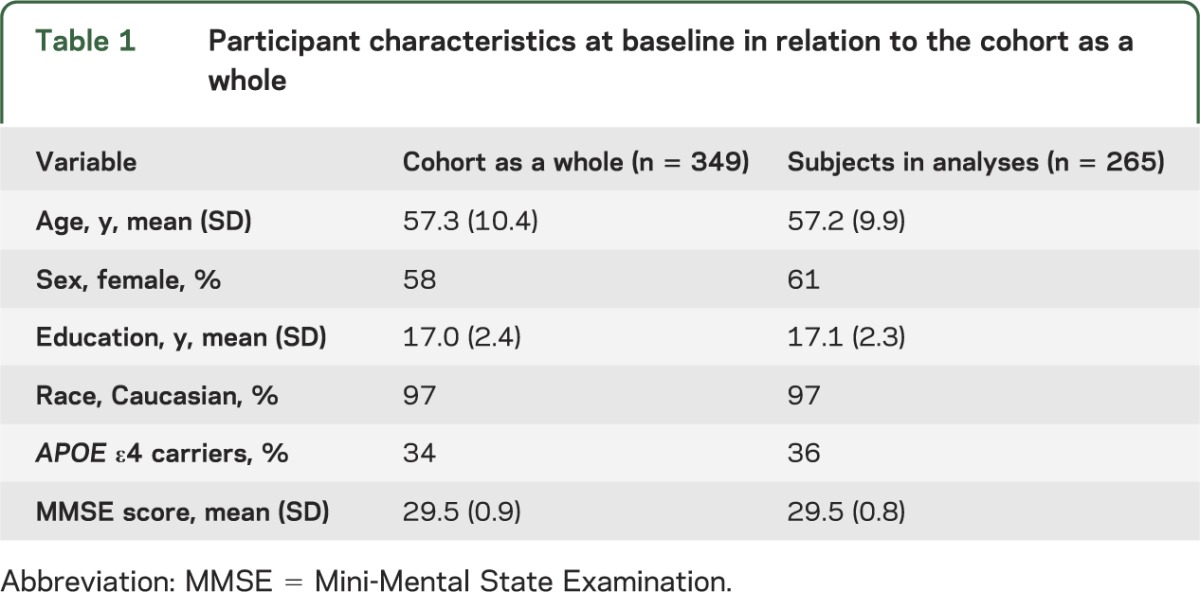
Table 2.
Participant characteristics at baseline and follow-up features stratified by outcome status

Baseline Aβ1–42, t-tau, and p-tau values as well as the ratio of t-tau/Aβ1–42 and p-tau/Aβ1–42 were examined as predictors of time to onset of clinical symptoms. Table 3 presents the means and SDs of these variables at baseline. The mean time from baseline to onset of clinical symptoms for participants who developed symptoms was 5.42 years (±3.21). Cox regression models were completed for each of the 5 variables at baseline (adjusted by baseline age, education, and race). Relative risks (i.e., hazard ratios) were calculated for each of the measures examined in the baseline Cox regression models (table 4). Four of the 5 baseline Cox regression models (those for baseline values of Aβ1–42, p-tau, tau/Aβ1–42, p-tau/Aβ1–42) showed a significant relationship with time to onset of clinical symptoms (at the p < 0.002 level or greater).
Table 3.
CSF values at baseline for subjects who remained normal vs subjects who developed clinical symptoms and were diagnosed with MCI or AD dementia

Table 4.
HRs for baseline and rate of change in CSF values in relation to onset of clinical symptoms
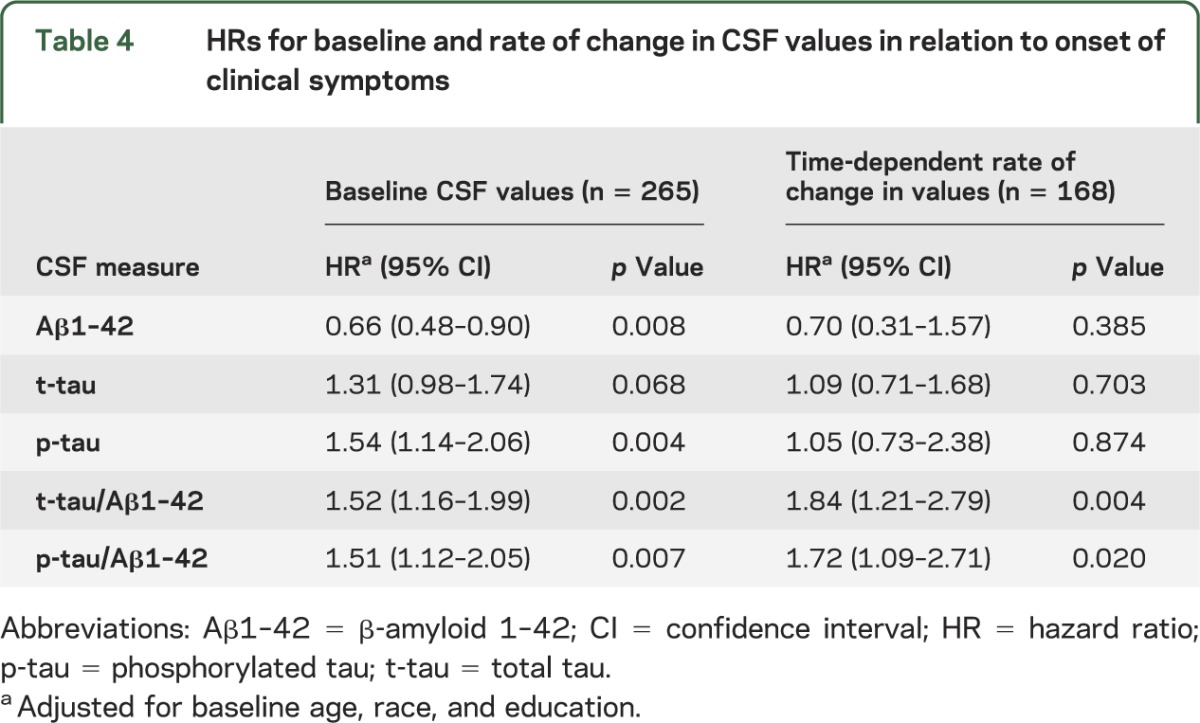
For each of the 5 measures, we also completed Cox regression models using both baseline CSF values and time-dependent rate of change in these values as covariates, adjusting for baseline age, education, and race (see table 4). The 2 CSF ratios, t-tau/Aβ1–42 (p < 0.004) and p-tau/Aβ1–42 (p < 0.02), showed a differential rate of change over time in subjects who developed cognitive symptoms relative to those who did not.
The survival curve from the Cox regression model for p-tau was plotted to facilitate the visualization of our results (figure 1). These curves were derived from a Cox regression model for each variable, by categorizing the baseline variable into 2 groups described above, using the median value of each CSF biomarker at baseline as a cutoff for the groups (tables e-2 and e-3 and figures e-5 through e-9).
Figure 1. Kaplan-Meier plot for the value of CSF phosphorylated tau (p-tau), based on the Cox regression model.
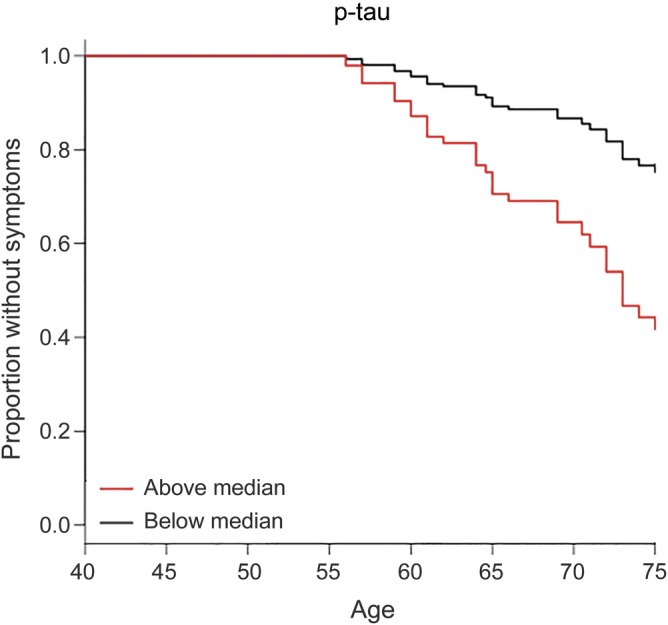
The black line represents values below the median at baseline and the red line represents values at or above the median at baseline. The y-axis represents the proportion of subjects remaining without symptoms. The plot starts at age 50 years and is truncated at 75 years because few cases remained unimpaired after this age, making those estimates unreliable. Note that the survival curves are not adjusted for age, education, or race.
DISCUSSION
In this study, CSF biomarker analyses and longitudinal clinical and cognitive evaluations were conducted in a large cohort of individuals who were cognitively normal at baseline, some of whom subsequently developed MCI or dementia (n = 53). Our data show that baseline differences in CSF Aβ1–42 and p-tau, as well as the ratios of t-tau/Aβ1–42 and p-tau/Aβ1–42, are predictive of outcome more than 5 years before clinical symptom onset. In the current analyses, increased risk of progressing from normal cognition to onset of clinical symptoms was associated with a lower baseline value of CSF Aβ1–42, a higher value of CSF p-tau, and a higher value of both ratios. Additionally, the rate of increase in the ratio of p-tau/Aβ1–42 or t-tau/Aβ1–42 was differentially greater among those individuals who were subsequently diagnosed with MCI or dementia.
As noted previously, several studies have reported the utility of CSF biomarkers in predicting conversion of MCI to AD. Gustafson et al.10 followed a cohort of individuals (aged 70–84 years) who were not demented and reported that only low Aβ1–42 at baseline predicted significant decline or dementia. Li et al.11 examined a group of normal individuals (aged 21–100 years) using a predefined cut-point for t-tau/Aβ1–42 ratio and reported an association between this CSF measure at baseline and progression to MCI over a 3.5-year period. Fagan et al.12 examined a group of normal individuals (aged 60–91 years) and found that both ratios (i.e., p-tau/Aβ1–42 and t-tau/Aβ1–42) were associated with increased risk of progression to MCI or dementia over 1 to 8 years.
Our findings confirm and extend the prior results in several important ways. First, differences in CSF at baseline were predictive of outcome more than 5 years before the onset of clinical symptoms. Because the onset of clinical symptoms typically precedes the diagnosis of MCI by several years, this extends previous findings that used the date of clinical diagnosis of MCI as the outcome of interest. Second, the average age of the cohort was 56.8 years at baseline. Because previous studies have been conducted primarily among individuals who were more than 70 years of age, this extends the age at which CSF biomarker changes may be observed among normal individuals who subsequently develop MCI. These findings are also consistent with recent estimates of the onset of CSF changes before diagnosis among individuals with a dominant AD mutation, because they showed that lower CSF Aβ1–42 was associated with estimated age at onset in the kindred.18 Lastly, the strength of the findings is emphasized by the fact that increased risk of progression from normal cognition to onset of clinical symptoms was observed both in relation to baseline CSF values and also to rate of change over time in CSF measures.
Interestingly, while the hazard ratios were quite similar for the baseline values of CSF Aβ1–42 and p-tau and the ratios t-tau/Aβ1–42 and p-tau/Aβ1–42, the longitudinal assessments emphasized the importance of the ratios of p-tau and t-tau to Aβ1–42. For example, the hazard ratios associated with the rate of change for CSF Aβ1–42 and p-tau were 0.70 (not significant) and 1.09 (not significant), while the hazard ratio for the rate of change in the ratios of t-tau/Aβ1–42 and p-tau/Aβ1–42 were 1.84 (p < 0.004) and 1.72 (p < 0.02). Moreover, the risk of progression associated with rate of change in the ratios of t-tau/Aβ1–42 and p-tau/Aβ1–42 was higher than that due to baseline values of Aβ1–42 and p-tau. This is the first study, to our knowledge, to show that the rate of change of these ratios is more powerful as a predictor than baseline values in determining who develops early cognitive symptoms and offers hope that these biomarkers may be useful longitudinally in clinical trials. For example, incorporation of rate of change of tau/Aβ1–42 and p-tau/Aβ1–42 in treatment trials could serve as a biomarker to determine whether the treatment is having its intended effect.
We cannot rule out the possibility that baseline CSF levels in our participants reflect lifelong abnormal CSF values. However, the fact that the rate of change was also predictive of time to develop clinical symptoms suggests that the baseline CSF values likely reflect an actual alteration in the production or clearance of these biomarkers with age in the brain.
The study must be interpreted in the context of its limitations. The subjects are well educated and primarily Caucasian, with the majority having a family history of dementia, so the results may not generalize to the US population at large. It will be particularly important to know the impact of family history of dementia and APOE genotype on these findings. Such analyses will require longer follow-up and more detailed analyses.
Our findings are consistent with the hypothesis contained in the working group report on “preclinical AD” suggesting that a change in CSF values is detectable during the phase of AD when pathology is developing but clinical symptoms have not yet been reported.7 The hypotheses summarized in this working group report proposed that alterations in both amyloid and tau levels in CSF, as well as volumetric changes on MRI scans, would precede changes in cognition. Although our study has collected MRI data relevant to this issue, we are not yet in a position to address the question of the sequence in which CSF biomarkers and brain atrophy occurs or how our findings might compare with proposed hypothetical models.19
Interestingly, while the working group report did not hypothesize a differential sensitivity of CSF p-tau vs t-tau during the “preclinical” phase of AD, our findings suggest this might be the case. This would be consistent with the fact that p-tau is a more direct measure of neuronal damage, and the formation of neurofibrillary tangles that are a hallmark of AD pathology.
The findings of biomarker changes in a younger cohort and the extended time interval between biomarker changes and onset of the earliest symptoms have been reported by the Dominantly Inherited Alzheimer Network (DIAN) Study, which found that biomarker alterations may precede cognitive measures by almost 25 years.18 However, there are important differences between the 2 studies. The DIAN Study looked at cross-sectional CSF measures, while participants in our study were followed longitudinally after enrollment, with a mean duration of follow-up of 8.17 years. Moreover, the DIAN Study involved participants with autosomal dominant AD, which makes up only 1% of all cases of AD, whereas our study involves participants at risk of the more common sporadic, late onset AD. Unlike the DIAN Study, we did not observe an increase in Aβ1–42 preceding a subsequent decline, consistent with the hypothesis that autosomal dominant AD causes an overproduction in Aβ1–42. Nevertheless, both studies have broader implications for the conduct of clinical trials in cognitively normal subjects at risk of AD.
Supplementary Material
ACKNOWLEDGMENT
The authors are grateful to the members of the BIOCARD Scientific Advisory Board who provide continued oversight and guidance regarding the conduct of the study, including Drs. John Cernansky, David Holtzman, David Knopman, Walter Kukull, and John McArdle, as well as Drs. Neil Buckholtz, John Hsiao, Laurie Ryan, and Jovier Evans, who provide oversight on behalf of the National Institute on Aging and the National Institute of Mental Health (NIMH), respectively. The authors thank the members of the BIOCARD Resource Allocation Committee who provide ongoing guidance regarding the use of the biospecimens collected as part of the study, including Drs. Constantine Lyketsos, Carlos Pardo, Gerard Schellenberg, Leslie Shaw, Madhav Thambisetty, and John Trojanowski. The authors acknowledge the contributions of the Geriatric Psychiatry Branch (GPB) of the intramural program of NIMH who initiated the study (principal investigator: Dr. Trey Sunderland). The authors are particularly indebted to Dr. Karen Putnam, who has provided ongoing documentation of the GPB study procedures and the data files received from NIMH.
GLOSSARY
- Aβ1–42
β-amyloid 1–42
- AD
Alzheimer disease
- BIOCARD
Biomarkers for Older Controls at Risk for Dementia
- DIAN
Dominantly Inherited Alzheimer Network
- MCI
mild cognitive impairment
- p-tau
phosphorylated tau
- t-tau
total tau
Footnotes
Supplemental data at www.neurology.org
AUTHOR CONTRIBUTIONS
Dr. Moghekar took part in the design and conceptualization of the study, supervised the analysis of the CSF, participated in the interpretation of the analyses, drafted and revised the manuscript, and takes overall responsibility for the data and the manuscript. Ms. S. Li and Ms. Lu performed the statistical analyses, participated in the interpretation of the data, and critically reviewed the manuscript. Mr. M. Li performed the analyses of the CSF and critically reviewed the manuscript. Dr. Wang supervised the statistical analyses and the interpretation of the data, and critically reviewed the manuscript. Dr. Albert took part in the design and conceptualization of the study, obtained funding, participated in the interpretation of the analyses, and drafted and revised the manuscript. Dr. O’Brien took part in the design and conceptualization of the study, supervised the analysis of the CSF, participated in the interpretation of the analyses, and critically reviewed the manuscript.
STUDY FUNDING
Supported in part by grants from the NIH: U01-AG03365 and P50-AG005146.
DISCLOSURE
A. Moghekar, S. Li, Y. Lu, M. Li, and M. Wang report no disclosures. M. Albert serves on scientific advisory boards for Eli Lilly, Eisai, Genentech, and AgeneBio, and receives research support from GE Healthcare. R. O’Brien reports no disclosures. Go to Neurology.org for full disclosures.
REFERENCES
- 1.Hulette CM, Welsh-Bohmer KA, Murray MG, Saunders AM, Mash DC, McIntyre LM. Neuropathological and neuropsychological changes in “normal” aging: evidence for preclinical Alzheimer disease in cognitively normal individuals. J Neuropathol Exp Neurol 1998;57:1168–1174 [DOI] [PubMed] [Google Scholar]
- 2.Knopman DS, Parisi JE, Salviati A, et al. Neuropathology of cognitively normal elderly. J Neuropathol Exp Neurol 2003;62:1087–1095 [DOI] [PubMed] [Google Scholar]
- 3.Bennett DA, Schneider JA, Arvanitakis Z, et al. Neuropathology of older persons without cognitive impairment from two community-based studies. Neurology 2006;66:1837–1844 [DOI] [PubMed] [Google Scholar]
- 4.Morris JC, Roe CM, Xiong C, et al. APOE predicts amyloid-beta but not tau Alzheimer pathology in cognitively normal aging. Ann Neurol 2010;67:122–131 [DOI] [PMC free article] [PubMed] [Google Scholar]
- 5.Rowe CC, Ellis KA, Rimajova M, et al. Amyloid imaging results from the Australian Imaging, Biomarkers and Lifestyle (AIBL) study of aging. Neurobiol Aging 2010;31:1275–1283 [DOI] [PubMed] [Google Scholar]
- 6.Reiman EM, Chen K, Liu X, et al. Fibrillar amyloid-beta burden in cognitively normal people at 3 levels of genetic risk for Alzheimer’s disease. Proc Natl Acad Sci USA 2009;106:6820–6825 [DOI] [PMC free article] [PubMed] [Google Scholar]
- 7.Sperling RA, Aisen PS, Beckett LA, et al. Toward defining the preclinical stages of Alzheimer’s disease: recommendations from the National Institute on Aging–Alzheimer's Association workgroups on diagnostic guidelines for Alzheimer's disease. Alzheimers Dement 2011;7:280–292 [DOI] [PMC free article] [PubMed] [Google Scholar]
- 8.Clark CM, Xie S, Chittams J, et al. Cerebrospinal fluid tau and beta-amyloid: how well do these biomarkers reflect autopsy-confirmed dementia diagnoses? Arch Neurol 2003;60:1696–1702 [DOI] [PubMed] [Google Scholar]
- 9.Sunderland T, Linker G, Mirza N, et al. Decreased beta-amyloid1-42 and increased tau levels in cerebrospinal fluid of patients with Alzheimer disease. JAMA 2003;289:2094–2103 [DOI] [PubMed] [Google Scholar]
- 10.Gustafson DR, Skoog I, Rosengren L, Zetterberg H, Blennow K. Cerebrospinal fluid beta-amyloid 1-42 concentration may predict cognitive decline in older women. J Neurol Neurosurg Psychiatry 2007;78:461–464 [DOI] [PMC free article] [PubMed] [Google Scholar]
- 11.Li G, Sokal I, Quinn JF, et al. CSF tau/Abeta42 ratio for increased risk of mild cognitive impairment: a follow-up study. Neurology 2007;69:631–639 [DOI] [PubMed] [Google Scholar]
- 12.Fagan AM, Roe CM, Xiong C, Mintun MA, Morris JC, Holtzman DM. Cerebrospinal fluid tau/beta-amyloid(42) ratio as a prediction of cognitive decline in nondemented older adults. Arch Neurol 2007;64:343–349 [DOI] [PubMed] [Google Scholar]
- 13.Cummings JL, Mega M, Gray K, Rosenberg-Thompson S, Carusi DA, Gornbein J. The Neuropsychiatric Inventory: comprehensive assessment of psychopathology in dementia. Neurology 1994;44:2308–2314 [DOI] [PubMed] [Google Scholar]
- 14.Yesavage JA, Brink TL, Rose TL, et al. Development and validation of a geriatric depression screening scale: a preliminary report. J Psychiatr Res 1982–1983;17:37–49 [DOI] [PubMed] [Google Scholar]
- 15.Hughes CP, Berg L, Danziger WL, Coben LA, Martin RL. A new clinical scale for the staging of dementia. Br J Psychiatry 1982;140:566–572 [DOI] [PubMed] [Google Scholar]
- 16.Morris JC. The Clinical Dementia Rating (CDR): current version and scoring rules. Neurology 1993;43:2412–2414 [DOI] [PubMed] [Google Scholar]
- 17.Moghekar A, Goh J, Li M, Albert M, O'Brien RJ. Cerebrospinal fluid Aβ and tau level fluctuation in an older clinical cohort. Arch Neurol 2012;69:246–250 [DOI] [PMC free article] [PubMed] [Google Scholar]
- 18.Bateman RJ, Xiong C, Benzinger TL, et al. Clinical and biomarker changes in dominantly inherited Alzheimer’s disease. N Engl J Med 2012;367:795–804 [DOI] [PMC free article] [PubMed] [Google Scholar]
- 19.Jack CR, Knopman D, Jagust W, et al. Tracking pathophysiological processes in Alzheimer's disease: an updated hypothetical model of dynamic biomarkers. Lancet Neurol 2013;12:207–216 [DOI] [PMC free article] [PubMed] [Google Scholar]
Associated Data
This section collects any data citations, data availability statements, or supplementary materials included in this article.