Abstract
The profile structure of a hybrid lipid bilayer, tethered to the surface of an inorganic substrate and fully hydrated with a bulk aqueous medium in an electrochemical cell, was investigated as a function of the applied transbilayer electric potential via time-resolved neutron reflectivity, enhanced by interferometry. Significant, and fully reversible structural changes were observed in the distal half (with respect to the substrate surface) of the hybrid bilayer comprised of a zwitterionic phospholipid in response to a +100mV potential with respect to 0mV. These arise presumably due to reorientation of the electric dipole present in the polar headgroup of the phospholipid and its resulting effect on the thickness of the phospholipid’s hydrocarbon chain layer within the hybrid bilayer’s profile structure. The profile structure of the voltage-sensor domain from a voltage-gated ion channel protein within a phospholipid bilayer membrane, tethered to the surface of an inorganic substrate and fully hydrated with a bulk aqueous medium in an electrochemical cell, was also investigated as a function of the applied transmembrane electric potential via time-resolved X-ray reflectivity, enhanced by interferometry. Significant, fully-reversible, and different structural changes in the protein were detected in response to ±100mV potentials with respect to 0mV. The approach employed is that typical of transient spectroscopy, shown here to be applicable to both neutron and X-ray reflectivity of thin films.
Introduction
Intense, pulsed laser sources greatly facilitated the development of time-resolved (or transient) techniques for photon spectroscopy at longer wavelengths, e.g., IR to UV. Particle accelerator based synchrotron and free electron laser (FEL) sources have enabled the extension of these photon techniques, including scattering, into the hard X-ray regime. The time-scales accessible for the latter at shorter X-ray wavelengths are now approaching those of the former at much longer wavelengths, namely the femtosecond regime [1]. In stark contrast, the very low flux of thermal or cold neutrons available from reactor sources has generally limited any such time-resolved studies to exceedingly long time-scales. However, with the implementation of particle accelerator based spallation neutron sources, such as the Spallation Neutron Source at Oak Ridge National Laboratory in the U.S., time-resolved studies have become possible extending to the millisecond regime, potentially limited only by the duration of the neutron pulse for those systems exhibiting fully-reversible cycles of excitation-relaxation (see below).
Time-resolved spectroscopic and scattering techniques are most easily applied to the study of systems that can be excited by an external perturbation and then relax reversibly, thereby enabling the enhancement of signal-to-noise levels by averaging over many cycles of the excitation-relaxation process. In such classic “pump-probe” studies, the duration of both the “pump” pulse of the perturbation responsible for the system’s excitation and the subsequent “probe” pulse investigating the response of the system must be short relative to the kinetics of the response. In addition, the repetition rate for the excitation-relaxation cycle is then limited by the kinetics of the response to the excitation and the subsequent kinetics of the system’s relaxation to the unperturbed initial state.
For the membrane proteins involved in neurological signal transmission in biological systems, namely ligand-gated and voltage-gated ion channel proteins, the kinetics of channel opening and closing are relatively slow in the sub-millisecond to milliseconds regime, depending on how individual channels contribute to the ensemble average [2]. Here, the perturbing excitation is the change in the transmembrane electric potential for the case of voltage-gated ion channel proteins. Herein we report the development of time-resolved neutron and X-ray reflectivity techniques, enhanced by interferometry, for the investigation of the structural response of the proteins to changes in the transmembrane electric potential. The first “test case” for this approach is provided by a hybrid lipid bilayer, its proximal side comprised of a self-assembled monolayer chemisorbed onto the surface of an inorganic substrate and the distal side comprised of a subsequently physisorbed phospholipid monolayer, with proximal/distal defined with respect to the substrate’s surface. For the neutron case, the design of the electrochemical cell required for the application of a transmembrane potential to the fully-hydrated hybrid bilayer is simplified by the extraordinary penetration of most solid or liquid materials by thermal or cold neutrons. For the X-ray case, this is more complicated by the far more limited penetration of these materials by the photons. Significant, and fully reversible structural changes were observed in the distal half (with respect to the substrate surface) of the hybrid bilayer comprised of a zwitterionic phospholipid in response to a transbilayer potential of +100mV with respect to 0mV, using time-resolved neutron interferometry. These arise presumably due to reorientation of the electric dipole present in the polar headgroup of the phospholipid and its resulting effect on the thickness of the phospholipid’s hydrocarbon chain layer within the hybrid bilayer’s profile structure. Appropriate reconstituted membrane specimens for similar time-resolved investigation of the voltage-gated ion channel proteins have already been prepared and extensively characterized. Significant, fully-reversible, and different changes in the profile structure of the voltage-sensor domain (VSD) of a voltage-gated potassium channel, vectorially-oriented within a reconstituted phospholipid bilayer membrane, in response to transmembrane potentials of ±100mV with respect to 0mV, have been detected using time-resolved X-ray interferometry.
Experimental Methods
a) Hybrid Bilayer and Neutron Interferometry
The hybrid bilayer was formed via the chemisorption of OTS (octadecyltrichlorosilane) onto the silicon oxide surface of a Si-Ge-Si multilayer substrate fabricated on a commercial silicon wafer by dc magnetron sputtering. The thickness for each of the sputtered layers was 20Å. A monolayer of POPC (palmitoyloleoylphosphatidylcholine) was physisorbed onto the hydrophobic surface of the substrate alkylated with the OTS via the rapid-solvent exchange technique [3].
The electrochemical cell [4a] and the Magnetism Reflectometer [4b] on beamline 4A at the SNS have been described previously. The heavily-doped, sputtered silicon layers in the multilayer served as the working electrode while a platinum wire in the aqueous phase hydrating the hybrid bilayer on the substrate’s surface served as the counter electrode in the electrochemical cell. The transbilayer electric potential was controlled with a commercially available potentiostat (CH Instruments, Inc., Model CHI660D). With the pulsed, polychromatic spallation source, neutron reflectivity data is collected via time-of-flight, the incident beam comprised of a defined band of wavelengths, at a fixed angle of incidence equal to the angle of reflection with respect to the plane of the surface of the substrate. Several values of the angle of incidence/reflection are utilized in order to effectively span a range of momentum transfer perpendicular to the substrate surface, Qz. In order to obtain sufficient counting statistics for each angle, the potential on the working electrode was cycled periodically between two values, 0mV and +100mV, and neutron reflectivity data was collected at each potential value for 20s and stored. The total time for data collection at each potential, necessary to provide reasonable statistics for the range of Qz accessed via each value of the angle of incidence/reflection, ranged from 5 minutes for Qz nearer the critical angle where the specular reflectivity count-rate is high to 5 hours for larger Qz where the specular reflectivity is diminished by several orders of magnitude. The data collected at each value of the potential was then combined additively for each region of Qz and, using a standard data reduction procedure, spliced together using the overlapping portions of adjacent regions of Qz to thereby provide the average reflectivity data over the full range of Qz accessed for each value of the transbilayer electric potential.
The extracted specular neutron reflectivity data for each transbilayer potential was then normalized by the Fresnel function for an ideal interface, using a value of Qc = 0.014Å−1 corresponding to the critical angle for a silicon/90%D2O:10%H2O interface. The resulting Fresnel-normalized specular reflectivity data were then analyzed by three methods. The first was via the autocorrelation of the gradient of the neutron scattering-length density (nSLD) profile obtained by an inverse Fourier transform of the Fresnel-normalized data. The second utilized the so-called “slab-models” comprised of error functions for the nSLD profile of the Si-Ge-Si multilayer with the hybrid OTS:POPC bilayer on its surface refined against the Fresnel-normalized data. The third utilized a “constrained refinement” approach [5], employing the known profile structure of the multilayer substrate as a reference structure to solve the phase problem and thereby derive the nSLD profile of the hybrid bilayer directly.
Two measures of the errors in the data were utilized. The first was the standard error in the specular reflectivity R(Qz) at a particular value of Qz, where R(Qz) was simply the sum over repeated measurements at one value of the applied transmembrane potential, with the standard error expressed as that for the sum. The second was the point-to-point variation in R(Qz) along Qz, since these fluctuations are not physical in the sense that they would arise from correlations in the bounded gradient profile dρb(z)/dz over distances greatly exceeding its boundaries. Conversion of R(Qz) to the Fresnel-normalized R(Qz)/RF(Qz) introduces no additional error given that RF(Qz) is an analytic function. Both measures are shown for the Fresnel-normalized R(Qz)/RF(Qz) in Figures 1c and 3a, since the latter data were the input for subsequent analysis. Further discussion is provided in the Supporting Information.
b) Reconstituted VSD:POPC Membrane and X-ray Interferometry
Two methods were recently described for the preparation of single membranes tethered to the surface of an inorganic substrate, the membrane comprised of a phospholipid bilayer (POPC) containing an ion channel protein (VSD) vectorially-oriented with respect to the normal to the membrane plane at high in-plane surface density [5]. The latter aspects (vectorial orientation and in-plane density) greatly facilitate the structural characterization of the membrane protein’s profile structure utilizing x-ray and neutron reflectivity techniques.
The usual method for the collection of specular X-ray reflectivity from such a substrate:bio-organic overlayer system, utlilizing a flat substrate and monochromatic x-rays, is to perform a θ-2θ scan, where θ is the angle of photon incidence with respect to the plane of the substrate’s surface possessing the overlayer and 2θ the angle of reflection with respect to the incident beam direction. High energy X-rays (e.g., >20 keV) are required to penetrate the aqueous medium fully hydrating the membrane within an electrochemical cell. The method described in a)-above for the collection of reflectivity data at different values of the transmembrane potential could also be applied in this case, cycling the potential between two values for each value of the incident photon angle, the situation being the same when using a multilayer substrate providing for interferometric enhancement of the reflectivity data. However, with monochromatic radiation, many more angles of incidence are required to span a range of momentum transfer, Qz. With the very high photon flux densities achievable with synchrotron X-ray sources, the need to vary the incident angle can be effectively circumvented by cylindrically bending the substrate:overlayer system about an axis perpendicular to the plane of reflection containing Qz. This can be accomplished in the case of interferometric enhancement by forming the inorganic multilayer, Si-Ni-Si in the work reported herein, via sputtering onto flat, ultrathin silicon, which can subsequently be cylindrically bent mechanically. A fast time-framing pixel-array detector (Dectris Pilatus Model 100K) can then be used to collect the specular reflectivity over the desired range of Qz in a single exposure with the photon beam at grazing-incidence with respect to the cylindrically-bent surface of the substrate possessing the bio-organic overlayer. The high flux density of the incident photon beam reduces the duration of a single exposure, or “time-frame”, to the sub-millisecond regime for such cylindrically-bent specimens employing an undulator source. An electrochemical cell can then be formed by bringing the cylindrically-bent overlayer into contact from above with the surface of an aqueous electrolyte medium contained within a cylindrical Kapton tube about 1 cm in diameter. The nickel layer within the substrate serves as the working electrode and a platinum wire electrode in the aqueous medium again serves as the counter electrode. We implemented this set-up on the liquid-surface spectrometer at Beamline 9-ID-C of the Advanced Photon Source, using x-rays with photon energy 22.117 keV, calibrated at the Ru K-edge. A series of 10s time-frames was collected cycling the applied potential among three values, namely 0mV, +100mV, 0mV, −100mV, 0mV, etc., repeated 10x. The data for each value of the potential were then averaged.
Two measures of the errors in the data were utilized. However, the first in this case was the standard error in the average (or mean) of the specular reflectivity <R(Qz)> at a particular value of Qz, where <R(Qz)> was calculated as the mean over repeated measurements at one value of the applied transmembrane potential. The standard error was therefore expressed as that for the mean, taking into account the number of repetitions. The second was again the point-to-point variation in R(Qz) along Qz, since these fluctuations are not physical in the sense that they would arise from correlations in the bounded gradient profile dρb(z)/dz over distances greatly exceeding its boundaries. Both measures are shown for the difference specular reflectivity data, Δ<R(Qz)> in Figure 5b, where the difference is between two values of the applied transmembrane potential. Further discussion is provided in the Supporting Information.
Error analyses utilized standard formulations [6]. All calculations were implemented via Mathematica 8 (Wolfram Research, Inc.).
Results and Discussion
a) Hybrid Bilayer and Time-Resolved Neutron Interferometry
Figure 1 shows the neutron reflectivity, and Fresnel-normalized reflectivity, from a Si-Ge-Si substrate alkylated with OTS in aqueous buffer (100mM KCl in 20mM Tris buffer at pH 7) with 90%D2O/10%H2O. In this case, there were no significant changes in the reflectivity with applied potential, here 0mV versus +100mV (the potential on the working electrode, the counter electrode at ground), over the range of Qz accessed in these first experiments. These two sets of combined data superimpose to within either measure of the errors (see Experimental Methods) over the entire range of Qz, namely for 0.01Å−1 < Qz < 0.15Å−1 as shown in Figures 1b and 1c.
Figure 1.
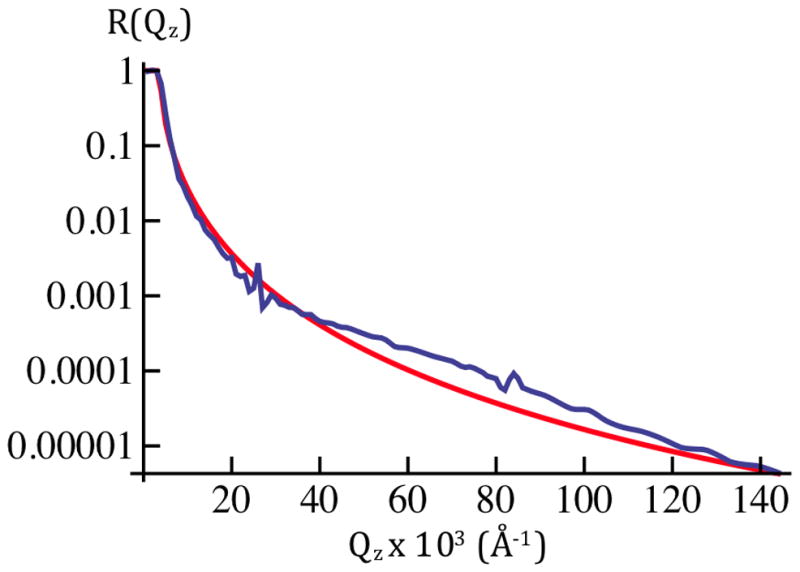
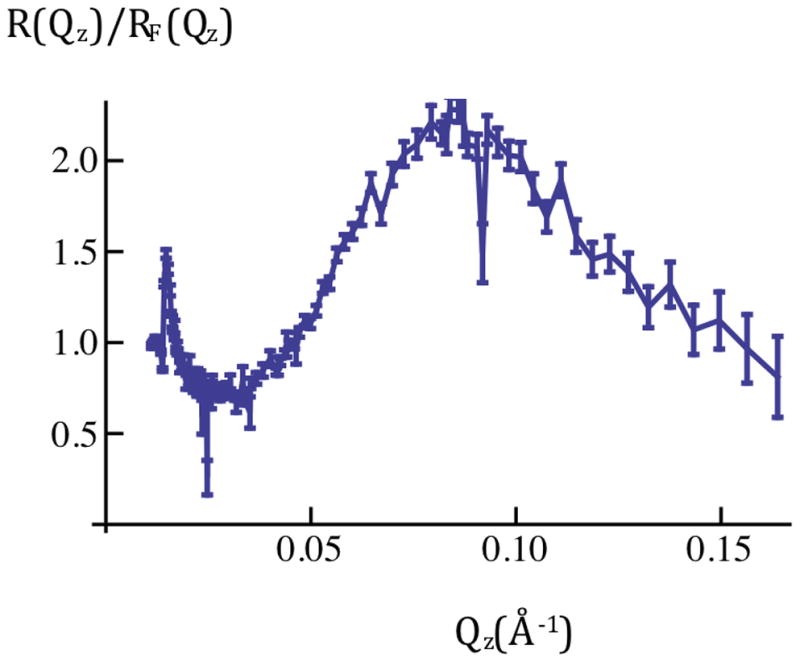
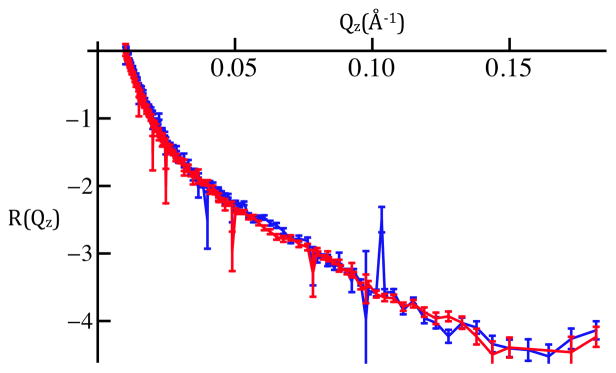
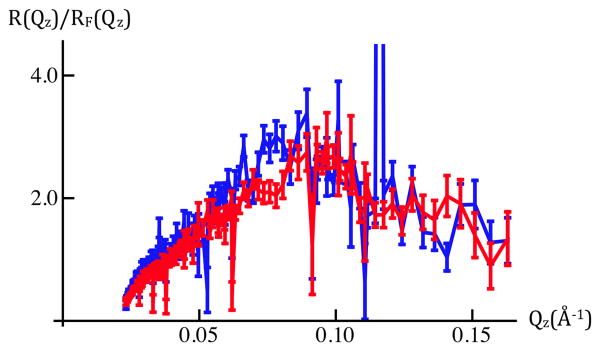
Figure 1a: Neutron reflectivity [R(Qz); left-side] and Fresnel-normalized reflectivity [R(Qz)/RF(Qz); right-side] for SiGeSi+OTS in an aqueous 90%D2O/10%H2O environment. Error bars (right-side) represent the standard error in R(Qz)/RF(Qz) (see Experimental Methods). The Fresnel reflectivity [RF(Qz)] for an ideal Si/90% D2O interface is also shown in the left panel (red).
Figure 1b: Neutron reflectivity for SiGeSi+OTS in an aqueous 90%D2O/10%H2O environment @ 0mV(red) and +100mV(blue). Error bars represent the standard error in R(Qz).
Figure 1c: Fresnel-normalized neutron reflectivity for SiGeSi+OTS in an aqueous 90%D2O/10%H2O environment @ 0mV (red) and +100mV(blue). Error bars represent the standard error in R(Qz)/RF(Qz) (see Experimental Methods). Comparison of Figures 1b and 1c indicates there are no significant potential-dependent differences evident for Qz < 0.15Å−1.
Figure 2 shows the neutron reflectivity, and Fresnel-normalized reflectivity, from a Si-Ge-Si substrate alkylated with OTS with an overlying layer of POPC, the OTS and POPC thereby comprising this “hybrid bilayer”, in the same aqueous buffer. In this case, there are significant changes evident in the reflectivity with applied potential, here for 0mV versus +100mV, over the range of Qz accessed in these first experiments, as shown in Figures 2b and 3a. The difference between these two sets of combined data exceed either measure of the errors (see Experimental Methods) within each set over a broad range of Qz, namely for 0.03Å−1 < Qz < 0.15Å−1. In addition, the fact that the combined data for each value of the potential superimpose to within either measure of these errors demonstrates the full reversibility to the changes in potential across the hybrid bilayer on the 20s time-scale. We note that although 20s time-frames were utilized in these first experiments, we can reduce their duration to ~15ms, the time-frame over which the neutrons within a single pulse reach the detector. In combination with an increase in the number of cycles by ~103, this will result in data of the same accuracy as that reported here with significantly enhanced time-resolution.
Figure 2.
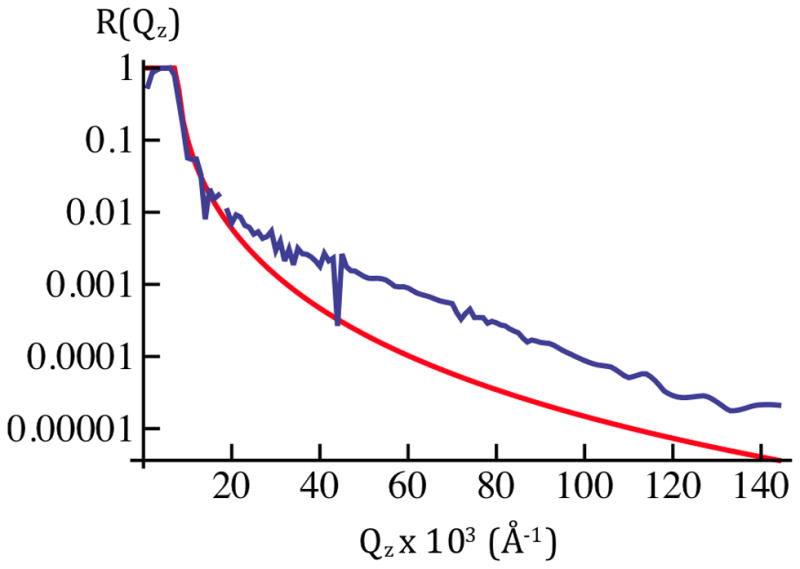
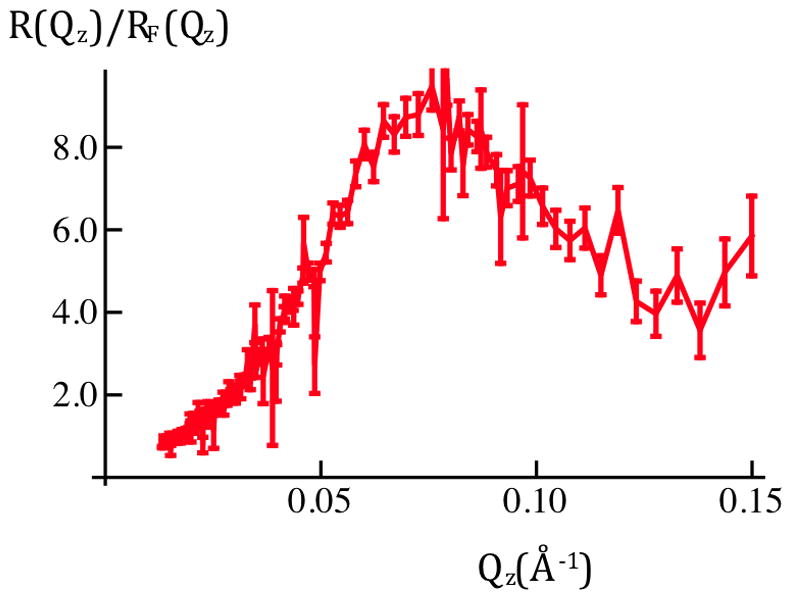
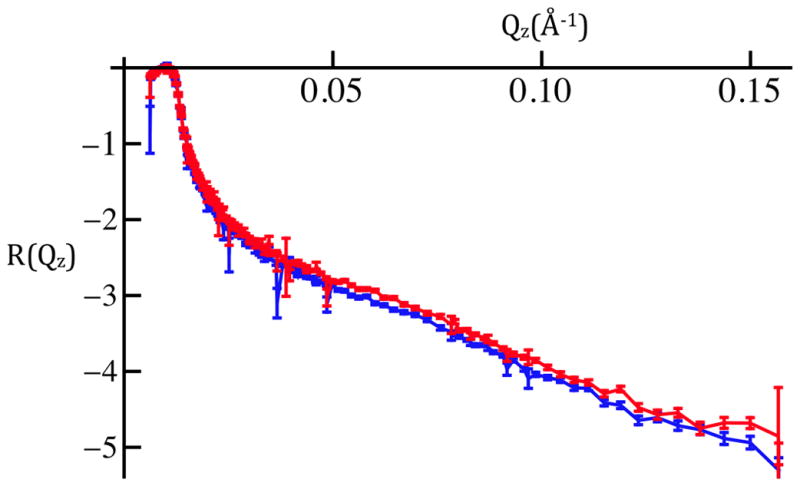
Figure 2a: Neutron reflectivity [R(Qz); left-side] and Fresnel-normalized reflectivity [R(Qz)/RF(Qz); right-side] for SiGeSi+OTS+POPC in an aqueous 90%D2O/10%H2O environment @ 0mV (Qz-scales coincide with those in1)-above for SiGeSi+OTS). Error bars (right-side) represent the standard error in R(Qz)/RF(Qz) (see Experimental Methods). The Fresnel reflectivity [RF(Qz)] for an ideal Si/90% D2O interface is also shown in the left panel (red).
Figure 2b: Neutron reflectivity for SiGeSi+OTS+POPC in an aqueous 90%D2O/10%H2O environment @ 0mV(red) & +100mV(blue). Error bars represent the standard error in R(Qz).
Figure 3.
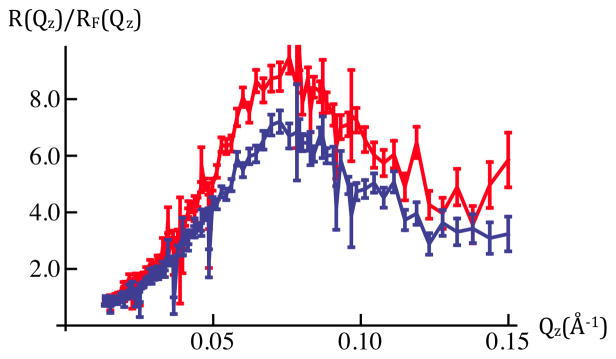
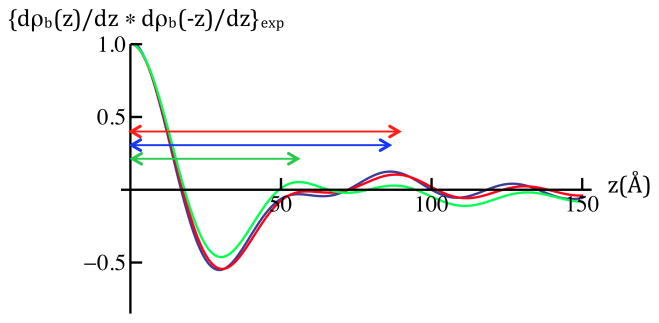
Figure 3a: Fresnel-normalized neutron reflectivity for SiGeSi+OTS+POPC in an aqueous 90%D2O/10%H2O environment @ 0mV (red) and +100mV(blue). Error bars (right-side) represent the standard error in R(Qz)/RF(Qz) (see Experimental Methods). Comparison of Figures 2b and 3a indicates there are significant potential-dependent differences evident for Qz < 0.15Å−1.
Figure 3b: Experimental autocorrelation functions of dρb(z)/dz for SiGeSi+OTS @ 0mV (green) and SiGeSi+OTS+POPC @ 0mV (red) and +100mV(blue) calculated from the Fresnel-normalized reflectivity data in Figures 3a and 2a. The longest dominant vector in the autocorrelation function for the gradient profiles for SiGeSi+OTS+POPC (see Figure 4) arises from the correlation of the Si/Ge interface furthest from the hybrid bilayer and the POPC hydrocarbon chain/polar headgroup interface for hydration with 90% D2O (horizontal arrow, red for 0mV, blue for +100mV). The maximum in the autocorrelation functions for this particular correlation occurs at z = 88.5Å for 0mV and z = 86.2Å for +100mV. For SiGeSi+OTS, the longest dominant vector arises from the correlation of the same Si/Ge interface and the OTS hydrocarbon/water interface for hydration with 90% D2O (horizontal green arrow). The maximum in the autocorrelation function for this particular correlation occurs at z = 56.3Å.
Similar changes in the X-ray reflectivity have been observed employing the same data collection scheme for the same applied potentials over a much broader (3x) range of Qz extending to 0.45Å−1 for the hybrid OTS:POPC bilayer, while no potential-dependent changes were observed for the substrate alkylated with OTS. However, these neutron reflectivity data are much more sensitive to the profile structure of the bio-organic overlayer fully-hydrated with aqueous buffer due to the much greater contrast available utilizing D2O.
Figure 3b shows the autocorrelation function of the gradient nSLD profiles [i.e., dρ(z)/dz where ρ(z) is the nSLD profile] for the Si-Ge-Si substrate alkylated with OTS and for the Si-Ge-Si substrate with the hybrid OTS:POPC tethered to its surface at 0mV versus +100mV. These autocorrelation functions show only low amplitude, high frequency oscillations for lengths exceeding the finite thickness of the gradient profile for these specimens, namely for z > 100 Å. Such oscillations represent the minimum wavelength component in the inverse Fourier transform (see Experimental Methods) arising from truncation at the maximum value of Qz accessed in these experiments [5]. The longest dominant vector in the autocorrelation function for the gradient profiles for SiGeSi+OTS+POPC (see Figure 4, upper panels) arises from the correlation of the Si/Ge interface furthest from the hybrid bilayer and the POPC hydrocarbon chain/polar headgroup interface for hydration with 90% D2O (horizontal arrow, red for 0mV, blue for +100mV). Importantly, the magnitude of this vector substantially exceeds the spatial resolution of the autocorrelation function, which is ~ 42Å (the minimum wavelength Fourier component) utilizing reflectivity data for Qz ≤ 0.15Å−1. The maximum in the autocorrelation functions for this particular correlation occurs at z = 88.5 ± 0.3Å for 0mV and z = 86.2 ± 0.2Å for +100mV. For SiGeSi+OTS, the longest dominant vector arises from the correlation of the same Si/Ge interface and the OTS hydrocarbon/water interface for hydration with 90% D2O (horizontal green arrow). The maximum in the autocorrelation function for this particular correlation occurs at z = 56.3 ± 0.2Å. [The standard errors were obtained via a nonlinear least-squares fit of a Gaussian to this maximum in the autocorrelation function.] Thus, the total thickness of the multilayer substrate possessing the hybrid bilayer on its surface is clearly thicker than that of the substrate alkylated with OTS by ~30Å. Furthermore, the total thickness of the multilayer substrate possessing the hybrid bilayer on its surface is thinner at +100mV than at 0mV by 2.3 ± 0.4Å. These differences in total thickness of the gradient profiles for the inorganic multilayer substrates possessing the bio-organic overlayer on their surface are presumably due to the thickness of only the overlayer, as described below.
Figure 4.
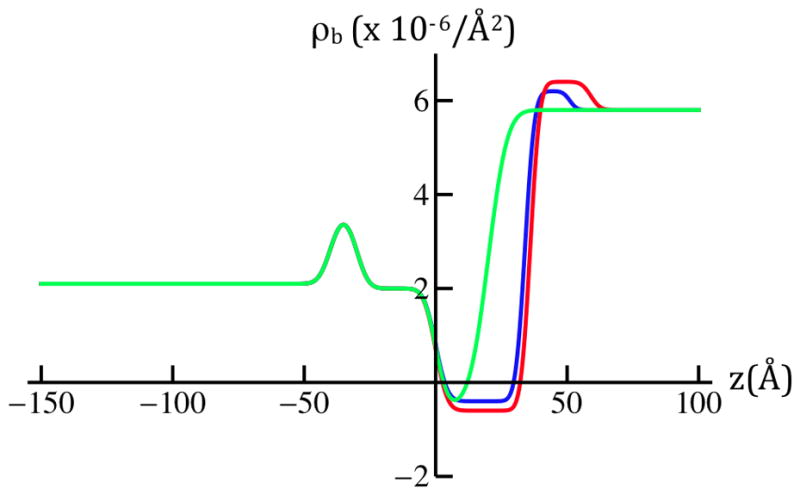
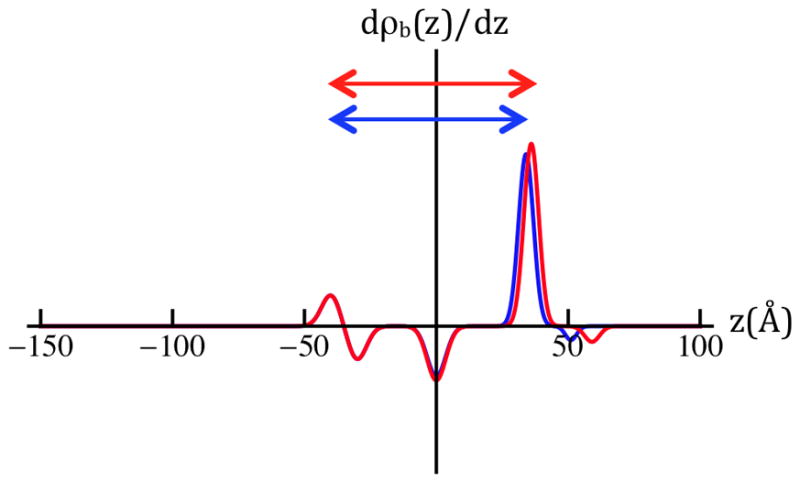
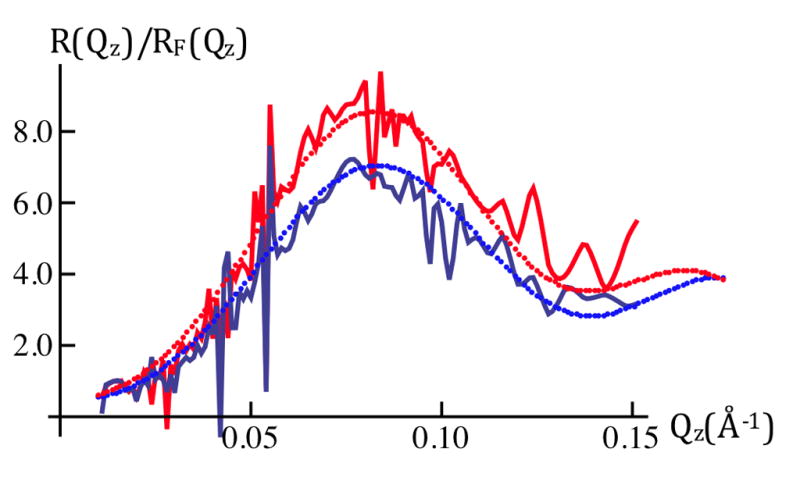
Model nSLD profiles (upper left panel) for SiGeSi+OTS@0mV (green) and for SiGeSi+OTS+POPC@0mV (red) and +100mV (blue). Their gradient profiles (upper right panel), predict both the shapes and amplitudes of their respective Fresnel-normalized reflectivity data (lower panel). The horizontal red/blue arrows (upper right panel) span the two features contributing to the longest dominant vector in the autocorrelation function for the gradient profiles, namely the correlation of the Si/Ge interface furthest from the hybrid bilayer and the POPC hydrocarbon chain/polar headgroup interface for hydration with 90% D2O at the two potentials. In the lower panel, the experimental Fresnel normalized neutron reflectivity data from Figure 3a are shown superimposed on their counterparts (dotted noiseless) for the refined models. The models fit the data very well over the range of Qz accessed, except near the larger-Qz extreme of the range, namely for Qz > 0.12Å−1 where the data exhibit the larger errors (see Figure 3a legend).
Figure 4 shows the slab-models of the nSLD profiles for the Si-Ge-Si substrate alkylated with OTS and for the Si-Ge-Si substrate with the hybrid OTS:POPC tethered to its surface at 0mV vs. +100mV. The models shown were refined primarily against the Fresnel-normalized reflectivity data shown in Figure 3a, as opposed to the experimental autocorrelation functions shown in Figure 3b, because errors in the data are more explicit. The best slab-models in Figure 4 for the hybrid OTS:POPC bilayer for the two values of the transmembrane potential each result in a calculated Fresnel-normalized reflectivity closely matching their experimental counterpart (Figure 4, lower panel). Potential-dependent differences in these best slab-models arise primarily from a reduction in the thickness of the hydrocarbon chain layer of the POPC outer half of the hybrid OTS:POPC bilayer by 2 ± 0.7Å due to the application of a transmembrane potential of +100mV. The standard error was estimated to be less than ± 0.5Å from the effect of systematic variation of only the position of the POPC hydrocarbon chain/polar headgroup interface on the calculated Fresnel-normalized reflectivity for each of the models in comparison with their experimental counterparts. Ordinarily, this error could not be estimated from the variation of a single parameter in the slab-model. However, in this case, it is sufficient (see Supporting Information: Data Analysis). This result is consistent with that from the experimental autocorrelations described in the preceding paragraph, and also by the constrained refinement analysis mentioned in the Experimental Methods, but not shown here. Additionally, the nSLD and width of the POPC headgroup are both decreased by application of +100mV.
Presumably, the electric dipole associated with the zwitterionic headgroup of the POPC molecule is responsible for this effect. Although a simple calculation might suggest that the energy of interaction of this dipole with the applied electric field should be much smaller than kT, a small domain of dipoles within the 2-D liquid phase of the POPC monolayer could increase the magnitude of the interaction [7]. For the POPC monolayer to thin locally would require the existence of such domains of sufficient size so as to avoid the energy penalty of hydrophobic mismatch [8]. Additionally, there is experimental evidence that local electric fields do indeed affect the average orientation of the headgroup dipole [9]. Further evidence for electric field induced effect observed here is being pursued via molecular dynamics simulations of the hybrid bilayer system as a function of the applied transmembrane electric potential.
b) Reconstituted VSD:POPC Membrane and Time-Resolved X-ray Interferometry
Figure 5a shows the X-ray reflectivity from a cylindrically-bent, Si-Ni-Si substrate with a reconstituted VSD:POPC membrane tethered to its surface fully-hydrated with aqueous buffer (100mM KCl in 20mM Tris buffer at pH 7) at 0mV. The data shown were obtained using a sequence of 10s time-frames for data collection and cycling the transmembrane potential between three values (0mV, +100mV, 0mV, −100mV, 0mV, etc.) ten times, followed by signal-averaging over the time-frames to provide <R(Qz)> for each of the three values of the potential. The larger amplitude data at lower Qz was attenuated with a metal foil. Careful calibration of the foil’s attenuation at the X-ray energy employed allows the attenuated lower-Qz data to be accurately scaled to the unattenuated data at higher-Qz. We have shown that the Fresnel-normalization of such specular reflectivity data (see Supporting Information: Experimental Methods) can be accurately accomplished, as necessary for subsequent analysis in the Distorted-Wave Born approximation, through division by the specular reflectivity data under otherwise similar conditions from a uniform silicon substrate cylindrically-bent to the same radius (i.e., such a procedure provides exactly the same normalized data as that collected from the membrane tethered to the surface of a flat Si-Ni-Si substrate, employing θ-2θ scans, and subsequently divided by the analytic Fresnel function for an ideal solid:liquid interface). Model calculations and experiment [5] demonstrate that the largest interference effects arising from the presence of the membrane overlayer on the surface of these particular Si-Ni-Si multilayer substrates are manifest at the maxima in these reflectivity data. It is evident that small, but fully reversible changes in excess of either measure of the errors (see Experimental Methods) occur about the larger amplitude maxima in these reflectivity data for 0.20Å−1 < Qz < 0.40Å−1 upon application the application of a transmembrane potential of +100mV in comparison to 0mV, as shown in Figure 5b. Small, fully reversible, changes also occur upon application of a transmembrane potential of −100mV in comparison to 0mV on the same basis, but these are distinctly different from those for +100mV. The reversibility aspect is assured by our data collection scheme. In addition, these changes described above for the VSD:POPC membrane are opposite to those occurring when the same potentials (i.e., ±100mV vs. 0mV) are applied to a hybrid OTS:POPC bilayer tethered to the surface of otherwise identical substrates. Thus, the changes detected for the VSD:POPC membrane in response to the applied transmembrane potential are most likely due to the presence of the VSD protein in these reconstituted membranes.
Figure 5.
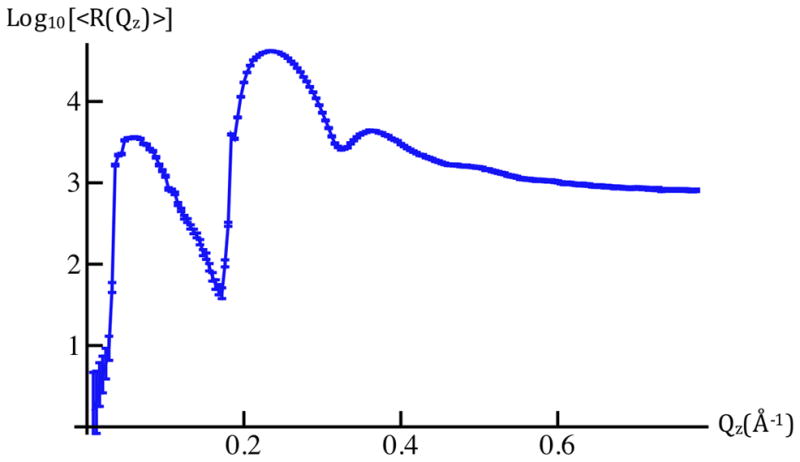
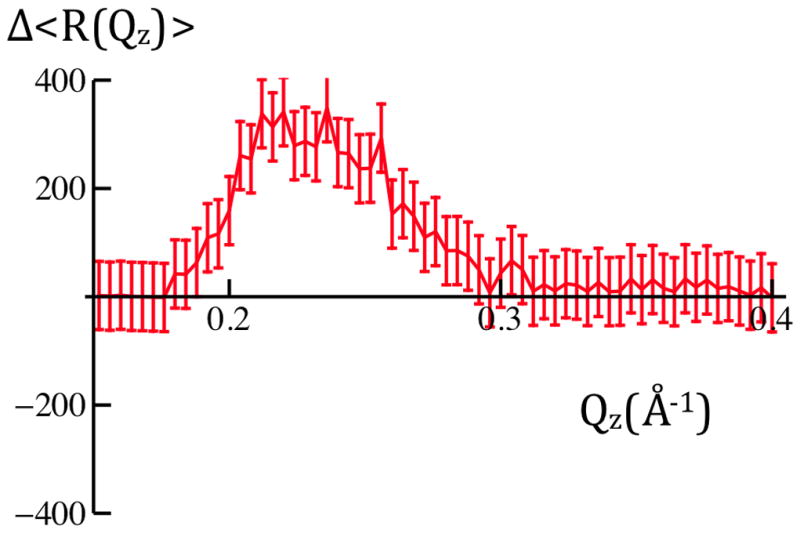
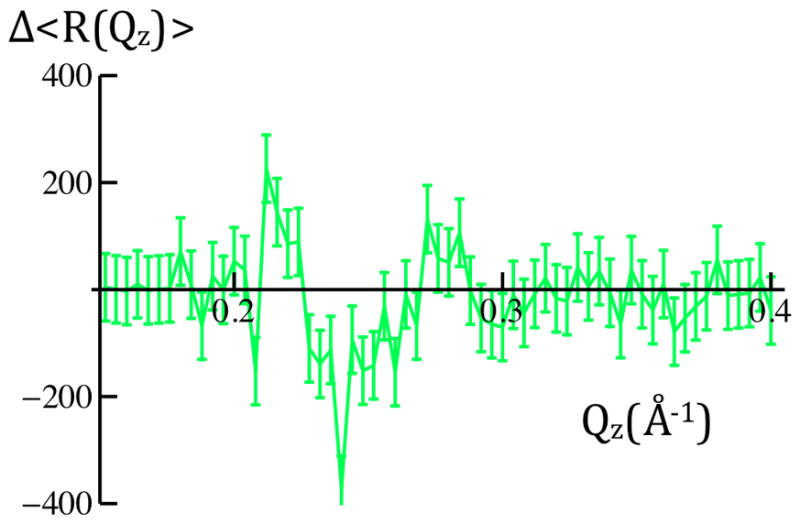
Figure 5a: The average X-ray reflectivity, shown here as Log10[<R(Qz)>], for cylindrically-bent SiNiSi+VSD:POPC in aqueous buffer @ Vm=0mV(blue). These data represent an average over ten cycles of the series of applied potentials, 0mV, +100mV, 0mV, −100mV, 0mV, etc. The larger amplitude data for Qz < 0.18Å−1 were attenuated with a calibrated metal foil. Error bars represent the standard error in Log10[<R(Qz)>].
Figure 5b: Differences of the averaged X-ray reflectivity data, Δ<R(Qz)>, for +100mV versus 0mV(green) and −100mV versus 0mV(red) are readily evident on a linear ordinate scale. Error bars represent the standard error in these difference data for 0.20Å−1 < Qz < 0.40Å−1, ranging from ± 24% for 0.20Å−1 < Qz < 0.30Å−1 to ± 34% for 0.30Å−1 < Qz < 0.40Å−1 over this interval. Given either measure of the errors (see Experimental Methods), there are significant potential-dependent differences evident for 0.20Å−1 < Qz < 0.40Å−1.
The reflectivity data in these experiments demonstrate that an unambiguous change in the profile structure of the VSD:POPC membrane occurs in response to an applied transmembrane potential of +100mV, relative to that for a potential of 0mV, the former comparable to the physiological membrane resting potential. Given the minimal POPC content of these reconstituted membranes at the mole ratio of 13 POPC:1VSD on a per monolayer basis [4a, 5], the VSD protein dominates the membrane’s profile structure. However, we have chosen not to show here our constrained refinement analysis of these data that suggest the nature of these changes in the VSD profile itself for one important reason. Namely, the electron density profiles for the VSD:POPC membrane derived from the Fresnel-normalized data can be considered only as preliminary. This is due to the fact that while the data for 0.20Å−1 < Qz < 0.40Å−1 exhibit potential-dependent changes in excess of the errors as shown in Figure 5b, this is not the case with the data for Qz < 0.18Å−1 which was attenuated substantially more than necessary due to the lack of a foil of the ideal thickness at the time of the experiments. The attenuation factor for this foil was 4,000 resulting in this less accurate data making a substantial contribution to the derived profile structure of the VSD:POPC membrane. In addition, the changes in the X-ray reflectivity data are unnecessarily small due to the excessively large electron density contrast within the SiNiSi multilayer substrate compared to that for the bio-organic overlayer in aqueous buffer. Through a redesign of the parameters of the multilayer reference structure, in terms of the thickness of the layers and their electron density contrast (e.g., using heavily-doped Si-Ge-Si instead of Si-Ni-Si serving as both the reference structure and working electrode, and layer thicknesses of 20Å instead of 50Å), we anticipate that the reflectivity from the hydrated VSD:POPC membrane at the solid:liquid interface should provide much larger amplitude contributions to the reflectivity data through interference with that from the multilayer substrate. This has been demonstrated by both model calculations and experiments with the hybrid OTS:POPC bilayer, and should provide for more accurate measurement of the changes in the reflectivity data due to changes in the applied transmembrane membrane potential. The latter is rather important, because excellent reflectivity data over a broad range of Qz can be collected from such an optimized specimen employing serial exposures of only 3ms each with the rapid-time framing pixel-array detector coupled with an undulator synchrotron X-ray source, as shown in Figure 6. The counting-statistics for these 3ms time-frames will be improved by a factor of 2-3x in the near future by the availability of such detectors with substantially increased efficiency at the higher X-ray energies required for these reflectivity measurements at the solid:liquid interface. Cycling the transmembrane potentials between two or more values over ~ 103 cycles followed by signal-averaging, as employed in this work, will then allow the time-resolution to be reduced even further reaching down to the microsecond domain. Such time-resolution is critical to investigating transitions between conformational states of membrane ion channel proteins induced by transmembrane potentials.
Figure 6.
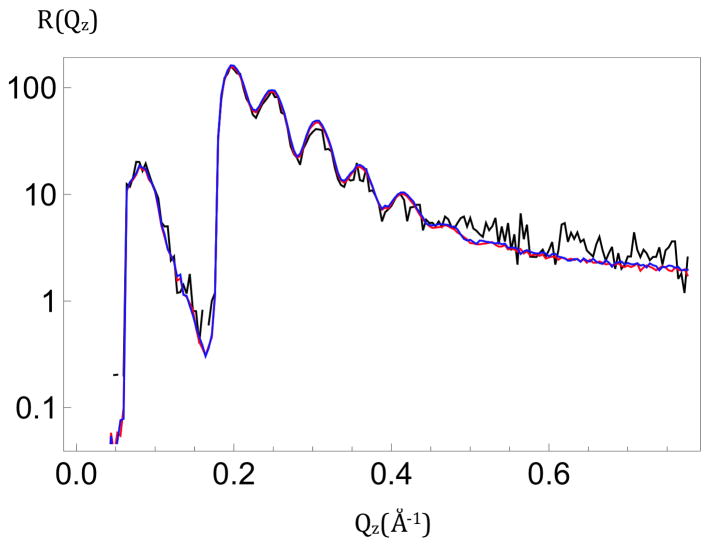
X-ray reflectivity, R(Qz), for a cylindrically-bent SiNiSi multilayer substrate in air. The 100th 3ms exposure, or “time-frame”, (black) is seen to superimpose on the average of sequential 3ms exposures numbered 1–100 (red) and 901–1,000 (blue) for Qz < 0.45Å−1. The larger amplitude data for Qz < 0.18Å−1 were attenuated with a calibrated metal foil.
Conclusions
The work presented herein represents an early stage in the development of the time-resolved approach for the investigation of membrane proteins under applied transmembrane potentials with a combination of neutron and X-ray reflectivity techniques. As usual with time-resolved studies, the level of difficulty derives from the characteristics of the available radiation sources and the detectors. For this particular scientific problem, although the physiologically relevant time-scale is relatively slow, these issues combine with the complexity of the biological system of interest and the requirement for applied electric potentials in an aqueous environment. Nevertheless, the possibilities should now be more apparent, and the recent availability of FEL sources and faster time-framing detectors should make a dramatic impact on such studies in the future, at least for the X-ray case.
Supplementary Material
Highlights.
Time-resolved (or transient) neutron/X-ray reflectivity
Neutron/X-ray reflectivity enhanced by interferometric techniques
Electric potential induced changes in a fully-hydrated hybrid lipid bilayer
Electric potential induced changes in a fully-hydrated phospholipid bilayer incorporating a vectorially-oriented voltage-sensor protein
Acknowledgments
We acknowledge C. Liu (X-ray Science Division, Argonne National Laboratory) for fabrication of the inorganic multilayer substrates, W. Pennie (Research Instrumentation Services, University of Pennsylvania) for fabrication of the electrochemical cells, R. Goyette & H. Ambaye (Spallation Neutron Source, Oak Ridge National Laboratory) for assistance with the reflectometer and data acquisition, and G. DasGupta & S.H. White (Medical School, University of California Irvine) for providing the VSD protein, and funding via the National Institutes of Health grant P01 GM86685. The Spallation Neutron Source at Oak Ridge National Laboratory is a user facility supported by the U. S. Department of Energy, Office of Basic Energy Sciences. The Advanced Photon Source at Argonne National Laboratory is also a user facility supported by the U. S. Department of Energy, Office of Basic Energy Sciences, under Contract DE-AC02-06CH11357.
Footnotes
Publisher's Disclaimer: This is a PDF file of an unedited manuscript that has been accepted for publication. As a service to our customers we are providing this early version of the manuscript. The manuscript will undergo copyediting, typesetting, and review of the resulting proof before it is published in its final citable form. Please note that during the production process errors may be discovered which could affect the content, and all legal disclaimers that apply to the journal pertain.
References
- 1.Chapman HN, et al. Nature. 2011;470:73–77. doi: 10.1038/nature09750. [DOI] [PMC free article] [PubMed] [Google Scholar]
- 2.Bezanilla F. Physiol Rev. 2000;80:555–592. doi: 10.1152/physrev.2000.80.2.555. [DOI] [PubMed] [Google Scholar]
- 3.Cornell BA, Braach-Maksvytis VLB, King LB, Osman PDJ, Raguse B, Wieczorek L, Pace RJ. Nature. 1997;387:580. doi: 10.1038/42432. [DOI] [PubMed] [Google Scholar]
- 4.Gupta S, Dura JA, Freites JA, Tobias DJ, Blasie JK. Langmuir. 2012;28:10504. doi: 10.1021/la301219z. [DOI] [PMC free article] [PubMed] [Google Scholar]
- 4.Lauter V, Ambaye H, Goyette R, Hal Lee W-T, Parizzi A. Physica B. 2009;404:2543–2546. [Google Scholar]
- 5.Gupta S, Liu J, Strzalka J, Blasie JK. Phys Rev E. 2011;84(3):031911-1-15. doi: 10.1103/PhysRevE.84.031911. [DOI] [PMC free article] [PubMed] [Google Scholar]
- 6.Shoemaker P, et al. Chapter II in Experiments in Physical Chemistry. 6. McGraw-Hill Co; 1996. [Google Scholar]
- 7.Radhakrishnan A, McConnell HM. Proc Natl Acad Sci USA. 2000;97(3):1073–1078. doi: 10.1073/pnas.97.3.1073. [DOI] [PMC free article] [PubMed] [Google Scholar]
- 8.Akimov SA, Kuzmin PI, Zimmerberg J, Cohen FS, Chizmadzhev YA. J Electroanal Chem. 2004;564:13–18. [Google Scholar]
- 9.Scherer PG, Seelig J. Biochem. 1989;28:7720–7728. doi: 10.1021/bi00445a030. [DOI] [PubMed] [Google Scholar]
Associated Data
This section collects any data citations, data availability statements, or supplementary materials included in this article.


