

Abstract
Disturbances of iron metabolism are observed in chronic liver diseases. In the present study, we examined gene expression of duodenal iron transport molecules and hepcidin in patients with hereditary hemochromatosis (HHC) (treated and untreated), involving various genotypes (genotypes which represent risk for HHC were examined), and in patients with iron deficiency anaemia (IDA). Gene expressions of DMT1, ferroportin, Dcytb, hephaestin, HFE and TFR1 were measured in duodenal biopsies using real-time PCR and Western blot. Serum hepcidin levels were measured using ELISA. DMT1, ferroportin and TFR1 mRNA levels were significantly increased in post-phlebotomized hemochromatics relative to controls. mRNAs of all tested molecules were significantly increased in patients with IDA compared to controls. The protein expression of ferroportin was increased in both groups of patients but not significantly. Spearman rank correlations showed that DMT1 versus ferroportin, Dcytb versus hephaestin and DMT1 versus TFR1 mRNAs were positively correlated regardless of the underlying cause, similarly to protein levels of ferroportin versus Dcytb and ferroportin versus hephaestin. Serum ferritin was negatively correlated with DMT1 mRNA in investigated groups of patients, except for HHC group. A decrease of serum hepcidin was observed in IDA patients, but this was not statistically significant. Our data showed that although untreated HHC patients do not have increased mRNA levels of iron transport molecules when compared to normal subjects, the expression is relatively increased in relation to body iron stores. On the other hand, post-phlebotomized HHC patients had increased DMT1 and ferroportin mRNA levels possibly due to stimulated erythropoiesis after phlebotomy.
Keywords: DMT1, ferroportin, Dcytb, hephaestin, TFR1, HFE, hepcidin, hemochromatosis, iron deficiency, gene expression
Introduction
HFE-linked hereditary hemochromatosis (HHC) is one of the most common autosomal recessive diseases among Caucasians. It occurs with a frequency of 1 in 300–400 individuals and a heterozygote carrier rate of 8–10% in populations with a northern European origin [1]. The HFE protein is one of the regulatory molecules associated with iron metabolism. Inadequate function of this protein leads to excessive absorption of iron in the duodenum resulting in serious damage to organs, e.g. liver cirrhosis, diabetes mellitus and/or cardiomyopathy. Homozygosity for the C282Y mutation (c.845G>A) in the HFE gene is present in more than 80% of hemochromatosis patients with a northern European origin [1-3]. H63D (c.187 C>G), another mutation in HFE gene, is not associated with the same level of iron loading as C282Y and is found in hemochromatosis patients especially when combined with C282Y (compound heterozygotes). However, a small number of H63D homozygote patients have been reported [1, 2, 4]. S65C (c.193 A>T), a third mutation of the HFE gene, is also occasionally found in hemochromatosis patients, although the role of this mutation is not clear.
Iron homeostasis is regulated primarily by iron absorption. The process of dietary iron absorption in the duodenum starts with reduction of ferric iron Fe3+ to the ferrous Fe2+ form, on the apical surface of enterocytes, by duodenal cytochrome b reductase (Dcytb). Ferrous iron is then transported across the membrane into the cell by an apical iron transporter – divalent metal ion transporter (DMT1). Once in the cell, iron is stored in ferritin or transferred across the basolateral membrane via ferroportin (FPN1). Ferrous iron is then oxidized to the ferric form by hephaestin (Hp), a multi-copper oxidase, before entering the circulation by binding to the transferrin [5].
HFE affects the interaction of transferrin-bound iron with transferrin receptor (TFR1) thereby modulating iron uptake. HFE interacts with TFR1 in such a way that binding of HFE to TFR1 lowers its affinity for iron-transferrin, resulting in a reduction of cellular iron uptake [6, 7]. Except of TFR1, HFE also forms complexes with TFR2 [8], which is mainly expressed in hepatocytes. The HFE/TFR2 complex is thought to serve as a body iron sensor, which regulates hepcidin expression [9].
Regulation of iron homeostasis in organisms is mainly mediated by a small 25 amino acid peptide hepcidin [10, 11], which is, mostly, synthesized in the liver. Hepcidin appears to act by binding to and internalization of ferroportin and its subsequent degradation [12, 13] which results in reduced iron efflux from enterocytes. It has also been shown that, in intestinal cells, hepcidin mediates a transcriptional response resulting in decreased duodenal DMT1 expression and decreased apical iron uptake [14, 15].
There have been relatively few human's studies with regard to the expression of duodenal iron transport molecules associated with iron overload (hemochromatosis) or iron deficiency, and the studies that have been done, produced conflicting results [16-22]. Moreover, these studies usually focused on mRNA levels only, with hepcidin not being measured.
The aim of the present study was to examine the expression profile of duodenal iron transport molecules on both mRNA and protein levels and to investigate how expression is influenced by hepcidin. Furthermore, we analysed the relationship among expressions of these iron transport molecules and indices of iron metabolism. This study was conducted in patients with HHC (treated and untreated) with different genotypes (only genotypes which represent a risk for hemochromatosis were examined), in patients with iron deficiency anaemia, and control subjects.
Materials and methods
Patients
The study included 60 individuals (31 male, 29 female), mean age of 54.3 years, ranging from 25 to 82 years. Patients were recruited at our out-patient department between 2005 and 2009. Hemochromatosis (HHC) patients (N = 14) were diagnosed on the basis of risk genotype (C282Y homozygosity, C282Y/H63D compound heterozygosity and H63D homozygosity) and persistently raised iron indices, defined as serum ferritin > 250 μg l−1 for male patients and serum ferritin > 200 μg l−1 for female patients or transferrin saturation > 45%. The untreated HHC group (N = 5) had duodenal biopsies taken prior to phlebotomy treatment. Porphyria cutanea tarda was diagnosed in one HHC patient. Patients with iron deficiency anaemia (IDA) (N = 16) were defined as those with a serum ferritin < 20 μg l−1, low haemoglobin (men < 13 g dl−1 and women < 11.5 g dl−1) and transferrin saturation (<16%). The control group (N = 30) had upper GI endoscopy, as part of the evaluation of their dyspeptic symptoms, and presented with iron parameters that were within normal range (serum iron 11–26 μmol l−1, serum ferritin male 30–250 μg l−1, female 30–200 μg l−1, transferrin saturation 20–45%). DNA for HFE genotyping was available in 10 controls, 16 IDA and 13 HHC patients. C282Y, H63D and S65C mutations of the HFE gene were analysed using the PCR-RFLP method, as described previously [23]. Informed consent was obtained from all patients and the study was approved by the Ethics Committee of the Third Faculty of Medicine and conducted in accordance with the Helsinki Convention.
Sample collection
Duodenal biopsy samples were obtained from 60 individuals during gastrointestinal endoscopy. For mRNA analysis, samples were stored in RNAlater (Sigma-Aldrich, St. Louis, MO, USA) at −20°C and for protein analysis, samples were stored at −80°C.
Quantitative (real-time) polymerase chain reaction
Total RNA was extracted from RNAlater stored duodenal biopsy samples using a RNAeasy MiniKit with DNase treatment (Qiagen, Hilden, Germany) following the manufacturer's instructions. After estimation of RNA integrity, using gel electrophoresis, and determination of concentration of each sample, two samples were found to be insufficient for further analysis. Next, total RNA was reverse transcribed in an 80 μl reaction using a reverse transcription kit TaqMan Reverse Transcription Reagents (Applied Biosystems, Foster City, CA, USA) with random primers; the procedure followed the manufacturer's instructions. Transcribed cDNA was subjected to real-time quantitative PCR in an ABI Prism 7000 Sequence Detection System (Applied Biosystems) using commercially available kit Taq Man Universal PCR Master Mix (Applied Biosystems) for DMT1 (IRE variants), FPN1, TFR1, HFE and GAPDH. Sybr green PCR Master Mix (Applied Biosystems) was used for detection of Dcytb and Hp. Primers and probes were designed intron spanning to avoid co-amplification of genomic DNA. Amplification of DMT1, Dcytb and Hp cDNA was completed following the previously described techniques [21, 24]. For the amplification of FPN1, TFR1, HFE and GAPDH, Applied Biosystems pre-designed gene expression assays were used. The part numbers for the assays were as follows: FPN1 – Hs00205888_m1, TFR1 – Hs00174609_m1, HFE – Hs00373474_m1, GAPDH – Hs99999905_m1. Amplification conditions were identical for all analysed molecules. Initial denaturation at 50°C for 2 min. and then 95°C for 10 min. was followed by 40 amplification cycles at 95°C for 15 sec. and 60°C for 1 min. Each sample was examined in triplicate. All data were normalized to the amount of GAPDH cDNA in the sample. The 2−ΔΔCT method was used to calculate relative changes in gene expression.
Western blot analysis
Due to a limited amount of biological material, Western blot analyses were performed only on duodenal iron transporters and coupled oxido-reductases (DMT1, FPN1, Dcytb, Hp). After protein extraction from duodenal biopsy samples using RIPA buffer (Sigma-Aldrich) and determination of concentration (Thermo Scientific Pierce BCA Protein Assay Kit; Thermo Fisher Scientific Inc., Rockford, IL, USA), six samples were found to be insufficient for further analysis by Western blot. Due to the small amount of tissue obtained from three of the biopsies, only Hp and DMT1 could be evaluated in these samples.
Western blot analysis of DMT1 (IRE variants), Dcytb, FPN1, Hp and actin (loading control) levels was carried out with some modifications as described, in detail, previously [25]. Proteins separated by SDS-PAGE were blotted onto a 0.2 μm nitrocellulose membrane for 2 hrs at 0.25 A using a MiniProtean II blotting apparatus (Bio-Rad, Hercules, CA, USA). The membrane was blocked in 5% BSA in TBS (100 mM Tris-HCl, 150 mM NaCl, pH 7.5) for 25 min. (DMT1), 40 min. (ferroportin), 60 min. (Dcytb), 45 min. (Hp) or in 5% non-fat milk in TBS for 20 min. (actin). A solution of 0.1% Tween-20/TBS was used for washing. Washed membranes were incubated with the relevant primary antibody. Goat polyclonal antibodies NRAMP 2 (N-20) and Hephaestin (N-20) against human DMT1 and Hp from Santa Cruz Biotechnology (Santa Cruz, CA, USA), goat polyclonal anti-Cytochrome b reductase 1 antibody (EB06633) against human Dcytb (Everest Biotech, Upper Heyford, UK), rabbit polyclonal antibody MTP11-A against human ferroportin from Alpha Diagnostic International (San Antonio, TX, USA) and mouse monoclonal antibody (A3853) against human actin (Sigma-Aldrich) were used. After incubation (overnight, 4°C), the washed membrane was incubated for 1 hr with corresponding horseradish peroxidase-conjugated secondary antibody. Antibodies were diluted in 5% BSA (non-fat milk)/0.1% Tween-20/TBS. The horseradish peroxidase-conjugated secondary antibody was detected by enhanced chemiluminescence using Supersignal reagent from Pierce (Rockford, IL, USA) and a LAS 1000 CCD (Fuji). Band intensities were quantified by densitometry and the data were analysed with the use of ImageJ software (version 1.42q; NIH, USA, available on http://rsb.info.nih.gov/ij/).
ELISA
Serum for hepcidin measurement was available in 30 patients. Bioactive hepcidin was measured in serum samples of 8 controls, 13 IDA and 9 HHC patients using a newly developed commercial kit enzyme-linked immunosorbent assay (ELISA) specific for the mature peptide (EIA-4705) (DRG International Inc., NJ, USA) according the manufacturer's instructions. In both patients and controls, blood samples were drawn between 7.30 and 8.30 a.m. after overnight fasting.
Statistical analysis
Data are expressed as mean ± S.E.M. Comparison of the data between groups was performed using the ANOVA and LSD test. When the variables were not normally distributed, the Mann-Whitney test or the Kruskal-Wallis test followed by multiple comparison tests, were used as appropriate. Correlation was assessed using the Spearman rank method. Statistical analysis was done using the Statistica program (version 9; StatSoft, Tulsa, OK, USA) and the GraphPad Prism program (version 5.00; GraphPad Software, Inc., San Diego, CA, USA). The significance level was set at 0.05.
Results
Clinical and laboratory characteristics of patients
Clinical characteristics and laboratory parameters of each patient group (HHC treated and untreated, IDA, controls) are shown in Table 1. As for the HFE gene analysis, in the HHC group, eight patients were C282Y homozygotes, four patients were compound heterozygotes C282Y/H63D and one patient was an H63D homozygote. In the IDA group, two patients were H63D heterozygotes and one was an H63D homozygote. Analysed control subjects were wild type for all three tested mutations.
Table 1.
Clinical characteristics and iron phenotype in patient groups
| HHC | HHC | HHC | |||
|---|---|---|---|---|---|
| Variable | Control | IDA | Total | Treated | Untreated |
| N = 30 | N = 16 | N = 14 | N = 9 | N = 5 | |
| Age [yrs] | 57.40 | 51.69 | 50.71 | 54.22 | 44.40 |
| μ2.85 | ±4.32 | μ3.69 | μ4.97 | μ4.43 | |
| Gender [M/F] | 18/12 | 1/15*** | 12/2 | 4/1 | 8/1 |
| Serum iron | 17.55 | 3.18 | 28.77 | 23.73 | 28.77 |
| [μmol l–1] | μ0.67 | ±0.34*** | ±3.82* | μ4.59 | ±3.82*** |
| Serum ferritin | 151.00 | 16.43 | 1075.00 | 923.10 | 1349.00 |
| [μg l−1] | μ13.83 | ±4.52*** | μ433.90* | μ638.20 | ±467.00*** |
| Transferrin | 31.22 | 6.24 | 57.46 | 44.81 | 95.40 |
| Saturation [%] | μ0.96 | ±1.28*** | μ10.32 | μ10.69 | ±3.14** |
| ALT | 0.54 | 0.36 | 0.91 | 0.93 | 0.87 |
| [μkat l–1] | μ0.05 | ±0.05* | ±0.15** | ±0.20* | μ0.25 |
| AST | 0.47 | 0.36 | 0.69 | 0.73 | 0.62 |
| [μkat l–1] | μ0.03 | ±0.04* | ±0.10* | ±0.15 | ±0.08* |
| Hb | 14.00 | 8.38 | 14.63 | 14.41 | 15.02 |
| [g dl–1] | μ0.31 | ±0.31*** | μ0.40 | ±0.47 | ±0.77 |
| Ht | 41.48 | 27.06 | 42.78 | 42.01 | 44.16 |
| [%] | μ0.93 | ±0.93*** | μ1.15 | μ1.33 | ±2.21 |
Data are presented as arithmetic mean ± S.E.M. ALT: alanine aminotransferase (EC 2.6.1.2); AST: aspartate aminotransferase (EC 2.6.1.1); Hb: haemoglobin; Ht: hematocrit. Normal ranges: serum iron (11–26 μmol l−1), serum ferritin (male 30–250 μg l−1, female 30–200 μg l−1), transferrin saturation 20–45%, ALT (0.1–0.75 μkat l−1); AST (0.1–0.75 μkat l−1), Hb (male 13.0–18.0 g dl−1, female 11.5–16.0 g dl−1), Ht (male 38–54%, female 35–47%). Statistical significant differences as compared with the control group are indicated by *P < 0.05, **P < 0.01, ***P < 0.001.
RNA expression
The gene expression at the mRNA level was measured in DMT1, FPN1, Dcytb, Hp, TFR1 and HFE. DMT1 qPCR was performed on the DMT1(IRE) transcripts, because these splice variants are the isoforms that respond to variations in cell iron content [26]. Because the IRE and non-IRE sequences are localized in last exons, we could not further distinguish between 1A and 1B variants, which vary in first exons. The 1A isoform of DMT1 mRNA is most actively expressed in duodenal and kidney cells and also participates in iron regulation, whereas the 1B isoform has broad distribution, which correlates with the role of DMT1 in the release of iron from endosome. Anyway, both of these mRNA variants are expressed in the proximal duodenum, where systemic iron absorption is regulated [26].
There was a significant difference in the expression of all analysed molecules across groups at the mRNA level (Kruskal-Wallis test). Further examination of the data using multiple comparison tests found a significant increase in the expression of all analysed molecules in IDA patients when compared to controls: DMT1 (5.36-fold, P= 0.0003), FPN1 (2.58-fold, P < 0.0001), Dcytb (1.39-fold, P= 0.0019), Hp (1.34-fold, P= 0.0175), TFR1 (2.41-fold, P= 0.0002), HFE (1.28-fold, P= 0.0052). When the HHC group and controls were analysed, no significant difference in the expression of any molecules was detected, although DMT1, FPN1 and TFR1 mRNA were increased in HHC group (3.30-fold, P= 0.5514, 1.48-fold, P= 0.4815, 1.62-fold, P= 0.5740, respectively) (Fig. 1A).
Fig 1.
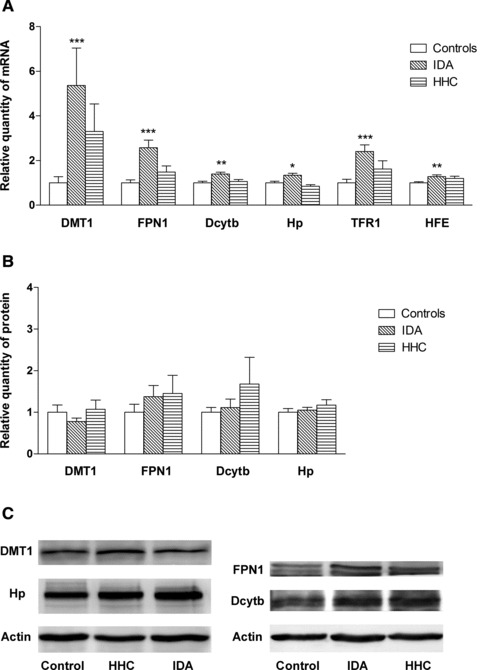
Gene expression of the analysed molecules in controls, iron deficiency anaemia and hemochromatosis patients. (A) mRNA expression of DMT1, FPN1, Dcytb, Hp, TFR1, HFE. (B) Protein expression of DMT1, FPN1, Dcytb, Hp. (C) Western blot analysis of DMT1, FPN1, Dcytb, Hp and actin (loading control). Results are depicted as means ± S.E.M. Statistical significant differences as compared with the control group are indicated by *P < 0.05, **P < 0.01, ***P < 0.001.
To evaluate the situation in the HHC group, we divided the HHC group into untreated (N = 5) and treated (N = 9) patients. A significant increase of DMT1 and TFR1 mRNA expression was observed in the treated HHC patients compared to untreated patients (5.14 versus 0.36, P= 0.0451, 2.23 versus 0.65, P= 0.0451, respectively). Although FPN1 gene expression had the same pattern as DMT1, the increase did not reach statistical significance. However, when treated patients were compared to controls, higher levels of DMT1, TFR1 and also FPN1 mRNA were observed (5.14-fold, P= 0.0115, 2.23-fold, P= 0.0115, 1.90-fold, P= 0.0484, respectively) (Fig. 2A). To investigate the effect of different HFE genotypes, representing the risk for hemochromatosis, the HHC group was divided according to genotype, i.e. C282Y/C282Y, C282Y/H63D and H63D/H63D. However, no significant changes in the expression levels were found among C282Y/C282Y, C282Y/H63D and H63D/H63D individuals.
Fig 2.
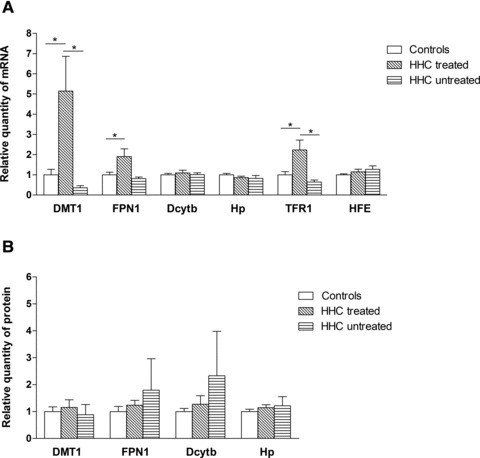
Gene expression of the analysed molecules in controls, treated and untreated HHC patients. (A) mRNA expression of DMT1, FPN1, Dcytb, Hp, TFR1, HFE. (B) Protein expression of DMT1, FPN1, Dcytb, Hp. Results are depicted as means ± S.E.M. Statistical significant differences are indicated by *P < 0.05, **P < 0.01, ***P < 0.001.
Protein expression
To investigate whether the changes in mRNA expression translated into changes in protein content, we examined DMT1, FPN1, Dcytb and Hp protein levels using Western blotting. No statistically significant differences in expression of any molecule were found across the studied groups of patients. Even though the FPN1 protein level was increased in both groups of patients, this increase did not reach statistical significance when compared to controls: IDA (1.37-fold, P= 1.000), HHC (1.45-fold, P= 1.000) (Fig. 1B).
When the situation in the HHC group was analysed, no differences between treated and untreated patients were found (Fig. 2B). Further analysis of hemochromatosis patients, studying the role of different genotypes, detected no changes in gene expression in C282Y or H63D homozygotes, or C282Y/H63D compound heterozygotes.
Relationship among gene expressions of tested molecules
The association among Dcytb, Hp, DMT1, FPN1, TFR1 and HFE gene expressions was investigated using the Spearman rank correlation. When all individuals were analysed together, there was a positive relationship among mRNA expressions of all tested molecules except between HFE versus DMT1, and HFE versus Hp. The strongest correlations were found between DMT1 versus FPN1 (r = 0.849, P < 0.0001), between Dcytb versus Hp (r = 0.733, P < 0.0001) and between DMT1 versus TFR1 (r = 0.746, P < 0.0001) (Table 2). When gene expression on the protein level was studied, a positive relationship between the following genes was found: Dcytb versus Hp (r = 0.434, P= 0.0015), Dcytb versus FPN1 (r = 0.681, P < 0.0001), DMT1 versus Hp (r = 0.378, P= 0.0053) and FPN1 versus Hp (r = 0.457, P= 0.0007) (Table 3).
Table 2.
Associations among gene expression of analysed molecules on mRNA level
| mRNA | HFE | TFR1 | FPN1 | DMT1 | Hp | |
|---|---|---|---|---|---|---|
| Dcytb | HHC total | 0.071 | 0.495 | 0.648* | 0.374 | 0.631* |
| HHC treated | −0.333 | 0.476 | 0.619 | 0.286 | 0.619 | |
| HHC untreated | 0.400 | 0.600 | 0.700 | 0.000 | 0.800 | |
| IDA | 0.341 | 0.209 | 0.394 | 0.324 | 0.670** | |
| Controls | 0.319 | 0.365 | 0.364** | 0.186 | 0.790*** | |
| All | 0.375** | 0.574*** | 0.650*** | 0.458*** | 0.733*** | |
| Hp | HHC total | 0.178 | 0.587* | 0.505 | 0.335 | |
| HHC treated | −0.452 | 0.762* | 0.524 | 0.381 | ||
| HHC untreated | 0.600 | 0.400 | 0.700 | 0.200 | ||
| IDA | −0.147 | 0.068 | 0.132 | 0.153 | ||
| Controls | 0.414* | 0.330 | 0.593*** | 0.149 | ||
| All | 0.256 | 0.462*** | 0.564*** | 0.343** | ||
| DMT1 | HHC total | −0.220 | 0.637* | 0.846*** | ||
| HHC treated | −0.595 | 0.381 | 0.810* | |||
| HHC untreated | 0.600 | 0.400 | 0.300 | |||
| IDA | −0.035 | 0.620* | 0.794*** | |||
| Controls | 0.250 | 0.634*** | 0.683*** | |||
| All | 0.218 | 0.746*** | 0.849*** | |||
| FPN1 | HHC total | −0.341 | 0.551 | |||
| HHC treated | −0.595 | 0.333 | ||||
| HHC untreated | 0.100 | 0.100 | ||||
| IDA | 0.003 | 0.841*** | ||||
| Controls | 0.367 | 0.523** | ||||
| All | 0.270* | 0.716*** | ||||
| TFR1 | HHC total | −0.044 | ||||
| HHC treated | −0.191 | |||||
| HHC untreated | 0.800 | |||||
| IDA | −0.147 | |||||
| Controls | 0.604*** | |||||
| All | 0.408** |
Spearman rank correlation, statistical significant differences are indicated by *P < 0.05, **P < 0.01, ***P < 0.001.
Table 3.
Associations among gene expression of analysed molecules on protein level
| Proteins | FPN1 | DMT1 | Hp | |
|---|---|---|---|---|
| Dcytb | HHC total | 0.648* | 0.119 | 0.533 |
| HHC treated | 0.262 | −0.262 | 0.024 | |
| HHC untreated | 0.700 | 0.800 | 0.900 | |
| IDA | 0.814*** | −0.521* | 0.379 | |
| Controls | 0.601** | 0.213 | 0.360 | |
| All | 0.681*** | 0.003 | 0.434** | |
| Hp | HHC total | 0.302 | 0.593* | |
| HHC treated | −0.619 | 0.583 | ||
| HHC untreated | 0.900 | 1.000 | ||
| IDA | 0.243 | −0.043 | ||
| Controls | 0.580** | 0.490* | ||
| All | 0.457*** | 0.378** | ||
| DMT1 | HHC total | 0.014 | ||
| HHC treated | −0.691 | |||
| HHC untreated | 0.800 | |||
| IDA | −0.154 | |||
| Controls | 0.176 | |||
| All | 0.018 |
Spearman rank correlation, statistical significant differences are indicated by *P < 0.05, **P < 0.01, ***P < 0.001.
mRNA level and protein level correlated with each other in DMT1 (r = 0.334, P= 0.0167) and Hp (r = 0.302, P= 0.0299) when all groups were analysed together.
When correlations in HHC, IDA and controls were investigated separately, positive relationships were found, as summarized in Tables 2 and 3. The strongest correlations at the mRNA level were found between DMT1 versus FPN1, Dcytb versus Hp and DMT1 versus TFR1 in all groups. With respect to protein expression, the strongest correlations were detected between Dcytb versus FPN1 (Tables 2 and 3). To evaluate the effect of the phlebotomy treatment the data were analysed separately for HHC subgroups (treated and untreated patients). However, the correlations found in HHC group were lost in HHC subgroups very probably because of the small sample size in these subgroups (treated HHC patients N = 9, untreated HHC patients N = 5) (Tables 2 and 3).
Relationship among gene expressions of tested molecules and iron parameters
We also investigated the relationship between gene expression of analysed molecules and serum iron parameters. When all patients, regardless of the underlying disease, were examined, negative correlations were found between serum ferritin and mRNA of Hp (r =−0.646, P < 0.0001), FPN1 (r =−0.636, P < 0.0001), DMT1 (r =−0.609, P < 0.0001), TFR1 (r =−0.530, P= 0.0005) and Dcytb (r =−0.466, P= 0.0028). Serum iron correlated at the mRNA level with FPN1 (r =−0.405, P= 0.0105) and Hp (r =−0.402, P= 0.0112). The same applies to correlations between transferrin saturation and the mRNA of FPN1 (r =−0.534, P= 0.0008), Hp (r =−0.429, P= 0.0091), TFR1 (r =−0.420, P= 0.0106), Dcytb (r =−0.380, P= 0.0221), and DMT1 (r =−0.369, P= 0.0267). There was no correlation between HFE mRNA and any of the tested iron parameters. When protein expression was examined in the cohort of all patients, no correlation was found between any protein and any iron parameter.
With respect to HHC, no inverse relationship between any of the tested molecules at the mRNA or protein level and serum ferritin or serum iron or transferrin saturation was detectable except for a positive correlation between HFE mRNA and transferrin saturation (r = 0.690, P= 0.0186). When the IDA group was studied separately serum ferritin correlated with Dcytb mRNA (r =−0.533, P= 0.0405), DMT1 mRNA (r =−0.587, P= 0.0213) and DMT1 protein (r =−0.586, P= 0.0276). Transferrin saturation correlated with Dcytb protein (r =−0.785, P= 0.0005) and FPN1 protein (r =−0.745, P= 0.0014) in the IDA group. Among controls, we found an inverse relationship between serum ferritin and DMT1 mRNA expression (r =−0.772, P= 0.0053) and FPN1 and Dcytb protein expression (r =−0.766, P= 0.0159, r =−0.700, P= 0.0358, respectively). Serum iron correlated with DMT1 protein expression (r =−0.641, P= 0.0182), and transferrin saturation with DMT1 protein expression (r =−0.910, P= 0.0017) in controls.
Transferrin saturation and serum ferritin, serum iron and serum ferritin, and serum iron and transferrin saturation were positively correlated with each other in all subjects (r = 0.827, r = 0.799, r = 0.938, respectively, P < 0.0001 for all comparisons listed).
Hepcidin analysis
To get more insight into the regulation of iron absorption, the relationship between serum hepcidin and the expression of the analysed molecules was studied as well. Sera for hepcidin measurements were available in 30 individuals. A decrease in hepcidin levels was observed in IDA patients compared to controls, but this was not statistically significant (30.65 ng ml−1versus 36.93 ng ml−1, P= 0.2935). The same applies to comparison of HHC patients to controls (34.26 ng ml−1versus 36.93 ng ml−1, P= 0.7360). When the situation in the HHC group was analysed, no differences between treated and untreated patients or patients with different genotypes were found. The relationship between serum hepcidin level and the gene expression, at both the mRNA or protein level, was analysed but with the exception of HFE mRNA (r =−0.524, P= 0.0036) no correlation was found. In addition, hepcidin levels did not correlate with any of measured iron parameter regardless of study group. Nevertheless, the small sample size does not permit to rule out definitely a possibility of serum hepcidin decrease in hemochromatics and IDA patients or correlations of serum hepcidin with gene expressions or iron indices. The gender distribution (see Table 1) may be another confounding factor.
Discussion
In this study, the gene expression of DMT1, FPN1, Dcytb and Hp at both the mRNA and protein levels were investigated in duodenal biopsy samples. In addition, the expression of HFE and TFR1 was examined at the mRNA level. To get a complete view of iron transport in duodenum, the role of serum hepcidin was studied as well. The study was conducted on a cohort of treated and untreated HHC patients with different genotypes, which represent a risk for hemochromatosis (C282Y/C282Y, C282Y/H63D and H63D/H63D), patients with iron deficiency anaemia, and controls. The current study is, to our knowledge, the first to investigate duodenal gene expression of iron transport molecules at both the mRNA and protein level, together with serum hepcidin levels among the above mentioned groups of patients.
Previously published reports on duodenal expression of iron transporters in HHC subjects have found mixed results [16-22]. Some authors reported major increases in the gene expression of DMT1 and FPN1 compared to controls, whereas other authors found no increase in the expression of these molecules. However, earlier studies did not distinguish between treated and untreated HHC patients. In our HHC patients, there were no significant differences in gene expression at the mRNA and protein levels when compared to controls. A significant increase of DMT1, FPN1 and TFR1 mRNA was, however, detected in the subgroup of treated HHC patients. Similar observations were documented in some previous studies [17, 18, 20] but not others [19, 21, 22]. Although the expression of iron transport genes was not different from controls in untreated HHC subjects, it seems to be inappropriately high relative to the degree of body iron overload. Some authors have suggested that hemochromatics initially load iron in similar amounts as seen in iron deficiency and when the body iron stores increase to some limit, the stores regulator (now recognized as hepcidin) is stimulated to down-regulate iron loading [17]. In post-phlebotomized subjects, the increased level of DMT1 and FPN1 could be explained by the fact that duodenal iron uptake is increased in response to increased erythropoiesis after phlebotomy. Duodenal enterocytes behave as if iron deficient, which can manifest as increased transferrin receptor mRNA expression in these patients. As others have found [16, 18, 20], Hp and Dcytb were not up-regulated in HHC patients, regardless of therapy, and do not seem to play a significant role in the increase of iron absorption observed in HHC patients.
HHC patients with different genotypes (C282Y/C282Y, C282Y/H63D and H63D/H63D) express different severities of clinical signs of the disease [27]. Our goal was to examine the effect of different genotypes on expression levels of iron transport genes. Variable expression could explain different levels of iron absorption resulting in different degrees of iron accumulation. However, when the effect of these genotypes in HHC patients was studied, no significant differences in gene expression at the mRNA or protein or hepcidin levels were observed. Yet, the small size of the HHC genotype groups does not permit definite conclusions in this respect.
In agreement with previous studies [17, 20–22, 28] our patients with iron deficient anaemia showed significantly increased mRNA gene expression of all tested molecules (DMT1, FPN1, Dcytb, Hp, TFR1). This probably represents a compensatory mechanism to increase iron absorption in response to the body need for iron. The minor increase in the HFE expression, seen in these patients, supports the idea that the major site of HFE action is in the liver. The crypt cell hypothesis proposed that HFE acts as a regulator of iron homeostasis by sensing the amount of body iron on the basolateral membrane of enterocytes in conjunction with TFR1 [29]. However, with the discovery of hepcidin, the liver is now thought to be a centre for iron regulation and the HFE/TFR2 complex is supposed to transmit the signal to induce hepcidin expression [8, 9].
In our study, only the unchanged expression of mRNA (in untreated HHC patients) was paralleled by the same pattern at the protein level, whereas significant increases of DMT1 and FPN1 at the mRNA level, seen in IDA and treated HHC patients, was not followed by significant increase at the protein level, although some elevation of FPN1 was detected. In contrast to our findings, some studies have shown, using Western blot and immunohistochemistry, that differences in DMT1 [17] and FPN1 [21] mRNA expression are reflected by corresponding changes in the expression of the respective proteins. However, in a later study by this group on Dcytb and Hp [22], the mRNA did not correspond to the respective proteins. A similar incongruence between mRNA gene expression of duodenal iron transport genes and the respective proteins was seen in our previous study, which used cell lines [30]. Of note, all the above-mentioned molecules have IRE (iron responsive element) sequences. DMT1 and TFR1 (which was increased as well) bear an IRE within its 3′UTR and are stabilized upon IRP (iron regulatory protein) binding, whereas in ferroportin, this sequence is localized in its 5′UTR and IRP binding inhibits translation. It was shown using animal models that specific intestinal depletion of IRP1 and IRP2 decreases DMT1 and increases FPN1, resulting in the death of the duodenal cells [31]. This demonstrates the important role of the IRP/IRE system in post-transcriptional regulatory mechanisms of DMT1 and FPN1. Therefore, although hepcidin is considered a major regulatory molecule of DMT1 and FPN1 gene expression, the IRE/IRP mechanism probably acts as a fine tuner, which modulates the expression of these proteins. In addition, decreased protein stability under specific conditions in particular patients (e.g. degree of iron overload, presence of possible genetic modifiers) must be considered. Recently, Ndfips adaptor proteins, in association with ubiquitin ligase WWP2, were shown to enhance ubiquitination and subsequent degradation of DMT1, thus reducing the amount of DMT1 protein [32]. Nevertheless, to date, the majority of gene expression human studies of duodenal iron transporters have focused on the mRNA level only [16, 18–20, 28]. This inconsistency between mRNA and protein expression emphasizes the importance of complex analyses of both mRNA and protein, through which post-transcriptional regulatory mechanisms can be found.
Similar to previous studies, we observed a strong positive correlation between DMT1 and FPN1, Dcytb and Hp, DMT1 and TFR1 at the mRNA level in all studied groups suggesting coordinated regulation of these genes. It seems that this integral regulation is also retained in HHC individuals and is not disturbed by HFE gene mutations.
Results obtained from studies examining the relationship between duodenal iron transporters and iron metabolism parameters are inconsistent. In the present study there were significant inverse correlations between mRNA expression of some duodenal iron transporters and iron indices. The relationship between DMT1 mRNA and serum ferritin in controls and IDA patients suggests that body iron stores play a role in the regulation of duodenal expression of this transporter. Nevertheless, this correlation was not found in HHC patients. This lack of correlation may be due to a disturbance in iron homeostatic signalling in HHC patients, probably via alteration of HFE function, which normally forms the HFE/TFR2 iron sensing complex involved in the hepcidin regulatory pathway [9]. Our observations are in agreement with some studies [16-18].
To get more insight into the regulation of iron metabolism, we measured bioactive hepcidin in patients’ sera. Hepcidin is now recognized as the key regulator of iron metabolism. It was found to be up-regulated by iron overload and down-regulated by iron deficiency [36-38] and IDA patients and is inversely correlated with duodenal FPN1 and DMT1 expression in animal models [39]. On the other hand, in a study by Gehrke et al. [40], liver hepcidin expression was not significantly decreased in hemochromatosis patients. In our current study, while serum hepcidin in IDA patients was decreased in comparison to controls, this difference did not reach statistical significance. Moreover, no decrease in hepcidin was detected in HHC patients when compared to controls, even when divided into treated and untreated groups. Another unexpected observation was that the hepcidin level did not negatively correlate with FPN1 or DMT1 gene expression (at the mRNA or protein level) and iron indices. Frazer et al. [33] made similar observations. In their study there was no correlation between serum hepcidin concentrations and serum ferritin, soluble transferrin receptors, or haemoglobin concentrations, all of which are commonly used markers of iron status [33]. The failure to demonstrate an association between hepcidin levels and increased FPN1 and DMT1 expression in our HHC and IDA patients may be due to the small sample of patients and their diversity (i.e. varying degree of iron overload and genetic background). Moreover, data regarding hepcidin in relationship to duodenal transport molecules usually come from mRNA levels in the liver; whereas we determined hepcidin protein levels from serum. It is known that hepcidin can also be regulated at the post-translational level, during hepcidin maturation, which occurs via furin convertase [41]. In addition, α2-macroglobulin was recently identified as a specific hepcidin-binding molecule. A complex of α2-macroglobulin and hepcidin could influence the determination of hepcidin during diagnostic testing [42].
In conclusion, the results of the current study indicate that duodenal mRNA expression of DMT1, FPN1 and TFR1 is increased in post-phlebotomized HHC patients. This elevation was not observed in untreated HHC patients, although their mRNA expression of iron transport molecules was relatively increased in relation to body iron stores. The different genotypes, representing risk for HHC, do not seem to influence the expression of duodenal iron transport molecules. Serum hepcidin was not decreased in our HHC patients. Our observations show that mRNA and protein expression of duodenal iron transport molecules do not always correlate with each other; therefore it is necessary to assess protein levels in such studies as well. Observed positive correlations among Dcytb, Hp, DMT1, FPN1 and TFR1 mRNA indicate the presence of coordinated regulation of these genes. Further studies are needed to elucidate the complex system of pathogenesis of iron homeostasis in iron metabolism diseases.
Acknowledgments
This work was supported by a research goal of the Charles University – Third Faculty of Medicine No. MSM 0021620814 (‘Prevention, diagnostics and therapy of diabetes mellitus, metabolic and endocrine damage of organisms’) and by grant 260705/SVV/2010. We thank Dr. Pokorna and Dr. Jungwirthova for performing biopsies in five patients and Thomas Secrest for the English language revision of the manuscript.
Author contributions
M. Dostalikova-Cimburova, K. Kratka, J. Kovar and J. Horak designed the research study; M. Dostalikova-Cimburova, K. Balusikova, J. Chmelikova and J. Neubauerova performed the research (performed molecular analyses); K. Kratka, V. Hejda and J. Hnanicek performed the research (examined patients, collected the clinical data and biological material); M. Dostalikova-Cimburova and J. Vranova analysed the data; M. Dostalikova-Cimburova wrote the paper; K. Kratka, K. Balusikova, J. Chmelikova, V. Hejda, J. Hnanicek, J. Neubauerova, J. Vranova, J. Kovar and J. Horak critically revised the manuscript.
Conflict of interest
The authors confirm that there are no conflicts of interest.
References
- 1.Merryweather-Clarke AT, Pointon JJ, Jouanolle AM, et al. Geography of HFE C282Y and H63D mutations. Genet Test. 2000;4:183–98. doi: 10.1089/10906570050114902. [DOI] [PubMed] [Google Scholar]
- 2.Beutler E, Felitti V, Gelbart T, et al. Genetics of iron storage and hemochromatosis. Drug Metab Dispos. 2001;29:495–9. [PubMed] [Google Scholar]
- 3.Feder JN, Gnirke A, Thomas W, et al. A novel MHC class I-like gene is mutated in patients with hereditary haemochromatosis. Nat Genet. 1996;13:399–408. doi: 10.1038/ng0896-399. [DOI] [PubMed] [Google Scholar]
- 4.Samarasena J, Winsor W, Lush R, et al. Individuals homozygous for the H63D mutation have significantly elevated iron indexes. Dig Dis Sci. 2006;51:803–7. doi: 10.1007/s10620-006-3210-3. [DOI] [PubMed] [Google Scholar]
- 5.Donovan A, Roy CN, Andrews NC. The ins and outs of iron homeostasis. Physiology (Bethesda) 2006;21:115–23. doi: 10.1152/physiol.00052.2005. [DOI] [PubMed] [Google Scholar]
- 6.Feder JN, Penny DM, Irrinki A, et al. The hemochromatosis gene product complexes with the transferrin receptor and lowers its affinity for ligand binding. Proc Natl Acad Sci USA. 1998;95:1472–7. doi: 10.1073/pnas.95.4.1472. [DOI] [PMC free article] [PubMed] [Google Scholar]
- 7.Parkkila S, Waheed A, Britton RS, et al. Association of the transferrin receptor in human placenta with HFE, the protein defective in hereditary hemochromatosis. Proc Natl Acad Sci USA. 1997;94:13198–202. doi: 10.1073/pnas.94.24.13198. [DOI] [PMC free article] [PubMed] [Google Scholar]
- 8.Goswami T, Andrews NC. Hereditary hemochromatosis protein, HFE, interaction with transferrin receptor 2 suggests a molecular mechanism for mammalian iron sensing. J Biol Chem. 2006;281:28494–8. doi: 10.1074/jbc.C600197200. [DOI] [PubMed] [Google Scholar]
- 9.Gao J, Chen J, Kramer M, et al. Interaction of the hereditary hemochromatosis protein HFE with transferrin receptor 2 is required for transferrin-induced hepcidin expression. Cell Metab. 2009;9:217–27. doi: 10.1016/j.cmet.2009.01.010. [DOI] [PMC free article] [PubMed] [Google Scholar]
- 10.Ganz T. Hepcidin in iron metabolism. Curr Opin Hematol. 2004;11:251–4. doi: 10.1097/00062752-200407000-00004. [DOI] [PubMed] [Google Scholar]
- 11.Nicolas G, Chauvet C, Viatte L, et al. The gene encoding the iron regulatory peptide hepcidin is regulated by anemia, hypoxia, and inflammation. J Clin Invest. 2002;110:1037–44. doi: 10.1172/JCI15686. [DOI] [PMC free article] [PubMed] [Google Scholar]
- 12.Nemeth E, Tuttle MS, Powelson J, et al. Hepcidin regulates cellular iron efflux by binding to ferroportin and inducing its internalization. Science. 2004;306:2090–3. doi: 10.1126/science.1104742. [DOI] [PubMed] [Google Scholar]
- 13.Nemeth E, Ganz T. Regulation of iron metabolism by hepcidin. Annu Rev Nutr. 2006;26:323–42. doi: 10.1146/annurev.nutr.26.061505.111303. [DOI] [PubMed] [Google Scholar]
- 14.Mena NP, Esparza A, Tapia V, et al. Hepcidin inhibits apical iron uptake in intestinal cells. Am J Physiol Gastrointest Liver Physiol. 2008;294:G192–8. doi: 10.1152/ajpgi.00122.2007. [DOI] [PubMed] [Google Scholar]
- 15.Millard KN, Frazer DM, Wilkins SJ, et al. Changes in the expression of intestinal iron transport and hepatic regulatory molecules explain the enhanced iron absorption associated with pregnancy in the rat. Gut. 2004;53:655–60. doi: 10.1136/gut.2003.031153. [DOI] [PMC free article] [PubMed] [Google Scholar]
- 16.Gleeson F, Ryan E, Barrett S, et al. Duodenal Dcytb and hephaestin mRNA expression are not significantly modulated by variations in body iron homeostasis. Blood Cells Mol Dis. 2005;35:303–8. doi: 10.1016/j.bcmd.2005.06.005. [DOI] [PubMed] [Google Scholar]
- 17.Kelleher T, Ryan E, Barrett S, et al. Increased DMT1 but not IREG1 or HFE mRNA following iron depletion therapy in hereditary haemochromatosis. Gut. 2004;53:1174–9. doi: 10.1136/gut.2003.033811. [DOI] [PMC free article] [PubMed] [Google Scholar]
- 18.Nelson JE, Mugford VR, Kilcourse E, et al. Relationship between gene expression of duodenal iron transporters and iron stores in hemochromatosis subjects. Am J Physiol Gastrointest Liver Physiol. 2010;298:G57–62. doi: 10.1152/ajpgi.00175.2009. [DOI] [PMC free article] [PubMed] [Google Scholar]
- 19.Rolfs A, Bonkovsky HL, Kohlroser JG, et al. Intestinal expression of genes involved in iron absorption in humans. Am J Physiol Gastrointest Liver Physiol. 2002;282:G598–607. doi: 10.1152/ajpgi.00371.2001. [DOI] [PubMed] [Google Scholar]
- 20.Stuart KA, Anderson GJ, Frazer DM, et al. Duodenal expression of iron transport molecules in untreated haemochromatosis subjects. Gut. 2003;52:953–9. doi: 10.1136/gut.52.7.953. [DOI] [PMC free article] [PubMed] [Google Scholar]
- 21.Zoller H, Koch RO, Theurl I, et al. Expression of the duodenal iron transporters divalent-metal transporter 1 and ferroportin 1 in iron deficiency and iron overload. Gastroenterology. 2001;120:1412–9. doi: 10.1053/gast.2001.24033. [DOI] [PubMed] [Google Scholar]
- 22.Zoller H, Theurl I, Koch RO, et al. Duodenal cytochrome b and hephaestin expression in patients with iron deficiency and hemochromatosis. Gastroenterology. 2003;125:746–54. doi: 10.1016/s0016-5085(03)01063-1. [DOI] [PubMed] [Google Scholar]
- 23.Cimburova M, Putova I, Provaznikova H, et al. S65C and other mutations in the haemochromatosis gene in the Czech population. Folia Biol (Praha) 2005;51:172–6. [PubMed] [Google Scholar]
- 24.Kovar J, Neubauerova J, Cimburova M, et al. Stimulation of non-transferrin iron uptake by iron deprivation in K562 cells. Blood Cells Mol Dis. 2006;37:95–9. doi: 10.1016/j.bcmd.2006.06.004. [DOI] [PubMed] [Google Scholar]
- 25.Truksa J, Kovar J, Valenta T, et al. Iron deprivation induces apoptosis independently of p53 in human and murine tumour cells. Cell Prolif. 2003;36:199–213. doi: 10.1046/j.1365-2184.2003.00280.x. [DOI] [PMC free article] [PubMed] [Google Scholar]
- 26.Hubert N, Hentze MW. Previously uncharacterized isoforms of divalent metal transporter (DMT)-1: implications for regulation and cellular function. Proc Natl Acad Sci USA. 2002;99:12345–50. doi: 10.1073/pnas.192423399. [DOI] [PMC free article] [PubMed] [Google Scholar]
- 27.King C, Barton DE. Best practice guidelines for the molecular genetic diagnosis of Type 1 (HFE-related) hereditary haemochromatosis. BMC Med Genet. 2006;7:81. doi: 10.1186/1471-2350-7-81. [DOI] [PMC free article] [PubMed] [Google Scholar]
- 28.Stuart KA, Anderson GJ, Frazer DM, et al. Increased duodenal expression of divalent metal transporter 1 and iron-regulated gene 1 in cirrhosis. Hepatology. 2004;39:492–9. doi: 10.1002/hep.20038. [DOI] [PubMed] [Google Scholar]
- 29.Philpott CC. Molecular aspects of iron absorption: insights into the role of HFE in hemochromatosis. Hepatology. 2002;35:993–1001. doi: 10.1053/jhep.2002.33466. [DOI] [PubMed] [Google Scholar]
- 30.Balusikova K, Neubauerova J, Dostalikova-Cimburova M, et al. Differing expression of genes involved in non-transferrin iron transport across plasma membrane in various cell types under iron deficiency and excess. Mol Cell Biochem. 2009;321:123–33. doi: 10.1007/s11010-008-9926-y. [DOI] [PubMed] [Google Scholar]
- 31.Galy B, Ferring-Appel D, Kaden S, et al. Iron regulatory proteins are essential for intestinal function and control key iron absorption molecules in the duodenum. Cell Metab. 2008;7:79–85. doi: 10.1016/j.cmet.2007.10.006. [DOI] [PubMed] [Google Scholar]
- 32.Foot NJ, Dalton HE, Shearwin-Whyatt LM, et al. Regulation of the divalent metal ion transporter DMT1 and iron homeostasis by a ubiquitin-dependent mechanism involving Ndfips and WWP2. Blood. 2008;112:4268–75. doi: 10.1182/blood-2008-04-150953. [DOI] [PubMed] [Google Scholar]
- 33.Frazer DM, Wilkins SJ, Becker EM, et al. Hepcidin expression inversely correlates with the expression of duodenal iron transporters and iron absorption in rats. Gastroenterology. 2002;123:835–44. doi: 10.1053/gast.2002.35353. [DOI] [PubMed] [Google Scholar]
- 34.Nicolas G, Bennoun M, Devaux I, et al. Lack of hepcidin gene expression and severe tissue iron overload in upstream stimulatory factor 2 (USF2) knockout mice. Proc Natl Acad Sci USA. 2001;98:8780–5. doi: 10.1073/pnas.151179498. [DOI] [PMC free article] [PubMed] [Google Scholar]
- 35.Pigeon C, Ilyin G, Courselaud B, et al. A new mouse liver-specific gene, encoding a protein homologous to human antimicrobial peptide hepcidin, is overexpressed during iron overload. J Biol Chem. 2001;276:7811–9. doi: 10.1074/jbc.M008923200. [DOI] [PubMed] [Google Scholar]
- 36.Bridle KR, Frazer DM, Wilkins SJ, et al. Disrupted hepcidin regulation in HFE-associated haemochromatosis and the liver as a regulator of body iron homoeostasis. Lancet. 2003;361:669–73. doi: 10.1016/S0140-6736(03)12602-5. [DOI] [PubMed] [Google Scholar]
- 37.Kemna EH, Tjalsma H, Podust VN, et al. Mass spectrometry-based hepcidin measurements in serum and urine: analytical aspects and clinical implications. Clin Chem. 2007;53:620–8. doi: 10.1373/clinchem.2006.079186. [DOI] [PubMed] [Google Scholar]
- 38.Nemeth E, Roetto A, Garozzo G, et al. Hepcidin is decreased in TFR2 hemochromatosis. Blood. 2005;105:1803–6. doi: 10.1182/blood-2004-08-3042. [DOI] [PubMed] [Google Scholar]
- 39.Theurl I, Aigner E, Theurl M, et al. Regulation of iron homeostasis in anemia of chronic disease and iron deficiency anemia: diagnostic and therapeutic implications. Blood. 2009;113:5277–86. doi: 10.1182/blood-2008-12-195651. [DOI] [PubMed] [Google Scholar]
- 40.Gehrke SG, Kulaksiz H, Herrmann T, et al. Expression of hepcidin in hereditary hemochromatosis: evidence for a regulation in response to the serum transferrin saturation and to non-transferrin-bound iron. Blood. 2003;102:371–6. doi: 10.1182/blood-2002-11-3610. [DOI] [PubMed] [Google Scholar]
- 41.Valore EV, Ganz T. Posttranslational processing of hepcidin in human hepatocytes is mediated by the prohormone convertase furin. Blood Cells Mol Dis. 2008;40:132–8. doi: 10.1016/j.bcmd.2007.07.009. [DOI] [PMC free article] [PubMed] [Google Scholar]
- 42.Peslova G, Petrak J, Kuzelova K, et al. Hepcidin, the hormone of iron metabolism, is bound specifically to alpha-2-macroglobulin in blood. Blood. 2009;113:6225–36. doi: 10.1182/blood-2009-01-201590. [DOI] [PubMed] [Google Scholar]