

Abstract
Myelocytomatosis oncogene (c-MYC) is a well-known nuclear oncoprotein having multiple functions in cell proliferation, apoptosis and cellular transformation. Chromosomal modification is also important to the differentiation and growth of stem cells. Histone deacethylase (HDAC) and polycomb group (PcG) family genes are well-known chromosomal modification genes. The aim of this study was to elucidate the role of c-MYC in the expression of chromosomal modification via the HDAC family genes in human mesenchymal stem cells (hMSCs). To achieve this goal, c-MYC expression was modified by gene knockdown and overexpression via lentivirus vector. Using the modified c-MYC expression, our study was focused on cell proliferation, differentiation and cell cycle. Furthermore, the relationship of c-MYC with HDAC2 and PcG genes was also examined. The cell proliferation and differentiation were checked and shown to be dramatically decreased in c-MYC knocked-down human umbilical cord blood-derived MSCs, whereas they were increased in c-MYC overexpressing cells. Similarly, RT-PCR and Western blotting results revealed that HDAC2 expression was decreased in c-MYC knocked-down and increased in c-MYC overexpressing hMSCs. Database indicates presence of c-MYC binding motif in HDAC2 promoter region, which was confirmed by chromatin immunoprecipitation assay. The influence of c-MYC and HDAC2 on PcG expression was confirmed. This might indicate the regulatory role of c-MYC over HDAC2 and PcG genes. c-MYCs’ regulatory role over HDAC2 was also confirmed in human adipose tissue-derived MSCs and bone-marrow derived MSCs. From this finding, it can be concluded that c-MYC plays a vital role in cell proliferation and differentiation via chromosomal modification.
Keywords: c-MYC, HDAC2, PcG, hMSCs, stem cell, proliferation, differentiation
Introduction
Stem cells, characterized by the ability to both self-renew and differentiate into various functional cell types, have been derived from the embryo and various sources of post-natal animals [1]. Mesenchymal stem cells (MSCs) are promising tools for regenerative medicine. MSCs have been isolated from bone marrow, adipose tissue, peripheral blood, foetal liver, lung, amniotic fluid, chorionic villi of the placenta and umbilical cord blood [2–7]. These cells can be differentiated into fibroblasts, adipocytes, osteoblasts, chondrocytes [8], tendinocytes, ligamentocytes [9], cardiomyocytes [10], neuronal cell [11, 12] and other cells [13].
Myc is a transcription factor of the basic helix-loop-helix-leucine zipper family that can activate or repress gene expression. The c-MYC proto-oncogene has emerged as a critical regulator of cell growth and is one of the genes most frequently altered in cancer [14]. Myc has generally been associated with the promotion of cellular growth and proliferation, desensitization to growth-inhibitory stimuli, blockade of cell differentiation, cellular immortalization and oncogenic transformation [15]. The biochemical mechanism of Myc-mediated trans-activation has revealed a wide range of effects on chromatin and basal transcription [16]. MYC proteins are also required for the widespread maintenance of active chromatin [17]. The activation of c-MYC in ESCs induces apoptosis and differentiation into extraembryonic endoderm and trophectoderm lineages while concomitantly reducing expression of POU domain, class5, transcription factor 1 (OCT4) and Nanog homeobox (NANOG) [18]. Myc can positively regulate proliferation in normal cells and cause genomic instability in tumours by controlling DNA replication [19]. However, c-MYC expression does not regulated by RNA exonuclease 1 (REX1), which is critical in proliferation/differentiation of stem cells [20]. The permanent and stable human MSC (hMSC) line generated by transfecting the v-myc gene can be differentiated into neural cell types, including neural stem cells, neurons, astrocytes and oligodendrocytes [21]. Overexpression of c-MYC strongly drives proliferation and growth but also sensitizes cells to apoptosis and senescence [22]. MYC suppresses expression of cell cycle/growth arrest genes gas1, p15, p21, p27 and others, directly, by at least two mechanisms [23]. Decreased c-Myc binding to Sp1 transcriptional complexes in the p21 promoter results in reduced p21 repression [24].
Mammalian histone deacethylases (HDACs) comprise a multiprotein family of zinc metallohydrolases that share a conserved catalytic centre. There are four classes of HDACs in mammals: class I consists of proteins homologous to yeast Rpd3 (e.g. HDAC1, 2, 3 and 8); class II (HDAC 4–7, 9 and 10) consists of proteins homologous to yeast Hda1; class III consists of the homologues of Sir2 in the yeast S. cerevisiae and class IV consists of HDAC11 [25]. HDACs exist in multiprotein complexes with transcription factors, DNA binding proteins and other chromatin modifying enzymes. Deacetylation of histones reseals the chromosomal package, leading to a repression of transcription [26]. Class I HDACs 1, 2 and 3 interact with components of the p53 and RB tumour-suppressor pathways [27, 28], suggesting their direct involvement in growth suppression. The overexpression of class I HDACs is well correlated with cancer tissues including stomach, oesophagus, colon, prostate, breast, ovary, lung, pancreas and thyroid [29]. Increased HDAC2 expression is associated with colon cancer depending on the Wnt pathway and c-Myc [30]. The activity of HDAC 1, 2 and 3 inhibits differentiation of ESCs to oligodendrocyte, astrocytes and neurons, respectively [31]. The treatment of HDAC inhibitor suppresses c-MYC expression [32].
The polycomb group (PcG) genes were initially identified as regulators of homeotic genes, master developmental regulators that participate in defining the blueprint for Drosophila’s body plan. The identification of similar PcG genes and numerous paralogs in vertebrates raised the intriguing possibility that they may perform similar functions. In vertebrates, PcG proteins assemble into two discrete chromatin-associated complexes, which have been recently characterized [33–35]. In human beings, the first complex, referred to as polycomb repressive complex 1 (PRC1), includes at least one paralog of the polycomb group ring fingers (PCGFs), ring finger protein (RING)1, RING2, polyhomeotic-likes (PHCs) and chromobox homologs (CBXs) components, whereas the second complex, named polycomb repressive complex 2 (PRC2), which includes embryonic ectoderm development protein (EED), enhancer of zeste homologs (EZHs) and suppressor of zeste 12 (SUZ12). YIN YANG (YY)1, YY2 and sex comb on midleg-like-1 (SCML1) are PcG members which are not included in PRC1 and PRC2 groups. PcG genes are also implicated in regulation of stem cell self-renewal and in cancer development [36]. Myc-induced chromatin modifications play a major role in Myc-induced exit from the epidermal stem cell niche [37]. c-MYC is structurally related to two other genes, l- and n-MYC, the expression of which has not been investigated in MSCs. The function of c-MYC has been extensively investigated in cancer cells but not in human adult stem cells, even though they have relatively high expression compared with normal cells and ESCs.
In this study, we suggested that c-MYC could regulate cell proliferation positively and differentiation negatively, not only by direct regulation of cell cycle regulating genes, but also by regulating chromosomal modification genes in human adult stem cells. To test this hypothesis, the transcriptional and translational changes of chromosomal modifying genes, controlled by c-MYC expression, were investigated using gene knockdown and overexpression techniques mediated by a lentiviral vector system in human umbilical cord blood-derived MSCs (hUCB-MSCs), human adipose tissue-derived MSCs (hAD-MSCs) and bone-marrow derived MSCs (hBM-MSCs).
Materials and methods
hMSC isolation and culture and fluorescence-activated cell sorting (FACS) analysis
hUCB-MSCs, hBM-MSCs and hAD-MSCs were isolated and cultured as previously described [38–40]. In brief, two clones of hAD-MSCs were isolated from freshly excised mammary fat tissue acquired from the Ba-Ram plastic surgery hospital. Tissues were obtained from 20- to 30-year-old women during reduction mammoplasty. The hAD-MSCs were maintained in keratinocyte-serum free medium (K-SFM), supplemented with 5% foetal bovine serum (FBS), 2 mM N-acetyl-L-cysteine (Sigma-Aldrich, St. Louis, MO, USA) and L-ascorbic acid (0.2 mM; Sigma-Aldrich). hBM-MSCs were isolated from three healthy donors and were cultured in low glucose DMEM supplemented with 10% FBS without any additional growth factors. hUCB-MSCs were obtained from umbilical cord blood immediately after full term delivery with written consent from 20- to 30-year-old mothers and the approval of the Boramae Hospital Institutional Review Board. The hUCB-MSCs were maintained in DMEM (Invitrogen, Carlsbad, CA, USA) containing 10% FBS. The passages (p) of hMSCs used for the experiments were p5 in hUCB-MSCs, p5 in hAD-MSCs and p3 in hBM-MSCs. The isolation and research use of hAD-MSCs and hBM-MSCs were also approved by the Boramae Hospital Institutional Review Board with written consent. All procedures were approved by the institutional review board of Seoul National University (UCB-MSC, #0603/001–002; AD-MSC, #0600/001–001; BM-MSC, #0910/001–003). To analyse cell surface marker expression in hUCB-MSCs, FACS Aria was used (Becton & Dickinson, Franklin Lakes, NJ, USA). Antibodies were conjugated to CD29-phycoerythrin (PE), CD31-PE, CD33-PE, CD34-fluorescein isothiocyanate (FITC), CD44-PE, CD45-FITC, CD73-PE, CD90-PE, CD105-FITC, CD133-PE and a major histocompatibility complex, MHC class II, cell surface receptor-FITC (HLA-DR-FITC) (Abcam, Cambridge, UK).
Gene construction and production of lentivirus vectors
The lentivirus was generated using the ViraPower™ Lentiviral Packaging Mix (Invitrogen). Lipofectamine 2000 (Invitrogen) was used for transfection of small hairpin RNA of c-MYC (ShM1, TRCN0000039641; ShM3, TRC0000039640) and vector control (SHC002) (Sigma-Aldrich) to 293FT cells (Invitrogen). Cell culture medium was changed the day after transfection and the supernatant was harvested at 48 and 72 hrs after transfection. The viral supernatant was filtered using 0.4 μm pore filters (Invitrogen). Cells were transfected with lentivirus at a multiplicity of infection of 10. Polybrene (Sigma-Aldrich) was added to the cell culture media at a final concentration of 6 μg/ml. The cell culture medium was changed with fresh culture medium the day after transfection. For selection, puromycin was added to the cell culture medium at a final concentration of 10 μg/ml for 3 days. The full coding region of c-MYC was cloned into the pLenti6/V5-D-TOPO vector (Invitrogen) and the lentivirus was made using the same protocol as in the inhibition study for c-MYC overexpression. For selection, blasticidine was added to the cell culture media at a final concentration of 5 μg/ml for 5 days.
Small interfering RNA (siRNA) transfection
Chemically synthesized siRNA of HDAC2 (cat. # L-003495–00) and vehicle control non-targeting RNA (cat. # D-001210–05) were purchased from Dharmacon RNA Technologies (Lafayette, CO, USA). Transfections were performed according to the manufacturer’s instruction. In brief, cells were maintained in a culture dish at a confluence of 40–50%. Transfection complexes were prepared in serum and antibiotic-free medium and 20 nM siHDAC2 was used for transfection. After transfection, cells were incubated in 5% CO2 incubator at 37°C for 48–96 hrs for the RNA and protein expression studies.
Cell proliferation and cell cycle analyses
Three days after virus transduction, cells were seeded in 24-well plates and incubated for 2 days. After incubation, 20 μl of 3-(4,5-dimethylthiazol-2-yl)-2,5-diphenyltetrazolium bromide (MTT) stock solution (5 mg/ml; Sigma-Aldrich) was added to each well and the plates were further incubated for 4 hrs at 37°C. The supernatant was removed and 200 μl of dimethyl sulfoxide was added to each well to solubilize the water-insoluble purple formazan crystals. The optical density was measured at a wavelength of 540 nm in an enzyme-linked immunosorbent assay plate reader (EL800; Bio-Tek Instruments Inc., Winooski, VT, USA). All measurements were performed in triplicate. For the cumulative population doubling level (CPDL) assay, 105 virus-infected cells were cultured in a T-75 flask and the cell numbers were counted after 4–5 days. Similarly for successive passages, the same numbers of cells as before were sub-cultured and counted after 4–5 days.
Cell cycle was detected using flow-cytometry. For this cells were washed twice with phosphate-buffered solution (PBS) and harvested by trypsinization 3 days after transfection. The cells were then washed again with PBS and fixed with 70% ethanol at –20°C for 1 day. The fixed cells were washed with ice cold PBS and stained with 50 μg/ml of propidium iodide (Sigma) in the presence of 100 μg/ml RNase A (Sigma) for 30 min. The cell cycle was analysed using the FACS Calibur (Becton & Dickinson).
RT-PCR
Total RNA was extracted with an easy-spin™ Total RNA Extraction Kit (iNtRON biotechnology, Sungnam, Korea) according to the manufacturer’s instructions. cDNA synthesis was carried out using the SuperScript® III First-Strand Synthesis System for RT-PCR (Invitrogen) with 1 μg total RNA and oligo dT. Primers for each gene are shown in the Table S1. Gene expression was also analysed using real-time PCR with SYBR Green Master Mix reagents (Applied Biosystems, Foster City, CA, USA). The mRNA expression level of c-MYC and other genes were normalized with the expression level of glyceraldehyde 3-phosphate dehydrogenase. Real-time RT-PCR was performed with a LightCycler 489 Real-Time PCR System (Roche, Indianapolis, IN, USA). In this study, three independent hUCB-MSCs clones isolated from three independent individuals were used.
Immunofluorescence staining and Western blot
Cells were fixed with 4% para-formaldehyde for 10 min. at room temperature and incubated with blocking solutions (10% normal goat serum; Rockland Immunochemicals, Gilbertsville, PA, USA) overnight at 4°C. Cells were then incubated overnight at 4°C with a c-MYC (#sc-764; Santa Cruz Biotechnology, Delaware, CA, USA) and p27 (#sc-528; Santa Cruz Biotechnology) primary antibody at a 1:200 dilution in 5% blocking solution and then reacted with the Alexa Fluor anti-rabbit IgG secondary antibody (Invitrogen) for 1 hr. For nuclear counter-staining, Hoechst 33238 (1 μg/ml; Sigma-Aldrich) was diluted to 1:500 in PBS and incubated with the cells for 15 min. at room temperature. Images were taken with a confocal microscope (Eclipse TE200; Nikon, Tokyo, Japan). For Western blotting, cells were lysed with PRO-PREP (#17081; iNtRON biotechnology). Cell lysates were incubated on ice for 20 min. followed by centrifugation (13,000 rpm, 15 min., 4°C) and supernatant collection. The protein concentrations of samples were determined using the Protein Assay Reagent (Bio-Rad laboratories, Hercules, CA, USA) according to the manufacturer’s instructions. The protein (10–15 μg) was electrophoresed on a 10–12% SDS-PAGE. The proteins were detected with primary antibodies for c-MYC (AF3696; R&D Systems, Inc., Minneapolis, MN, USA), HDAC1 (2E10; Millipore, Billerica, MA, USA), HDAC2 (3F3; Millipore), HDAC3 (3G6; Millipore), HDAC4 (sc-48390; Santa Cruz Biotechnology), p21 (sc-32, Santa Cruz Biotechnology), p27(sc-528; Santa Cruz Biotechnology), p57 (06–556, Upstate, Lake Placid, NY, USA), cyclin-dependent kinase-4 (CDK4) (DCS156; Cell Signaling, Inc., Danvers, MA, USA) and hyperphosphorylated retinoblastoma (G3–245; BD Biosciences, San Jose, CA, USA). The antibodies were detected with the respective secondary antibody linked to horseradish peroxidase (Zymed Laboratories, Inc., South San Francisco, CA, USA). Secondary horseradish peroxidase-conjugated antibodies were detected by the enhanced chemiluminescence reagent (ImageQuant 400; GE Healthcare, Piscataway, NJ, USA).
Chromatin immunoprecipitation (ChIP) assay
The ChIP assay was carried out according to the manufacturer’s protocol (cat. #17–295; Upstate). Chromatin was cross-linked for 10 min., and then sonicated to shear DNA to a length of 200–1000 base pairs. The sonicated sample was diluted 10-fold with dilution buffer (1% of diluted solution was kept as input for quantification of the result). For a negative control, the sample was processed with normal IgG antibody (Santa Cruz Biotechnology). The rest of the sample was precipitated with the c-MYC mouse monoclonal antibody (1:200; Santa Cruz Biotechnology) for 48 hrs at 4°C with gentle rotation. The chromatin-antibody complex was isolated by incubation with 60 μl of salmon sperm DNA/Protein A agarose slurry for 1 hr at 4°C. The protein A agarose/antibody/histone complex pellet was isolated by gentle centrifugation (700–1000 rpm) and washed with a low-salt immune complex buffer, a high-salt immune complex buffer, a LiCl immune complex buffer and Tris-EDTA (TE) buffer serially on a rotating platform at 4°C for each wash. Chromatin-antibody complexes were eluted from the protein A/antibody/histone/DNA complex bead by the addition of 1% SDS, 0.1 M NaHCO3. Cross-linking was reversed by addition of a 0.05 volume of 5 M NaCl and incubation of the eluted samples overnight at 65°C. The DNA was extracted with phenol-chloroform, precipitated with ethanol and dissolved in autoclaved distilled water. PCR analysis of the immunoprecipitated DNA was performed with a PCR premix (Bioneer, Taejon, Korea). PCR of the genomic DNA (input, 1:20 dilution) was carried out along with the immunoprecipitated DNA. PCR products were visualized in a 2% agarose gel. PCR primer sequences are listed in Table S1.
Induction of differentiation and statistical analysis
To induce osteogenic differentiation, cells were seeded and maintained at 70–80% confluency, and incubated with DMEM low glucose medium (Gibco-Invitrogen, Carlsbad, CA, USA), 10% FBS (Gibco-Invitrogen), 0.1 μM dexamethasone (Sigma-Aldrich), 10 mM β-glycerophosphate (Sigma-Aldrich) and 50 μM ascorbate (Sigma-Aldrich) for 2–3 weeks [41]. Osteogenic differentiation was determined by staining with Alizarin Red S (Sigma-Aldrich). For adipogenic differentiation, cells were seeded and maintained at 80–90% confluency, and incubated with DMEM low glucose medium (Gibco BRL, Rockville, MD, USA), 10% FBS (Gibco BRL), 1 μM dexamethasone (Sigma-Aldrich), 10 μg/ml insulin (Sigma-Aldrich), 0.5 mM 3-isobutyl-1-methylxanthine (Sigma-Aldrich) and 0.2 mM indomethacin (Sigma-Aldrich) [41]. Adipogenic differentiation was determined by staining with Oil Red O (Sigma-Aldrich).
Statistical analysis was performed with student t-test using Microsoft Excel and P-value was calculated.
Results
The expression of c-MYC was found in hMSCs and cell proliferation was dramatically decreased after c-MYC knockdown
In this study, c-MYC expression was found in all hMSCs. The c-MYC in the hUCB-MSCs was specifically localized in the nucleus (Fig. 1A). The RNA and protein expressions of c-MYC were relatively constant through passages (p) of hUCB-MSCs from p3 to p9 (Fig. 1B). However, the expressions of l- and n-MYC were not constant in hUCB-MSCs throughout the passages (Fig. 1B). FACS analysis was performed for the confirmation of hUCB-MSCs (Fig. 1C). Positive markers for hMSCs (CD29, CD44, CD73, CD90 and CD105) were well detected in hUCB-MSCs. To validate the function of c-MYC in hMSCs, a c-MYC knockdown experiment was performed with lentivirus vectors in hUCB-MSCs. c-MYC inhibition was confirmed with Western blot and RT-PCR analysis (Fig. 2A). The RNA expressions of cyclin-dependent kinase inhibitors 1A and 1B (p21 and p27) in c-MYC knocked-down hUCB-MSCs were increased and similar with the vehicle control infected hUCB-MSCs respectively (Fig. 2A). Real-time RT-PCR revealed that the expression of c-MYC was decreased by 60% in ShM1 and 80% in ShM3 lentivirus-infected hUCB-MSCs compared to vehicle control-infected hUCB-MSCs (Fig. 2B). The expressions of n-Myc and l-MYC in hUCB-MSCs were not changed in c-MYC knocked-down hUCB-MSCs (Fig. 2A). The expressions of SOX2 and OCT4 were decreased after c-MYC inhibition of hUCB-MSCs. Cell proliferation was significantly decreased in c-MYC knocked-down hUCB-MSCs compared to vehicle control-infected hUCB-MSCs, which was measured using CPDL (Fig. 2C). The proliferation of c-MYC knocked-down cells decreased continuously from P1 to P3; it was assumed that the proliferation would reduce continuously in following passages too.
Fig 1.
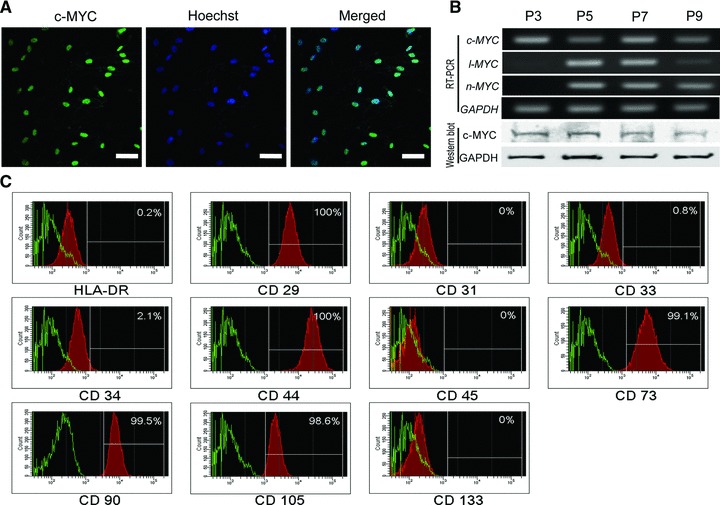
MYC expression and FACS analysis of hUCB-MSCs. (A) Immunostaining of c-MYC in p5 hUCB-MSCs. Nuclear localization of c-MYC is prominent. (B) MYC expression in hUCB-MSCs from p3 to p9. The expression of c-MYC is constant in hUCB-MSCs from p3 to p9. (C) FACS analysis of hUCB-MSCs. EC/EPC marker: CD31; MSC+ marker: CD29, CD44, CD73, CD90, CD105; MSC– marker: CD34, CD45; hematopoietic stem cell marker: CD31, CD34, CD133; MHC class II, leucocyte marker: HLA-DR. Scale bar represents 50 μm.
Fig 2.
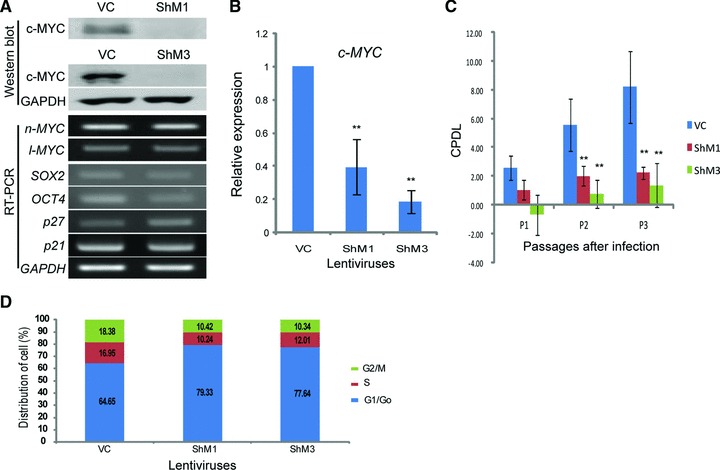
The knockdown of c-MYC results in growth retardation. (A) RNA and protein expression after c-MYC-inhibiting lentivirus infection. Two constructs of c-MYC-inhibiting lentivirus, ShM1 and ShM3, show effective inhibition in hUCB-MSCs. (B) Real-time RT-PCR after c-MYC inhibition in hUCB-MSCs. The expression of c-MYC is decreased by approximately 60% (ShM1) and 80% (ShM3) of the vector control-infected hUCB-MSCs. (C) Cell proliferation is measured with CPDL. c-MYC knocked-down hUCB-MSCs show severe growth retardation. (D) FACS analysis after c-MYC knockdown in hUCB-MSCs. G0/G1 cells are increased in c-MYC knocked-down hUCB-MSCs compared to those of the vehicle control-infected hUCB-MSCs. VC: vehicle control infected hUCB-MSCs. **P < 0.01.
The cell cycle was arrested in c-MYC knocked-down hUCB-MSCs
The cell cycle was measured in vehicle control-infected and c-MYC knocked-down hUCB-MSCs by FACS analysis (Fig. 2D). The number of cells in the G0/G1 phase was increased in c-MYC knocked-down hUCB-MSCs. Conversely, G2/M phase and S phase cells were decreased in c-MYC knocked-down hUCB-MSCs compared to the vehicle control-infected hUCB-MSCs. The expression of CDK4, which is involved in the control of cell proliferation during the G1 phase [42], was decreased in c-MYC knocked-down hUCB-MSCs compared to that of vehicle control-infected hUCB-MSCs (Fig. 3A). The protein expressions of p21 and p27, which are G1/S transition inhibitors [43], were increased in c-MYC knocked-down hUCB-MSCs compared to the levels in the vehicle control-infected hUCB-MSCs (Fig. 3A). The expression of hyperphosphorylated RB (PpRb), which is a G1/S transition accelerator [44], was significantly decreased in c-MYC knocked-down hUCB-MSCs compared to that of vehicle control-infected hUCB-MSCs (Fig. 3A). After c-MYC inhibition of hUCB-MSCs, the expression of class I and class II HDACs were compared at the RNA and protein levels. Among the HDAC family genes, the expressions of HDAC2, HDAC4 and HDAC5 in c-MYC knocked-down hUCB-MSCs were decreased compared to those of vehicle control-infected hUCB-MSCs at RNA expression levels (Fig. 3B and C). The protein expression levels of HDAC2 and HDAC4 were also decreased after c-MYC knockdown in hUCB-MSCs (Figs 3D and 6D). The localization of p27 is also an important factor for cell growth control [45] and the levels of p27 are high in quiescent cells [46]. Therefore, immuno-cytochemical observation was performed after c-MYC knockdown. In vehicle-control infected hUCB-MSCs, the localization of p27 was almost confined in nucleus. However, the signal of p27 in ShM3 (c-MYC knocked-down hUCB-MSCs) was strong and broad, which was distributed not only in the nucleus but also in cytoplasm (Fig. 3E).
Fig 3.
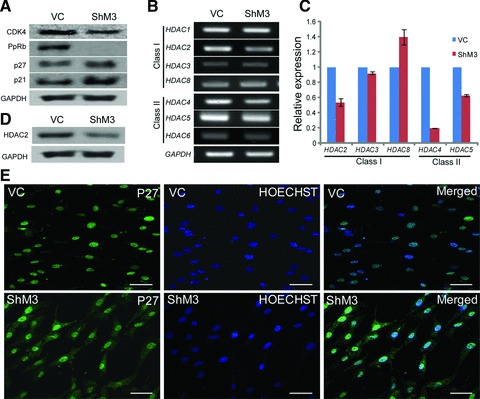
The gene expression changes and immuno-cytochemistry of p27 after c-MYC inhibition in hUCB-MSCs. (A) The protein expressions of CDK4 and PpRb are decreased after c-MYC inhibition. The expressions of p21 and p27 are increased after c-MYC inhibition. (B) The expressions of HDAC family genes in RT-PCR. (C) The expressions of HDAC2, HDAC4 and HDAC5 are decreased in real-time RT-PCR after c-MYC inhibition. (D) Western blot of HDAC2 after c-MYC inhibition. (E) Immunostaining of p27 after c-MYC knockdown. VC: vehicle control infected hUCB-MSCs; ShM3: c-MYC knocked-down hUCB-MSCs. Scale bar represents 50 μm.
Fig 6.

ChIP assay in the HDAC2 promoter region and expression changes after the treatment of HDAC2 siRNA in c-MYC overexpressing hUCB-MSCs. (A) ChIP assay in hUCB-MSCs. The c-MYC binding site is present in the HDAC2 promoter region. (B) Western blot of HDAC2, p27, p57 and PpRb after HDAC2 siRNA treatment. The expression of HDAC2 is decreased after HDAC2 siRNA treatment. The expressions of p27 and p57 are up-regulated but the expression of PpRb is down-regulated after HDAC2 siRNA treatment in c-MYC overexpressing hUCB-MSCs compared with those of control-treated c-MYC overexpressing hUCB-MSCs. (C) The expressions of HDACs after HDAC2 siRNA treatment in c-MYC overexpressing hUCB-MSCs with RT-PCR. (D) Western blot of HDAC2 and HDAC4 in c-MYC knocked-down and overexpressed hUCB-MSCs before and after HDAC2 siRNA treatment. HDAC4 expression is decreased in both c-MYC knocked-down and overexpressed hUCB-MSCs without regarding to HDAC2 siRNA treatment. siHD2: HDAC2 siRNA treatment; VC: vehicle control lentivirus infected hUCB-MSCs; ShM3: c-MYC knocked-down hUCB-MSCs; OvM: c-MYC overexpressing hUCB-MSCs.
The overexpression of c-MYC in hUCB-MSCs resulted in growth acceleration and up-regulation of HDAC2
To validate the function of c-MYC in hUCB-MSCs, overexpression study was performed with a lentivirus vector system. The expression of c-MYC was increased 3.5-fold in c-MYC overexpression lentivirus-infected hUCB-MSCs over the vehicle control-infected hUCB-MSCs in real-time RT-PCR analysis (Fig. 4A). These results were confirmed by RT-PCR and Western blot analysis (Fig. 4B). The expressions of SOX2 and OCT4 were increased after c-MYC overexpression of hUCB-MSCs. c-MYC overexpressing hUCB-MSCs grew faster than vehicle control infected hUCB-MSCs, which was measured with MTT assay (Fig. 4C). PpRB expression increased after c-MYC overexpression. The expressions of p21 and p27 were decreased in c-MYC overexpressing hUCB-MSCs compared with those of vehicle control-infected hUCB-MSCs (Fig. 5A). Among class I and II HDACs, only HDAC2 and HDAC4 expression was significantly increased after c-MYC overexpression in hUCB-MSCs at RNA expression levels (Fig. 5B and C). The increased expression of HDAC2 after c-MYC overexpression was confirmed at protein level (Fig. 5D). The expressions of other HDAC genes, except HDAC2 and HDAC4, were not significantly changed after c-MYC overexpression in hUCB-MSCs (Fig. 5B–D). However, the protein expression pattern of HDAC4 differed from RNA expression pattern. The protein expression of HDAC4 in c-MYC overexpressing hUCB-MSCs was not increased compared with vehicle control infected hUCB-MSCs (Fig. 6D).
Fig 4.
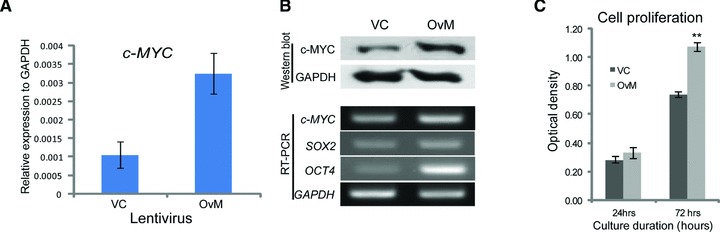
Overexpression of c-MYC in hUCB-MSCs. (A) c-MYC overexpressing lentivirus-infected hUCB-MSCs (OvM) shows a 3.5-folds increase in expression in real-time RT PCR. (B) RT-PCR and Western blot analysis of c-MYC after c-MYC overexpressing lentivirus-treated hUCB-MSCs. (C) Cell proliferation is enhanced in c-MYC overexpressing hUCB-MSCs. VC: vehicle control infected hUCB-MSCs; OvM: c-MYC overexpressing hUCB-MSCs. **P < 0.01.
Fig 5.
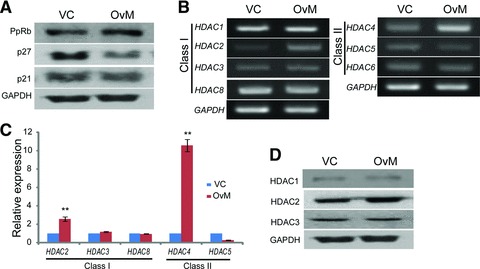
HDACs and cell cycle regulator expression after c-MYC overexpression in hUCB-MSCs. (A) The expressions of cell cycle regulators in Western blot. The expressions of p21 and p27 are down-regulated. The expression of PpRb is up-regulated in c-MYC overexpressing hUCB-MSCs. (B) The expressions of class I and II HDACs in RT-PCR. HDAC2 and HDAC4 are up-regulated in c-MYC overexpressing hUCB-MSCs. (C) The expressions of class I and II HDACs in real time RT-PCR. (D) Western blot of HDAC 1, 2 and 3. VC: vehicle control lentivirus infected hUCB-MSCs; OvM: c-MYC overexpressing hUCB-MSCs. **P < 0.01.
The c-MYC binding site is present in the HDAC2 promoter region and HDAC2 regulation by c-MYC is related to cell growth of hUCB-MSCs
The expression pattern of HDAC2 was matched with that of the c-MYC expression pattern, implying a direct correlation between the expressions of the two genes. After c-MYC knockdown, the expression of HDAC2 was decreased (Figs 3C and 6D). However, the expression of HDAC2 was increased after c-MYC overexpression of hUCB-MSCs (Figs 5B–D and 6B–D). Therefore, we investigated c-MYC binding site to the HDAC2 promoter region. Only one putative c-MYC binding site was found in the HDAC2 promoter region, and c-MYC binding at this site was confirmed in hUCB-MSCs by performing a ChIP assay (Fig. 6A). To evaluate the function of HDAC2 in c-MYC overexpressing hUCB-MSCs, HDAC2 was specifically inhibited with HDAC2 siRNA treatment in c-MYC overexpressing hUCB-MSCs (Fig. 6B–D). The expressions of other HDACs were not significantly changed after HDAC2 siRNA treatment except for HDAC2 (Fig. 6C). The down-regulated tumour suppression genes, p27 and p57, in c-MYC overexpressing hUCB-MSCs recovered after the HDAC2 siRNA treatment. However, overexpressed PpRb in c-MYC overexpressing hUCB-MSCs was down-regulated after HDAC2 siRNA treatment (Fig. 6B). The expression of c-MYC in HDAC2 siRNA treated c-MYC overexpressing hUCB-MSCs was also restored to the normal expression level (Fig. 6B). The accelerated cell proliferation of hUCB-MSCs after c-MYC overexpression was down-regulated after HDAC2 siRNA treatment (data not shown).
Differentiation ability was changed after c-MYC expression changes in hUCB-MSCs
The expression of c-MYC in hMSCs can affect stem cell differentiation, directly or indirectly. To evaluate the effect of c-MYC expression in hUCB-MSCs, a differentiation study was performed in c-MYC knocked-down and overexpressed hUCB-MSCs (Fig. 7). In c-MYC knocked-down hUCB-MSCs, adipogenesis and osteogenesis were decreased after proper induction, which were confirmed with Oil-Red O and Alizarin Red S staining, respectively. However, adipogenesis and osteogenesis were similar or increased in c-MYC overexpressing hUCB-MSCs, compared with those of vehicle control-infected hUCB-MSCs after proper induction. The specific gene expressions of adipogenic and osteogenic differentiation after induction were confirmed by RT-PCR. The expressions of PPARγ and C/EBPδ, the markers of adipogenesis [47], were decreased in c-MYC knocked-down hUCB-MSCs and increased in c-MYC overexpressing hUCB-MSCs, compared to vehicle control infected hUCB-MSCs. The expression of RUNX2, a marker of osteogenesis [48], was increased in c-MYC overexpressing hUCB-MSCs and the expression of RUNX1, the incomplete differentiation osteogenic marker [49], increased in c-MYC knocked-down hUCB-MSCs after osteogenic induction.
Fig 7.

Differentiation study after c-MYC expression changes. Adipogenic cells are stained with Oil Red O and Osteogenic cells are stained with Alizarin Red S. After c-MYC knockdown, differentiation ability of hUCB-MSCs is decreased in both adipogenic and osteogenic differentiation study. The overexpression of c-MYC shows similar or enhanced induction of differentiation in both adipogenic and osteogenic. VC: vehicle control; ShM3: c-MYC knockdown; OvM: c-MYC overexpression; Adipo: adipogenic differentiation; Osteo: osteogenic differentiation. Scale bars represents 50 μm.
The influential role of c-MYC in PcG genes expression and the regulation of HDAC2 in hAD- and hBM-MSCs
The expressions of most PcG genes decreased after c-MYC knockdown but increased after c-MYC overexpression in hUCB-MSCs (Fig. 8A–C). The increased PcG gene expressions in c-MYC overexpressing hUCB-MSCs were reduced after HDAC2 siRNA treatment, which was a similar pattern in most PcG complexes examined in the RT-PCR results (Fig. 8A–C). A real-time RT-PCR was performed for detailed comparison in subtle changed genes. The expression of EDR2 was down-regulated after c-MYC inhibition and up-regulated after c-MYC overexpression but showed an up-regulation after HDAC2 siRNA treatment in c-MYC overexpressing hUCB-MSCs (Fig. 8D). The expressions of EDR1, RING1 and EZH2 were not down-regulated after HDAC2 inhibition in c-MYC overexpressing hUCB-MSCs.
Fig 8.
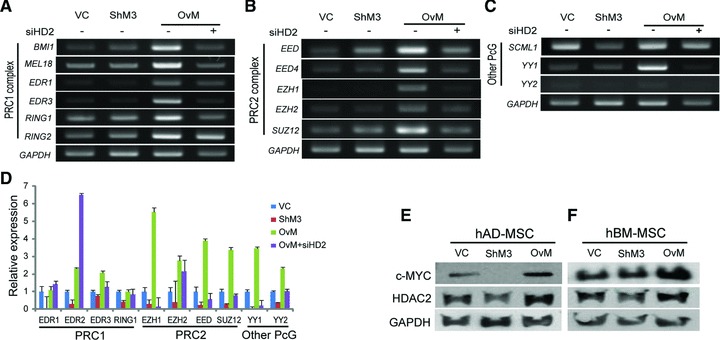
The expressions of PcG gene expression after c-MYC expression changes and c-MYC/HDAC2 expression in hAD- and hBM-MSCs. (A–C) The expression changes of PcG complex genes after c-MYC expression changes with or without HDAC2 siRNA treatment in RT-PCR. Most PcG genes expressions are increased after c-MYC overexpression and reduced after HDAC2 siRNA treatment. (D) Relative gene expression of PcG genes with real-time RT-PCR. PcG gene expressions are positively correlated with c-MYC and HDAC2 expression except of EDR1, EDR2 and RING1 expressions. (E, F) Western blot of c-MYC and HDAC2. (E) The expression pattern of HDAC2 match that of c-MYC expression pattern in hAD-MSCs. (F) The expression of HDAC2 is down-regulated after c-MYC inhibition and up-regulated after c-MYC overexpression in hBM-MSCs. VC: vehicle control infected hMSCs; ShM3: c-MYC knocked-down hMSCs; OvM: c-MYC overexpressing hMSCs.
The expression of c-MYC in hAD-MSCs and hBM-MSCs was analysed by Western blot (Fig. 8E and F). After c-MYC knocked-down, HDAC2 expression was significantly decreased in hAD-MSCs and hBM-MSCs respectively. The expressions of HDAC2 were increased after c-MYC overexpression in hAD-MSCs and hBM-MSCs. This expression pattern was similar to that observed in hUCB-MSCs. Therefore, it can be concluded that HDAC2 expression is positively regulated by c-MYC in three kinds of hMSCs, which includes hUCB-MSCs, hAD-MSCs and hBM-MSCs.
Discussion
c-MYC is a nuclear onco-protein and has emerged as a critical regulator of cell growth and tumour generation [15]. Here in our study, we demonstrated that c-MYC is associated with cellular growth, proliferation and differentiation in adult stem cells. Previous reports indicate that HDAC2 expression is prominent in different cancers [30, 31], in accordance to this; in our c-MYC knocked-down study, when HDAC2 is down regulated tumour suppression gene’s expression increased there by reducing the cell proliferation. In contrary, when c-MYC overexpressed, the expression of HDAC2 is also up regulated as a result tumour suppresser genes’ expression down-regulated there by promoting cell proliferation. Similarly, HDAC2 siRNA treatment in c-MYC overexpressing hUCB-MSCs, suppressed tumour suppressor genes reactivated and cell growth was reduced. The above finding indicates that c-MYC can regulate HDAC2 expression. In addition to this, the presence of c-MYC binding motif (CACGTG) in the promoter region of HDAC2 is confirmed by ChIP assay. This indicates the regulatory role of c-MYC on HDAC2 in hUCB-MSC. In other adult stem cells, hAD-MSCs and hBM-MSCs, HDAC2 expression was decreased after c-MYC inhibition and increased after c-MYC overexpression, which was a similar expression pattern to that of hUCB-MSCs.
c-MYC is a well-known growth regulator, found particularly in tumours, that regulates numerous genes. The conserved core of high-affinity MYC target genes represents around 11% of all cellular promoters [15]. The response of any target gene following MYC activation depends on a variety of other factors and changes dramatically as a function of cell type and environment [50]. Although the expression of c-MYC in adult stem cells has been reported previously [38, 51], the expressions of n-MYC and l-MYC have not yet been illustrated. This study represents the first result confirming the expression patterns of these genes, which were not consistent throughout passages of hUCB-MSCs in culture. Only c-MYC expression was consistent from p3 until p9 of hUCB-MSCs culture. Chromosomal modification is one of most important regulatory mechanisms for maintaining the stemness of adult stem cells [36]. Therefore, this study investigated the role of c-MYC in human adult stem cells, particularly with respect to the regulation of chromosomal modification genes.
Among class I and II HDACs, only HDAC2 expression was significantly decreased after c-MYC inhibition and increased after c-MYC overexpression in hUCB-MSCs at the both of protein and RNA expression levels. c-MYC binding in the HDAC2 promoter region was evident from a ChIP assay in hUCB-MSCs. Therefore, we investigated cell growth changes as a function of HDAC2 expression that was regulated by c-MYC. The expression of cell growth regulators was changed after HDAC2 siRNA treatment in c-MYC overexpressing hUCB-MSCs and cell growth was normalized. A correlation between c-MYC and HDAC2 expression was also found in hAD-MSCs and hBM-MSCs. Therefore, HDAC2 regulation by c-MYC in hMSCs is suggested as a common regulatory mechanism for cell growth control in adult stem cells. The expression of c-MYC itself was decreased after HDAC2 inhibition in c-MYC overexpressing hUCB-MSCs, which also implied that c-MYC expression could be regulated by HDAC2 expression conversely (Fig. 6C).
PcG genes are also important to epigenetic regulation of stem cells [36, 52], which is affected by c-MYC expression [53]. Our data showed the expression PRC2 related genes were down-regulated in c-MYC and HDAC2 inhibited cells. c-MYC overexpression in hUCB-MSCs induces the expression of PcG complex genes, and most PcG genes were down-regulated after HDAC2 inhibition. However, the expression level of EDR1, EDR2, RING1 and EZH2 were not down-regulated after HDAC2 inhibition. This might indicate that these genes were not under the control of HDAC2 or c-MYC. Protein expression of PcG could not be checked because of the unavailability of a suitable antibody. Further study is necessary to explore individual PcG protein expression. Previous study reported that HDAC inhibitor treatment can reduce the expression of PcG gene expression [54]. In this report, it was also found that HDAC2 specific siRNA treatment reduced PcG expression in adult stem cells. Therefore, it is postulated that c-MYC positively regulates most PcG expression in adult stem cells via HDAC2.
In conclusion, this study validated that c-MYC positively regulates HDAC2 expression at the transcriptional and translational level; this regulatory mechanism is found to be common in all three kinds of hMSCs. c-MYC binding site in the promoter region of HDAC2 was confirmed. c-MYC’s regulatory role might also be able to regulate the expression of PcG gene expression via HDAC2 regulation. As a result, cell proliferation and differentiation of adult stem cells is affected. In addition, our data also indicate that c-MYC and HDAC2 have a mutual regulatory role.
Acknowledgments
This work was supported by the Korea Research Foundation funded by the Korean government (MEST, No. 2010-0020265).
Conflict of interest
The authors confirm that there are no conflicts of interest.
Supporting Information
PCR primers used in study
References
- 1.Jaenisch R, Young R. Stem cells, the molecular circuitry of pluripotency and nuclear reprogramming. Cell. 2008;132:567–82. doi: 10.1016/j.cell.2008.01.015. [DOI] [PMC free article] [PubMed] [Google Scholar]
- 2.Campagnoli C, Roberts IA, Kumar S, et al. Identification of mesenchymal stem/progenitor cells in human first-trimester fetal blood, liver, and bone marrow. Blood. 2001;98:2396–402. doi: 10.1182/blood.v98.8.2396. [DOI] [PubMed] [Google Scholar]
- 3.Erices A, Conget P, Minguell JJ. Mesenchymal progenitor cells in human umbilical cord blood. Br J Haematol. 2000;109:235–42. doi: 10.1046/j.1365-2141.2000.01986.x. [DOI] [PubMed] [Google Scholar]
- 4.Gronthos S, Franklin DM, Leddy HA, et al. Surface protein characterization of human adipose tissue-derived stromal cells. J Cell Physiol. 2001;189:54–63. doi: 10.1002/jcp.1138. [DOI] [PubMed] [Google Scholar]
- 5.Igura K, Zhang X, Takahashi K, et al. Isolation and characterization of mesenchymal progenitor cells from chorionic villi of human placenta. Cytotherapy. 2004;6:543–53. doi: 10.1080/14653240410005366-1. [DOI] [PubMed] [Google Scholar]
- 6.Tsai MS, Lee JL, Chang YJ, et al. Isolation of human multipotent mesenchymal stem cells from second-trimester amniotic fluid using a novel two-stage culture protocol. Hum Reprod. 2004;19:1450–6. doi: 10.1093/humrep/deh279. [DOI] [PubMed] [Google Scholar]
- 7.Zvaifler NJ, Marinova-Mutafchieva L, Adams G, et al. Mesenchymal precursor cells in the blood of normal individuals. Arthritis Res. 2000;2:477–88. doi: 10.1186/ar130. [DOI] [PMC free article] [PubMed] [Google Scholar]
- 8.Prockop DJ. Marrow stromal cells as stem cells for nonhematopoietic tissues. Science. 1997;276:71–4. doi: 10.1126/science.276.5309.71. [DOI] [PubMed] [Google Scholar]
- 9.Pittenger M, Vanguri P, Simonetti D, et al. Adult mesenchymal stem cells: potential for muscle and tendon regeneration and use in gene therapy. J Musculoskelet Neuronal Interact. 2002;2:309–20. [PubMed] [Google Scholar]
- 10.Makino S, Fukuda K, Miyoshi S, et al. Cardiomyocytes can be generated from marrow stromal cells in vitro. J Clin Invest. 1999;103:697–705. doi: 10.1172/JCI5298. [DOI] [PMC free article] [PubMed] [Google Scholar]
- 11.Phinney DG, Isakova I. Plasticity and therapeutic potential of mesenchymal stem cells in the nervous system. Curr Pharm Des. 2005;11:1255–65. doi: 10.2174/1381612053507495. [DOI] [PubMed] [Google Scholar]
- 12.Tropel P, Platet N, Platel JC, et al. Functional neuronal differentiation of bone marrow-derived mesenchymal stem cells. Stem Cells. 2006;24:2868–76. doi: 10.1634/stemcells.2005-0636. [DOI] [PubMed] [Google Scholar]
- 13.Bhatia R, Hare JM. Mesenchymal stem cells: future source for reparative medicine. Congest Heart Fail. 2005;11:87–91. doi: 10.1111/j.1527-5299.2005.03618.x. [DOI] [PubMed] [Google Scholar]
- 14.Grandori C, Cowley SM, James LP, et al. The Myc/Max/Mad network and the transcriptional control of cell behavior. Annu Rev Cell Dev Biol. 2000;16:653–99. doi: 10.1146/annurev.cellbio.16.1.653. [DOI] [PubMed] [Google Scholar]
- 15.Adhikary S, Eilers M. Transcriptional regulation and transformation by Myc proteins. Nat Rev Mol Cell Biol. 2005;6:635–45. doi: 10.1038/nrm1703. [DOI] [PubMed] [Google Scholar]
- 16.Cowling VH, Cole MD. Mechanism of transcriptional activation by the Myc oncoproteins. Semin Cancer Biol. 2006;16:242–52. doi: 10.1016/j.semcancer.2006.08.001. [DOI] [PubMed] [Google Scholar]
- 17.Knoepfler PS, Zhang XY, Cheng PF, et al. Myc influences global chromatin structure. EMBO J. 2006;25:2723–34. doi: 10.1038/sj.emboj.7601152. [DOI] [PMC free article] [PubMed] [Google Scholar]
- 18.Sumi T, Tsuneyoshi N, Nakatsuji N, et al. Apoptosis and differentiation of human embryonic stem cells induced by sustained activation of c-Myc. Oncogene. 2007;26:5564–76. doi: 10.1038/sj.onc.1210353. [DOI] [PubMed] [Google Scholar]
- 19.Dominguez-Sola D, Ying CY, Grandori C, et al. Non-transcriptional control of DNA replication by c-Myc. Nature. 2007;448:445–51. doi: 10.1038/nature05953. [DOI] [PubMed] [Google Scholar]
- 20.Bhandari DR, Seo K, Roh K, et al. REX-1 expression and p38 MAPK activation status can determine proliferation/differentiation fates in human mesenchymal stem cells. PLoS ONE. 2010;5:e10493. doi: 10.1371/journal.pone.0010493. [DOI] [PMC free article] [PubMed] [Google Scholar]
- 21.Nagai A, Kim WK, Lee HJ, et al. Multilineage potential of stable human mesenchymal stem cell line derived from fetal marrow. PLoS ONE. 2007;2:e1272. doi: 10.1371/journal.pone.0001272. [DOI] [PMC free article] [PubMed] [Google Scholar]
- 22.Grandori C, Wu KJ, Fernandez P, et al. Werner syndrome protein limits MYC-induced cellular senescence. Genes Dev. 2003;17:1569–74. doi: 10.1101/gad.1100303. [DOI] [PMC free article] [PubMed] [Google Scholar]
- 23.Gartel AL, Shchors K. Mechanisms of c-myc-mediated transcriptional repression of growth arrest genes. Exp Cell Res. 2003;283:17–21. doi: 10.1016/s0014-4827(02)00020-4. [DOI] [PubMed] [Google Scholar]
- 24.Wang LG, Liu XM, Fang Y, et al. De-repression of the p21 promoter in prostate cancer cells by an isothiocyanate via inhibition of HDACs and c-Myc. Int J Oncol. 2008;33:375–80. [PubMed] [Google Scholar]
- 25.Gao L, Cueto MA, Asselbergs F, et al. Cloning and functional characterization of HDAC11, a novel member of the human histone deacetylase family. J Biol Chem. 2002;277:25748–55. doi: 10.1074/jbc.M111871200. [DOI] [PubMed] [Google Scholar]
- 26.Wolffe AP. Histones, nucleosomes and the roles of chromatin structure in transcriptional control. Biochem Soc Trans. 1997;25:354–8. doi: 10.1042/bst0250354. [DOI] [PubMed] [Google Scholar]
- 27.Brehm A, Miska EA, McCance DJ, et al. Retinoblastoma protein recruits histone deacetylase to repress transcription. Nature. 1998;391:597–601. doi: 10.1038/35404. [DOI] [PubMed] [Google Scholar]
- 28.Wade PA. Transcriptional control at regulatory checkpoints by histone deacetylases: molecular connections between cancer and chromatin. Hum Mol Genet. 2001;10:693–8. doi: 10.1093/hmg/10.7.693. [DOI] [PubMed] [Google Scholar]
- 29.Nakagawa M, Oda Y, Eguchi T, et al. Expression profile of class I histone deacetylases in human cancer tissues. Oncol Rep. 2007;18:769–74. [PubMed] [Google Scholar]
- 30.Zhu P, Martin E, Mengwasser J, et al. Induction of HDAC2 expression upon loss of APC in colorectal tumorigenesis. Cancer Cell. 2004;5:455–63. doi: 10.1016/s1535-6108(04)00114-x. [DOI] [PubMed] [Google Scholar]
- 31.Humphrey GW, Wang YH, Hirai T, et al. Complementary roles for histone deacetylases 1, 2, and 3 in differentiation of pluripotent stem cells. Differentiation. 2008;76:348–56. doi: 10.1111/j.1432-0436.2007.00232.x. [DOI] [PMC free article] [PubMed] [Google Scholar]
- 32.Jung JW, Lee S, Seo MS, et al. Histone deacetylase controls adult stem cell aging by balancing the expression of polycomb genes and jumonji domain containing 3. Cell Mol Life Sci. 67:1165–76. doi: 10.1007/s00018-009-0242-9. [DOI] [PMC free article] [PubMed] [Google Scholar]
- 33.Kuzmichev A, Nishioka K, Erdjument-Bromage H, et al. Histone methyltransferase activity associated with a human multiprotein complex containing the Enhancer of Zeste protein. Genes Dev. 2002;16:2893–905. doi: 10.1101/gad.1035902. [DOI] [PMC free article] [PubMed] [Google Scholar]
- 34.Valk-Lingbeek ME, Bruggeman SW, van Lohuizen M. Stem cells and cancer; the polycomb connection. Cell. 2004;118:409–18. doi: 10.1016/j.cell.2004.08.005. [DOI] [PubMed] [Google Scholar]
- 35.Levine SS, Weiss A, Erdjument-Bromage H, et al. The core of the polycomb repressive complex is compositionally and functionally conserved in flies and humans. Mol Cell Biol. 2002;22:6070–8. doi: 10.1128/MCB.22.17.6070-6078.2002. [DOI] [PMC free article] [PubMed] [Google Scholar]
- 36.Rajasekhar VK, Begemann M. Concise review: roles of polycomb group proteins in development and disease: a stem cell perspective. Stem Cells. 2007;25:2498–510. doi: 10.1634/stemcells.2006-0608. [DOI] [PubMed] [Google Scholar]
- 37.Frye M, Fisher AG, Watt FM. Epidermal stem cells are defined by global histone modifications that are altered by Myc-induced differentiation. PLoS ONE. 2007;2:e763. doi: 10.1371/journal.pone.0000763. [DOI] [PMC free article] [PubMed] [Google Scholar]
- 38.Seo KW, Lee SR, Bhandari DR, et al. OCT4A contributes to the stemness and multi-potency of human umbilical cord blood-derived multipotent stem cells (hUCB-MSCs) Biochem Biophys Res Commun. 2009;384:120–5. doi: 10.1016/j.bbrc.2009.04.094. [DOI] [PubMed] [Google Scholar]
- 39.Park JR, Jung JW, Lee YS, et al. The roles of Wnt antagonists Dkk1 and sFRP4 during adipogenesis of human adipose tissue-derived mesenchymal stem cells. Cell Prolif. 2008;41:859–74. doi: 10.1111/j.1365-2184.2008.00565.x. [DOI] [PMC free article] [PubMed] [Google Scholar]
- 40.Gnecchi M, Melo LG. Bone marrow-derived mesenchymal stem cells: isolation, expansion, characterization, viral transduction, and production of conditioned medium. Methods Mol Biol. 2009;482:281–94. doi: 10.1007/978-1-59745-060-7_18. [DOI] [PubMed] [Google Scholar]
- 41.Okamoto T, Aoyama T, Nakayama T, et al. Clonal heterogeneity in differentiation potential of immortalized human mesenchymal stem cells. Biochem Biophys Res Commun. 2002;295:354–61. doi: 10.1016/s0006-291x(02)00661-7. [DOI] [PubMed] [Google Scholar]
- 42.Lazarov M, Kubo Y, Cai T, et al. CDK4 coexpression with Ras generates malignant human epidermal tumorigenesis. Nat Med. 2002;8:1105–14. doi: 10.1038/nm779. [DOI] [PubMed] [Google Scholar]
- 43.Sherr CJ, Roberts JM. Inhibitors of mammalian G1 cyclin-dependent kinases. Genes Dev. 1995;9:1149–63. doi: 10.1101/gad.9.10.1149. [DOI] [PubMed] [Google Scholar]
- 44.Ogawa T, Yogo K, Ishida N, et al. Synergistic effects of activin and FSH on hyperphosphorylation of Rb and G1/S transition in rat primary granulosa cells. Mol Cell Endocrinol. 2003;210:31–8. doi: 10.1016/j.mce.2003.08.008. [DOI] [PubMed] [Google Scholar]
- 45.Slingerland J, Pagano M. Regulation of the cdk inhibitor p27 and its deregulation in cancer. J Cell Physiol. 2000;183:10–7. doi: 10.1002/(SICI)1097-4652(200004)183:1<10::AID-JCP2>3.0.CO;2-I. [DOI] [PubMed] [Google Scholar]
- 46.Cheng M, Olivier P, Diehl JA, et al. The p21(Cip1) and p27(Kip1) CDK ‘inhibitors’ are essential activators of cyclin D-dependent kinases in murine fibroblasts. EMBO J. 1999;18:1571–83. doi: 10.1093/emboj/18.6.1571. [DOI] [PMC free article] [PubMed] [Google Scholar]
- 47.Muruganandan S, Roman AA, Sinal CJ. Adipocyte differentiation of bone marrow-derived mesenchymal stem cells: cross talk with the osteoblastogenic program. Cell Mol Life Sci. 2009;66:236–53. doi: 10.1007/s00018-008-8429-z. [DOI] [PMC free article] [PubMed] [Google Scholar]
- 48.Takada I, Suzawa M, Matsumoto K, et al. Suppression of PPAR transactivation switches cell fate of bone marrow stem cells from adipocytes into osteoblasts. Ann N Y Acad Sci. 2007;1116:182–95. doi: 10.1196/annals.1402.034. [DOI] [PubMed] [Google Scholar]
- 49.Yamashiro T, Wang XP, Li Z, et al. Possible roles of Runx1 and Sox9 in incipient intramembranous ossification. J Bone Miner Res. 2004;19:1671–7. doi: 10.1359/JBMR.040801. [DOI] [PubMed] [Google Scholar]
- 50.Fernandez PC, Frank SR, Wang L, et al. Genomic targets of the human c-Myc protein. Genes Dev. 2003;17:1115–29. doi: 10.1101/gad.1067003. [DOI] [PMC free article] [PubMed] [Google Scholar]
- 51.Studzinski GP. Oncogenes, growth, and the cell cycle: an overview. Cell Tissue Kinet. 1989;22:405–24. doi: 10.1111/j.1365-2184.1989.tb00226.x. [DOI] [PubMed] [Google Scholar]
- 52.Niessen HE, Demmers JA, Voncken JW. Talking to chromatin: post-translational modulation of polycomb group function. Epigenetics Chromatin. 2009;2:10. doi: 10.1186/1756-8935-2-10. [DOI] [PMC free article] [PubMed] [Google Scholar]
- 53.Guney I, Sedivy JM. Cellular senescence, epigenetic switches and c-Myc. Cell Cycle. 2006;5:2319–23. doi: 10.4161/cc.5.20.3348. [DOI] [PubMed] [Google Scholar]
- 54.Kondo Y. Epigenetic cross-talk between DNA methylation and histone modifications in human cancers. Yonsei Med J. 2009;50:455–63. doi: 10.3349/ymj.2009.50.4.455. [DOI] [PMC free article] [PubMed] [Google Scholar]
Associated Data
This section collects any data citations, data availability statements, or supplementary materials included in this article.
Supplementary Materials
PCR primers used in study