

Abstract
Measurements of protein motion in living cells and membranes consistently report transient anomalous diffusion (subdiffusion) that converges back to a Brownian motion with reduced diffusion coefficient at long times after the anomalous diffusion regime. Therefore, slowed-down Brownian motion could be considered the macroscopic limit of transient anomalous diffusion. On the other hand, membranes are also heterogeneous media in which Brownian motion may be locally slowed down due to variations in lipid composition. Here, we investigate whether both situations lead to a similar behavior for the reversible ligand-binding reaction in two dimensions. We compare the (long-time) equilibrium properties obtained with transient anomalous diffusion due to obstacle hindrance or power-law-distributed residence times (continuous-time random walks) to those obtained with space-dependent slowed-down Brownian motion. Using theoretical arguments and Monte Carlo simulations, we show that these three scenarios have distinctive effects on the apparent affinity of the reaction. Whereas continuous-time random walks decrease the apparent affinity of the reaction, locally slowed-down Brownian motion and local hindrance by obstacles both improve it. However, only in the case of slowed-down Brownian motion is the affinity maximal when the slowdown is restricted to a subregion of the available space. Hence, even at long times (equilibrium), these processes are different and exhibit irreconcilable behaviors when the area fraction of reduced mobility changes.
Introduction
The structural elements of living cells (e.g., membranes, cytoplasm, nucleus, and mitochondria) exhibit disorder, heterogeneity, and obstruction typical of poorly connected media (1). For instance, cell membranes are heterogeneous collections of contiguous spatial domains with various length scales and timescales (e.g., fences, lipid rafts, and caveolae) (2) that spatially modulate the diffusion of proteins (3–5). This defines a spatially heterogeneous diffusion problem with a position-dependent diffusion coefficient (4,7–10). On the other hand, the movement of biomolecules such as proteins in the membranes of living cells has consistently been reported to exhibit anomalous diffusion, whereby the mean-squared displacement (MSD) scales sublinearly with time, with (11–14). This anomalous diffusion phenomenon (also coined subdiffusion) is a hallmark of diffusion obstruction by obstacles (15) or random walks with heavy-tailed residence time distributions (15,16) (for the sake of conciseness, we will not consider here fractional Brownian motion (fBM) as a model of crowding-induced anomalous diffusion (17)).
The influences of such deviations from simple Brownian motion on the biochemical reactions that take place in these media are just starting to be explored. The fundamentally heterogeneous spatial organization of the cell membrane is believed to locally favor the oligomerization of membrane receptors and prolong their local residence times, thus affecting signal transduction in the plasma membrane (5). However, careful investigations by Monte Carlo simulations hint that complex or counterintuitive behaviors can generically be expected (18,19).
The effects of anomalous diffusion on the dynamics of simple elementary reactions of biological interest have recently attracted the interest of several groups (20–23) (see Ben-Avraham and Havlin (24) for a book on elementary irreversible reactions). In the case of the binary reaction A+B → products, for instance, anomalous diffusion alters the overall reaction kinetics (25–27) and may favor the search of target DNA sequences by transcription factors in the nucleus (28,29) or reduce the time needed by an enzyme to reach its substrate (30). Anomalous diffusion has also been proposed as a key regulator of the spatiotemporal dynamics of Michaelis-Menten enzyme reactions (E+S ⇌ C → E + P) (31,32).
The case of reversible reactions, such as the ubiquitous ligand-binding equilibrium,
| (1) |
(where L is the ligand, R its free receptor, and C the bound complex), has received less attention. Reversible reactions are expected to converge at long times to equilibrium, thus permitting investigators to study the influence of anomalous or position-dependent diffusion not only on transient regimes but also on long-time equilibrium properties. Indeed, from standard mass-action laws (33), the concentration of complex C in reaction Eq. 1 evolves according to , where is the concentration of species X at time t. At equilibrium , assuming that the total amount of L molecules, LT, is much larger than that of R, RT, these mass-action laws yield , where the equilibrium constant . This defines so-called dose-response curves (the equilibrium amounts of C for increasing doses of ligand) with equilibrium constant, KD, a measure of the reaction affinity (the smaller the KD, the larger the affinity).
However, the significance of anomalous diffusion for equilibrium properties is questionable because in many experimental data (34–37), the anomalous regime is only transient: at long times, the MSD crosses over to normal (Brownian) diffusion, with but a reduced apparent diffusion coefficient. Such transient behaviors are obtained, e.g., when the density of obstructing obstacles is below the percolation threshold (38–40) or the residence time is power-law distributed with a cutoff (37,41). Fig. 1 A illustrates this transitory behavior with a Monte Carlo simulation of two-dimensional (2D) random walks on a square lattice in the presence of immobile obstacles (obstacle density ). For very short simulation times, the distance traveled by the molecules is less than the typical distance between obstacles, so the movement converges to a Brownian motion without obstacles (with microscopic diffusion coefficient D0). The movement then crosses over to the anomalous subdiffusive regime at longer times, with the MSD scaling sublinearly with time (roughly in the figure). However, the anomalous regime is transitory because at longer times, the movement crosses over to a second Brownian regime with a smaller apparent macroscopic diffusion coefficient, DM. A similar behavior is observed when molecule movements are due to a continuous-time random walk (CTRW), in which the residence time τ between two successive jumps has a power-law distribution ( with ) (15,16). When the residence time is upper-bounded by a cutoff (Fig. 1 B), the (ensemble-averaged) MSD scales anomalously for and then crosses over to a Brownian regime with reduced diffusion coefficient at longer times. In both cases in Fig. 1, the transient anomalous behavior transforms to a slowed-down Brownian motion at long times. This asymptotic slowed-down Brownian regime could be considered a macroscopic (homogenized) representation of the underlying microscopic anomalous diffusion. Following this line of reasoning, it is tempting to assume that the long-time (or equilibrium) behavior of a molecule undergoing transient anomalous diffusion can be captured by a slowed-down Brownian motion.
Figure 1.
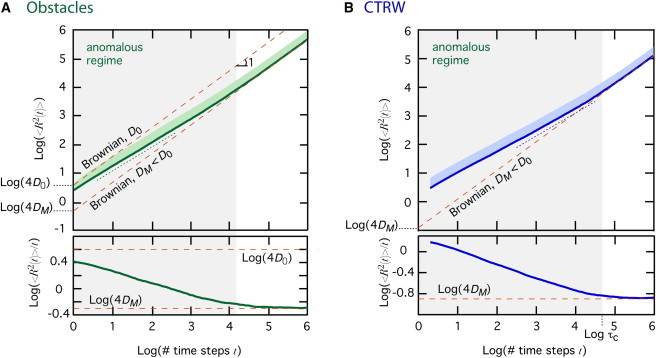
Transient anomalous diffusion as a transitory behavior in a macroscopic slowed-down Brownian regime. Time evolutions (log-log scales) of the MSD, (top) and the corresponding evolution of the ratio (bottom) during transient subdiffusive anomalous diffusion due to obstacle hindrance (A) or power-law distributed residence times (CTRW) (B) are shown. Thick lines show the (ensemble) average, and the light swaths indicate +1 SD. In the top panels, Brownian motion manifests as a straight line with unit slope and a y-intercept set by the diffusion coefficient (thin dashed orange lines). The anomalous regime is observed as a transient behavior, with slope in (A) or in (B) (dotted lines), crossing over to an effective macroscopic Brownian regime with diffusion coefficient DM. For panel A, one gets , whereas in B. In the bottom panels, Brownian motion manifests as a horizontal straight line with the y-intercept set by the diffusion coefficient and the anomalous regimes as straight lines with slope . Parameters: , and , domain size . Data are averages of 104 independent trajectories (A) obstacle density , (B) CTRW exponent , cutoff time .
Here, we questioned the validity of this assumption, i.e., that slowed-down Brownian motion can capture transient anomalous diffusion at long times. We studied the equilibrium properties of the ubiquitous ligand-binding equilibrium (Eq. 1) when diffusion was transiently anomalous due to either obstacles (below the percolation threshold) or power-law-distributed residence times, or when normal space-dependent Brownian diffusion took place. Using Monte Carlo simulations and theoretical arguments, we show that this approximation fails even for equilibrium properties, if diffusion conditions are heterogeneous in space.
Materials and Methods
Brownian motion
To simulate diffusion, we initially position L and R molecules uniformly at random on a 2D square lattice with reflective boundaries. Each lattice site is associated with a diffusion coefficient (all molecules here have identical diffusion coefficients). At each time step , every molecule is allowed to leave its current location with jump probability , where is the lattice spacing. The destination site is chosen uniformly at random from the four nearest neighbors and the molecule jumps to it. To simulate spatially heterogeneous diffusion, we position the boundary of the slowed-down patch in the middle of neighbor lattice sites. Each lattice side therefore belongs either to the slowed-down patch (we thus set its diffusion constant to ) or to the outer region (and we set ).
If the jump of the molecule to its destination site results in the formation of an (L,R) couple on the same lattice site, a binding event may occur, i.e., the (L,R) couple may be replaced by a single C molecule at the site, with probability . Finally, at each time step, every C molecule can unbind, i.e., the C molecule is replaced by an (L,R) couple at the same site, with probability .
Immobile obstacles
To simulate anomalous diffusion due to obstacles, we position obstacles at random locations (with uniform distribution) at the beginning of the simulation. The obstacles behave as a separate type of molecules that are kept unreactive and immobile, whereas the other molecules (L, R, and C) move as indicated above. Obstacles exclude the lattice site they occupy: when the destination site of a moving L, R, or C molecule contains an obstacle, the molecule is reflected back to its origin site (the destination site becomes the origin position). Reaction is modeled as described above for Brownian motion.
CTRW
Molecule motion by CTRW is modeled as for Brownian motion except that upon each jump to its destination site, the molecule is attributed a new residence time τ sampled from the power-law distribution , for which . Hence , the simulation time step, is the smallest residence time possible, and , the cutoff time, sets its maximal value. Therefore, the next jump of this molecule will not take place before τ time units have elapsed. Reactions are modeled exactly as for the Brownian case above, with the additional property that molecules can react during residence (i.e., between jumps, whenever they are located at the same location). Moreover, every new molecule resulting from a reaction samples a new residence time. Because microscopic details can have a crucial effect on CTRW-based reactions (21,42,43), we checked in a subset of simulations that the latter does not impact qualitatively our simulation results.
Simulation parameters
In a typical simulation, we start with R molecules and L molecules (where refers to the total number of molecules X), and no C, and run the simulation until the density of bound receptors C reaches a steady state, . We used standard parameter values throughout this study unless otherwise specified, i.e., lattice size , , , , , and diffusion coefficient . The ligand dose, , was varied to obtain dose-response curves. Data were averaged over 20 independent simulations.
Depending on simulation conditions, equilibrium was typically reached after at most 105 (obstacles) to (slowed-down Brownian diffusion) time steps. The equilibrium value of was therefore computed as the time average of for (obstacles) or (slowed-down Brownian). With CTRW, the time needed to establish equilibrium is much longer than the cutoff . In all of our simulations for , we observed that equilibrium was reached before , so we used the values for to compute the equilibrium value.
Results
Reaction in spatially homogeneous conditions
We first studied Eq. 1 in spatially homogeneous conditions, i.e., in conditions where the diffusion coefficient or local obstacle density is the same everywhere in space.
Fig. 2 A shows typical time courses of the bound fraction for different values of the diffusion coefficient D (no obstacles). Although the time needed to reach equilibrium increases with smaller diffusion coefficients, all curves seem to converge at long times to similar levels, thus suggesting that the equilibrium concentration of bound receptor does not depend on the diffusion coefficient. This is of course an expected result from standard thermodynamics: equilibrium configurations should in principle be independent of dynamics, i.e., values of transport coefficients such as diffusion coefficients. The situation is different when the molecule movement exhibits transient anomalous diffusion due to immobile obstacles randomly spread over the whole lattice. At long times (Fig. 2 B), the reaction also converges to equilibrium. In this case, though, the convergence time to this equilibrium does not seem to be affected by the density of hindering obstacles, but the concentration of bound receptor at equilibrium seems to vary with the obstacle density in a nontrivial fashion.
Figure 2.
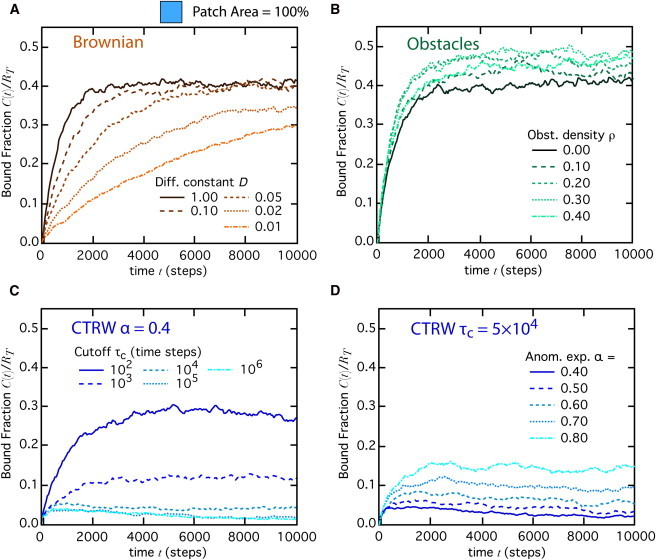
Transient dynamics of reaction (Eq. 1) in homogeneous conditions, . The time evolution of the bound fraction is shown either (A) for values of D decreasing from 1.0 to 0.01 (from top to bottom, respectively; no obstacles), (B) for obstacle densities increasing from 0.0 to 0.40 (with microscopic diffusion coefficient ), (C) for CTRW motion with and cutoff time or 106 (from top to bottom), or (D) for CTRW motion with cutoff time and or 0.8 (from bottom to top). Note that since the total simulation time is 106 time steps, corresponds to a CTRW with permanent anomalous regime (no crossover back to Brownian during the simulation). Total ligand number and all other parameters were set according to the standard set (see Materials and Methods).
Fig. 3 A shows the dose-response curve for an obstacle density (upper thick green line), for which molecule motion exhibits the transient anomalous diffusive behavior due to obstacles shown in Fig. 1 A (thick green line). With immobile obstacles, the bound fraction for all doses is found to be significantly larger than the dose-response curve obtained in the absence of obstacles (solid black circles). This confirms the observation of Fig. 2 B that obstacle hindrance alters the bound fraction at equilibrium. Because the molecule movement for converges at long times to Brownian diffusion with the effective macroscopic diffusion coefficient (Fig. 1 A), we compared these results with the dose-response curve obtained when the molecules moved by a Brownian motion (no obstacles) with diffusion coefficient (thick orange line). In agreement with the observation made above, and standard thermodynamics, the corresponding dose-response curve was not significantly different from the curve obtained with D = 1 (solid black circles). This confirms that the macroscopic slowed-down Brownian regime reached at long times during transient anomalous diffusion does not adequately account for the equilibrium properties of Eq. 1.
Figure 3.
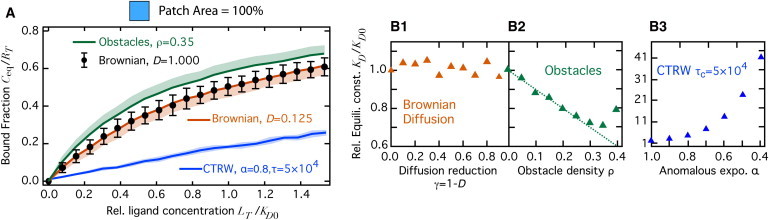
Equilibrium study of Eq. 1 in homogeneous conditions, . (A) The bound fraction at equilibrium, as a function of the relative ligand dose , where KD0 is the value of KD in the absence of obstacles and with reference diffusion coefficient . (ρ, D) = (0.0, D0) (black, bars show ± 1 SD), (0.0, 0.125) (orange, light swath shows -1 SD) or (0.35,1) (green, light swath shows +1 SD). The bound fraction at equilibrium for CTRW (with and ) is shown in blue (light blue swaths show ± 1 SD). From Student’s t-tests, the data points in the two Brownian cases are not significantly different (at identical ligand dose), whereas the data points in the presence of obstacles or with CTRW are each significantly different at all doses (except 0) from the Brownian cases (significance level ). (B) Relative apparent equilibrium constant (B1) without obstacles but increasing reduction of the diffusion, , (B2) with but increasing obstacle density ρ, or (B3) for CTRW-based motion with decreasing values of the anomalous exponent α (cutoff time ). The dashed line locates the diagonal . Other parameters were set according to the standard set (see Materials and Methods).
The dose-response curves for anomalous diffusion due to obstacles maintain a shape that is compatible with the classical dose-response equation . Therefore, we can fit them using this equation and retrieve for all obstacle densities the corresponding apparent equilibrium constant KD. Fig. 3 B displays KD values for several values of the diffusion coefficient reduction in the absence of obstacles (B1) and for several obstacle densities ρ (B2). As expected, even a one order of magnitude span for D in the Brownian case does not influence the apparent KD (B1).
The situation is different for transient anomalous diffusion, though. Far from the percolation threshold , KD decays linearly with obstacle density as . This is a simple effect of the excluded volume occupied by the obstacles. Indeed, for a constant number of molecules, the available space decreases when the obstacle density increases. Consequently, the local density of molecules increases with the obstacle density. This gives rise to the measured decrease of the apparent constant KD. In agreement, the decay of KD far from the percolation threshold disappears if the concentrations are computed on the basis of the accessible space, , instead of the whole space. Therefore, hindered diffusion due to obstacles not only decreases molecule mobility but also increases the affinity of the reaction. This trend, however, reverses close to the percolation threshold, where KD increases. This behavior is due to the competition between two effects: with increasing obstacle densities, the mean first-collision time increases because the macroscopic diffusion coefficient is slower (the first encounter between two distant molecules takes increasingly longer). On the other hand, the recollision time decreases because recollisions imply that molecules are initially close by (as a consequence of failed binding attempts or unbinding events), and anomalous diffusion favors recollisions (25,29). Close to the percolation threshold, the increase of the first-collision time overcompensates (by far) for the decrease of the recollision time (not shown). As a result, the forward reaction rate, kon, and the apparent affinity strongly decrease close to the threshold.
When anomalous diffusion is due to CTRW, the kinetics of the reaction shows a very different picture (Fig. 2, C and D). For anomalous diffusion due to obstacles, the obstacle density sets both the (apparent) scaling of the MSD with time in the anomalous regime and the duration of this regime. In the CTRW case, though, both quantities (the anomalous exponent α and the crossover time ) are parameters that we can fix separately. Similarly to obstacle-induced anomalous diffusion, the convergence time is not much affected by the value of the cutoff time (Fig. 2 C) or that of the anomalous exponent (Fig. 2 D). However, the concentration of bound receptors at equilibrium varies widely with the CTRW parameters. In general, the equilibrium values obtained with CTRW are much lower than those observed with Brownian motion and obstacle-induced anomalous diffusion. This reduction of equilibrium binding by CTRW progressively attenuates as the cutoff time decays to very low values (Fig. 2 C) or the anomalous exponent increases (Fig. 2 D), i.e., when diffusion is increasingly less anomalous and the motion tends to Brownian. Note that the largest cutoff used in this figure equals the total simulation time, so that, in effect, corresponds to a permanent CTRW regime (no crossover back to the Brownian regime within the simulation time). In this case, equilibrium cannot be reached during the simulation time (CTRW is then a nonequilibrium process).
This strong reduction of equilibrium binding with CTRW is even more obvious in the dose-response curve in Fig. 3 A. Note that the parameters for CTRW in this panel (blue curve) are those illustrated in Fig. 1 B (thick blue line). For a given ligand dose, the bound fraction at equilibrium with CTRW is much smaller (up to ∼2-fold) than the response curve with Brownian motion, whatever the slow-down (thick orange line). Here as well, since the overall shape of the CTRW dose-response curves is compatible with the classical form , they can be fitted to estimate the apparent equilibrium constant KD. Fig. 3 B3 shows that when diffusion becomes increasingly anomalous (the anomalous exponent α decreases from 1.0 downward), the equilibrium constant increases up to very high values. Therefore, the ligand-binding reaction at (long-time) equilibrium with CTRW-based or obstacle-based transient anomalous diffusion appears to be incompatible with slowed-down Brownian motion. However, in contrast to obstacle-based anomalous diffusion, CTRW-based anomalous diffusion strongly impairs the bound fraction at equilibrium and, more generally, the affinity of the ligand-binding equilibrium itself.
Space-dependent Brownian diffusion yields accumulation at equilibrium
The results presented so far consider spatially homogeneous conditions, i.e., . However, in living cells, the conditions are usually spatially heterogeneous: spatial domains (e.g., lipid rafts and caveolae) give rise to position-dependent values of D. In the experiments discussed below, we addressed this situation by restricting the region of space where diffusion is modified to a central square patch of variable spatial extent. We simulated spatial arrangements in which diffusion is Brownian with coefficient D0 outside the patch and reduced within the central patch by imposing a reduced diffusion coefficient D1 inside the patch.
Before addressing the ligand-binding equilibrium (Eq. 1) in these conditions, we first investigate diffusion in the absence of reaction. We use a central patch whose surface area is 25% of the whole space and simulate the diffusion of nonreactive molecules until they reach equilibrium. Once equilibrium is reached, we perturb it by the addition of supplemental nonreactive molecules in the center of the patch, and measure the characteristic time it takes to reach a new equilibrium and the concentration of molecules inside the patch at this new equilibrium. Because reduced diffusion in the patch slows down the molecules, the characteristic time it takes to converge back to equilibrium increases when diffusion is reduced in the patch (Fig. 4 A). More intriguingly, when we measure the concentration of molecules in the patch (relative to the exterior) at equilibrium, we observe an increasing accumulation of molecules within the patch when diffusion is slowed down therein (Fig. 4 B). We emphasize here that these are equilibrium conditions.
Figure 4.
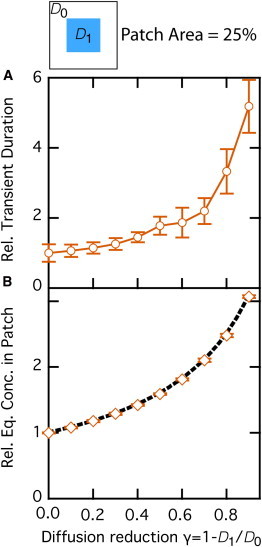
Brownian diffusion in heterogeneous (space-dependent) conditions. Nonreactive molecules diffuse with coefficient D0 (no obstacles) outside of a central patch in which diffusion is slowed down (the diffusion coefficient inside the patch is ). (A) Characteristic time required to reach equilibrium. (B) Molecule density at equilibrium in the patch. Data are normalized by the values obtained in the absence of slow-down, . The solid line in A is a guide to the eyes, and the black dashed line in B shows the theoretical prediction (Eq. 2). Bars indicate ± 1 SD. Other parameters were set according to the standard set (see Materials and Methods).
Although it is surprising, this equilibrium effect can be directly predicted in our system. A first intuitive approach is obtained from the detailed balance condition. A condition for our system to reach (thermodynamic) equilibrium it to respect detailed balance. Consider two states, A and B, of a Markov process. Note the probability to observe state A and the transition probability from A to B, the detailed balance condition reads . Consider now two lattice sites, and , located on either side of the frontier separating the central patch from the rest of the lattice. The detailed balance in this case reads , where is the concentration of molecules at node x. To emulate position-dependent diffusion (see Materials and Methods), our simulation algorithm states that the jump probability between two lattice sites depends exclusively on the diffusion coefficient at the node of origin. The detailed balance thus becomes (where D0 and D1 are the diffusion coefficients outside and inside the patch, respectively). This predicts accumulation inside the patch at equilibrium. A more formal approach can be applied, based on the master equation. This approach, detailed in the Supporting Material(section A), predicts that the total number of molecules at equilibrium in the patch relates to the total number , the surface fraction of the patch ϕ, the total surface S, and the diffusion coefficient according to
| (2) |
We tested the theoretical prediction of Eq. 2 against our Monte Carlo simulation results shown in Fig. 4 B. The agreement between theoretical prediction (thick dashed line) and simulation results (open diamonds) is very good. This confirms that slowed-down Brownian motion in the patch leads to a larger concentration inside the patch than outside at equilibrium.
Note that our diffusion algorithm, in which the jump probability depends only on the diffusion coefficient at the node of origin, corresponds to solving the Brownian motion with Ito’s stochastic calculus. Using Stratonovich’s rules instead would preserve accumulation within the patch, but with reduced intensity (3,19). To determine which algorithm is the correct one, one must know the microscopic quantities that cause the observed change of diffusion coefficient at macroscopic scales (3,44).
Reaction in spatially heterogeneous conditions
The accumulation phenomenon described above is likely to modify the reaction in the spatially heterogeneous diffusion case. Using several area fractions for the patch, we computed the values of the apparent equilibrium constant KD. With anomalous diffusion due to obstacles (Fig. 5 A), the behavior reported in Fig. 3 B2 is roughly conserved for all patch area fractions ϕ: KD decreases linearly with the obstacle density ρ far from the percolation threshold and then increases back close to it. The amplitude of this decay increases with the patch area (as the total space occupied by obstacles increases). Considering the behavior observed in spatially homogeneous conditions (Fig. 3 B2), one would expect that far from the percolation threshold, , yielding . Indeed, we found that the latter is a very good approximation for the simulation results of Fig. 5 A. Close to the percolation threshold, the apparent affinity reverses and starts to decrease because of the strong increase of the first-collision time (see above).
Figure 5.

Equilibrium properties of reaction Eq. 1 in space-dependent conditions. Molecules move with Brownian motion outside the central patch. Inside the central patch, molecule motion is due to (A) transient anomalous diffusion due to obstacles, (B) slowed-down Brownian motion or CTRW with (C) or (D) 0.60. (A–D) The panels show the apparent equilibrium constant as a function of the area fraction occupied by the patch ϕ and the obstacle density ρ (A), the amount of diffusion reduction in the patch, (B), or the cutoff time (C and D; note that C and D show ). The inset in B shows the value of ϕ that yields maximal affinity (solid circles) and the corresponding theoretical prediction (Eq. 3, solid line). Other parameters were set according to the standard set (see Materials and Methods).
The situation is quite different for space-dependent Brownian diffusion (Fig. 5 B). Whatever the patch area, we also observe that KD decreases, but in this case, this is the result of the accumulation phenomenon reported above (Fig. 4 B). Moreover, in this case, KD exhibits a nonmonotonous dependency with respect to the area fraction ϕ, with a marked minimum. Hence, for a given value of diffusion reduction in the patch, , our Monte Carlo simulations show that there exists an optimal value of the patch surface area that yields the highest affinity (Fig. 5 B, inset). Using Eq. 2 above for both R and L, we can estimate this optimal value analytically. Our theoretical analysis, given in the Supporting Material (section B), indeed shows the existence of an optimal surface area that maximizes the apparent reaction affinity. When the size of the space domain (which is always valid in the simulations shown in this work, given ), is predicted to depend on γ according to
| (3) |
In the limit of large slowdowns , Eq. 3 gives : the larger the slowdown, the smaller the optimal patch area. This prediction is in general qualitative agreement with the simulation results of Fig. 5 B, which do not depend in a monotonous way on γ and ϕ, but present extrema along the ϕ-axis that shift leftward with increasing γ. In the limit of no-slowdown , Eq. 3 predicts , but then, in this case, the apparent affinity does not depend on ϕ anymore (see the Supporting Material, section B), and thus no extrema are observed. For a quantitative test of Eq. 3, we plotted the relationship between γ and the value of ϕ that exhibited the smallest KD in our simulations (Fig. 5 B, inset, open circles). These values were found to align nicely with the prediction of Eq. 3 (inset, solid line), thus validating this prediction quantitatively.
Finally Fig. 5, C and D, show the behavior exhibited when anomalous diffusion is due to a CTRW with cutoff time. In agreement with Fig. 3, we note that for almost all of the parameters in these figures, the reaction affinity is massively impaired by CTRW, up to four to six orders of magnitude (note that these curves plot the log of the relative affinity constant). Even for rather short cutoffs (e.g., time steps), the apparent affinity of the ligand-binding equilibrium is lower with CTRW than with Brownian motion as soon as the patch in which CTRW occurs is wider than one-fourth of the total area. For some parameters, the affinity of the reaction can be larger than Brownian motion. However, this corresponds to very small cutoff times that produce anomalous regimes of very limited duration. In these cases, the CTRW in the patch tends to exhibit Brownian motion with a reduced diffusion coefficient, and thus the system tends to resemble the space-dependent Brownian case illustrated in Fig. 5 B. On the other hand, CTRW is also found to increase the apparent affinity for large cutoff times, but only for small to very small patch area fractions. The biological relevance of these restricted cases is therefore not obvious. Therefore, except for very small patch areas, CTRW-based anomalous diffusion massively impairs the affinity of the ligand-binding equilibrium.
To conclude, we have shown that heterogeneous slowed-down Brownian systems provide an advantage in terms of patchiness: the minimal value of KD is obtained when the patch occupies a subset of the available space. This is in strong contrast to the equilibrium behavior obtained with transient anomalous diffusion, where the affinity increases or decreases monotonously with the patch area fraction depending on the microscopic origin of the anomalous behavior (obstacles or CTRW, respectively).
Discussion
This study was motivated by the concept that, in contrast to the celebrated fluid mosaic model (45), the cellular plasma membrane is not a simple 2D liquid that can be made spatially homogeneous by the rapid lateral diffusion of lipids and proteins. Recent progress in time-lapse imaging (including at the single-molecule scale) has enabled researchers to obtain evidence for the existence of spatial inhomogeneities that form dynamical hierarchical domains at the mesoscale (e.g., fence-picket compartments, raft domains, and protein complex domains) (5). The impact of this organization in hierarchical domains on the signaling reactions that take place on the membrane is still poorly understood. The alteration of the diffusive movements of the proteins in these hierarchical domains may be very important for signaling (18). However, it is not yet entirely clear exactly which parameters of the diffusive movements are modified in which domains. One could think of modulations of the diffusion coefficient (4,7–10) or the confinement distance (46), or a local change from Brownian to non-Brownian diffusion (anomalous diffusion) due to macromolecular crowding or obstacle hindrance (12,47–49). Whether these different scenarios have different effects on biochemical reactions on the membrane is not known.
In this work, we focused on a comparison of three possible scenarios: Brownian diffusion with reduced diffusion coefficient (slowed-down Brownian) and transient anomalous diffusion due to immobile obstacles or power-distributed residence times (CTRW). Indeed, since transient anomalous diffusion converges at long times to a slowed-down Brownian movement, one may be led to consider slowed-down Brownian motion as equivalent to transient anomalous diffusion at equilibrium. In contrast, we have shown here that this assumption fails when diffusion conditions are spatially heterogeneous, since the equilibrium behavior of the three scenarios we contemplated are markedly distinct. When it is due to obstacles, transient anomalous diffusion increases the apparent binding affinity, with a maximal effect when the obstacles are spread all over the available space. However, when it is based on a CTRW, transient anomalous diffusion strongly decreases the apparent binding affinity. Slowed-down Brownian motion has a very different effect because it increases the apparent affinity in a nonmonotonous way: maximal affinity is reached when the region of reduced diffusion coefficient is restricted to a subdomain of the membrane surface. Therefore, slowed-down Brownian motion in the ligand-binding reaction does not capture the effect of transient anomalous diffusion even at the long times necessary to reach equilibrium.
A main result from our study is that CTRW and hindrance by immobile obstacles lead to very different behaviors at equilibrium even though they yield comparable anomalous scaling of the MSD. This result is in line with the realization that the two processes are fundamentally distinct. For instance, CTRW presents a weak ergodicity breaking (the scaling with time of the time-averaged MSD differs from that of ensemble-averaged MSD) (37,50) that is not observed with obstacle-based anomalous diffusion. The scaling with time or initial distance of several observables derived from first-passage-time statistics differs notably between the two processes (51). Whether the distinct equilibrium behaviors disclosed in our study are related to these differences is currently unknown, but will be investigated in future works. Paradoxically, however, these two processes need not be mutually exclusive and may coexist. For instance, it was recently suggested that the motion of ion channels on the cytoplasmic membrane would be consistent with a CTRW that is restricted to take place on a fractal (14). Because hindrance by randomly located immobile obstacles restricts the walker movement to such a fractal geometry (at least close to the percolation threshold) (38), such a phenomenon could in principle be studied in our simulations. However, adding the slowdown of the reaction due to obstacles to that due to CTRW may be problematic in terms of simulation times and demand alternative simulation or modeling frameworks.
Recent evidence suggests that fBM (and the associated fractional Langevin equation) is a third possible source of anomalous diffusion, in addition to obstacle hindering and CTRW. fBM is a generalization of classical Brownian motion, where the random increments between two successive locations are not independent (as in Brownian motion) but present long-range temporal correlations (17). Like CTRW and hindering by immobile obstacles, fBM gives rise to anomalous diffusion but no weak ergodicity breaking. Most notably, fBM could play an important role in the diffusion of lipids in membranes and be a major source of anomalous diffusion therein (52–54). Note, however, that fBM has also been proposed to describe the long-time regime in the transport of lipid granules in Schizosaccharomyces pombe (37). Although the impact of fBM on (bio)chemical reactions and on membrane signaling in particular has not yet been thoroughly studied (but see Hellmann et al. (32)), it may become an important topic if the role of fBM in lipid movements in membranes is confirmed.
Our results for slowed-down Brownian motion suggest that when the membrane is partitioned into two regions only (i.e., the patch, in which diffusion is slowed down, and the rest of the lattice), a surface area for the patch exists that optimizes the apparent reaction affinity. However, this is a very simplified configuration, since there may be several disconnected (slowed-down) patches coexisting in the membrane. It is unknown whether in this case a (total) optimal surface area would still exist or what (if any) type of spatial configuration of the patches would be optimal. In terms of combinatorics, a numerical study of this problem by Monte Carlo simulations would be very challenging because the number of configurations for a given total patch surface area is very large, but it could reveal some very interesting properties for space-dependent Brownian diffusion.
The functional implications of our findings may be important for our understanding of the organization of cell membranes and, more generally, cell spaces. For instance, it is interesting to note that in living cell membranes, slowed-down regions (e.g., rafts) show a very patchy distribution, whereas bulky obstacles seem less systematically clustered in limited regions. Therefore, by controlling the spatial extent of areas with reduced lateral diffusion, cells may be able to control the apparent affinity of the ubiquitous ligand-reaction binding events.
Acknowledgments
This research was supported by INRIA grant AE ColAge and a fellowship from Rhône-Alpes Region to B.C.
Contributor Information
Hédi Soula, Email: hedi.soula@insa-lyon.fr.
Hugues Berry, Email: hugues.berry@inria.fr.
Supporting Material
References
- 1.Dix J.A., Verkman A.S. Crowding effects on diffusion in solutions and cells. Annu. Rev. Biophys. 2008;37:247–263. doi: 10.1146/annurev.biophys.37.032807.125824. [DOI] [PubMed] [Google Scholar]
- 2.Jacobson K., Mouritsen O.G., Anderson R.G.W. Lipid rafts: at a crossroad between cell biology and physics. Nat. Cell Biol. 2007;9:7–14. doi: 10.1038/ncb0107-7. [DOI] [PubMed] [Google Scholar]
- 3.Schnitzer M.J. Theory of continuum random walks and application to chemotaxis. Phys. Rev. E Stat. Phys. Plasmas Fluids Relat. Interdiscip. Topics. 1993;48:2553–2568. doi: 10.1103/physreve.48.2553. [DOI] [PubMed] [Google Scholar]
- 4.Kenworthy A.K., Nichols B.J., Lippincott-Schwartz J. Dynamics of putative raft-associated proteins at the cell surface. J. Cell Biol. 2004;165:735–746. doi: 10.1083/jcb.200312170. [DOI] [PMC free article] [PubMed] [Google Scholar]
- 5.Kusumi A., Suzuki K.G.N., Fujiwara T.K. Hierarchical mesoscale domain organization of the plasma membrane. Trends Biochem. Sci. 2011;36:604–615. doi: 10.1016/j.tibs.2011.08.001. [DOI] [PubMed] [Google Scholar]
- 6.Reference deleted in proof.
- 7.Goodwin J.S., Drake K.R., Kenworthy A.K. Ras diffusion is sensitive to plasma membrane viscosity. Biophys. J. 2005;89:1398–1410. doi: 10.1529/biophysj.104.055640. [DOI] [PMC free article] [PubMed] [Google Scholar]
- 8.Pucadyil T.J., Chattopadhyay A. Effect of cholesterol on lateral diffusion of fluorescent lipid probes in native hippocampal membranes. Chem. Phys. Lipids. 2006;143:11–21. doi: 10.1016/j.chemphyslip.2006.04.003. [DOI] [PubMed] [Google Scholar]
- 9.Fujita A., Cheng J., Fujimoto T. Gangliosides GM1 and GM3 in the living cell membrane form clusters susceptible to cholesterol depletion and chilling. Mol. Biol. Cell. 2007;18:2112–2122. doi: 10.1091/mbc.E07-01-0071. [DOI] [PMC free article] [PubMed] [Google Scholar]
- 10.Day C.A., Kenworthy A.K. Tracking microdomain dynamics in cell membranes. Biochim. Biophys. Acta. 2009;1788:245–253. doi: 10.1016/j.bbamem.2008.10.024. [DOI] [PMC free article] [PubMed] [Google Scholar]
- 11.Schwille P., Korlach J., Webb W.W. Fluorescence correlation spectroscopy with single-molecule sensitivity on cell and model membranes. Cytometry. 1999;36:176–182. doi: 10.1002/(sici)1097-0320(19990701)36:3<176::aid-cyto5>3.0.co;2-f. [DOI] [PubMed] [Google Scholar]
- 12.Smith P.R., Morrison I.E., Cherry R.J. Anomalous diffusion of major histocompatibility complex class I molecules on HeLa cells determined by single particle tracking. Biophys. J. 1999;76:3331–3344. doi: 10.1016/S0006-3495(99)77486-2. [DOI] [PMC free article] [PubMed] [Google Scholar]
- 13.Fujiwara T., Ritchie K., Kusumi A. Phospholipids undergo hop diffusion in compartmentalized cell membrane. J. Cell Biol. 2002;157:1071–1081. doi: 10.1083/jcb.200202050. [DOI] [PMC free article] [PubMed] [Google Scholar]
- 14.Weigel A.V., Simon B., Krapf D. Ergodic and nonergodic processes coexist in the plasma membrane as observed by single-molecule tracking. Proc. Natl. Acad. Sci. USA. 2011;108:6438–6443. doi: 10.1073/pnas.1016325108. [DOI] [PMC free article] [PubMed] [Google Scholar]
- 15.Bouchaud J.-P., Georges A. Anomalous diffusion in disordered media: statistical mechanisms, models and physical applications. Phys. Rep. 1990;195:127–293. [Google Scholar]
- 16.Metzler R., Klafter J. The random walk’s guide to anomalous diffusion: a fractional dynamics approach. Phys. Rep. 2000;339:1–77. [Google Scholar]
- 17.Barkai E., Garini Y., Metzler R. Strange kinetics of single molecules in living cells. Phys. Today. 2012;65:29. [Google Scholar]
- 18.Grecco H.E., Schmick M., Bastiaens P.I.H. Signaling from the living plasma membrane. Cell. 2011;144:897–909. doi: 10.1016/j.cell.2011.01.029. [DOI] [PubMed] [Google Scholar]
- 19.Soula H.A., Coulon A., Beslon G. Membrane microdomains emergence through non-homogeneous diffusion. BMC Biophys. 2012;5:6. doi: 10.1186/2046-1682-5-6. [DOI] [PMC free article] [PubMed] [Google Scholar]
- 20.Hornung G., Berkowitz B., Barkai N. Morphogen gradient formation in a complex environment: an anomalous diffusion model. Phys. Rev. E Stat. Nonlin. Soft Matter Phys. 2005;72:041916. doi: 10.1103/PhysRevE.72.041916. [DOI] [PubMed] [Google Scholar]
- 21.Yuste S.B., Abad E., Lindenberg K. Reaction-subdiffusion model of morphogen gradient formation. Phys. Rev. E Stat. Nonlin. Soft Matter Phys. 2010;82:061123. doi: 10.1103/PhysRevE.82.061123. [DOI] [PubMed] [Google Scholar]
- 22.Fedotov S. Subdiffusion, chemotaxis, and anomalous aggregation. Phys. Rev. E Stat. Nonlin. Soft Matter Phys. 2011;83:021110. doi: 10.1103/PhysRevE.83.021110. [DOI] [PubMed] [Google Scholar]
- 23.Fedotov S., Falconer S. Subdiffusive master equation with space-dependent anomalous exponent and structural instability. Phys. Rev. E Stat. Nonlin. Soft Matter Phys. 2012;85:031132. doi: 10.1103/PhysRevE.85.031132. [DOI] [PubMed] [Google Scholar]
- 24.Ben-Avraham D., Havlin S. Cambridge University Press; Cambridge, UK: 2005. Diffusion and Reactions in Fractals and Disordered Systems. [Google Scholar]
- 25.Saxton M. Chemically limited reactions on a percolation cluster. J. Chem. Phys. 2002;116:203–208. [Google Scholar]
- 26.Bujan-Nunez M.C., Lopez-Quintela M.A. Enhancement of the recollision rate in diffusion-influenced reactions in an inhomogeneous medium. J. Chem. Phys. 2004;121:886–889. doi: 10.1063/1.1760603. [DOI] [PubMed] [Google Scholar]
- 27.Kim J.S., Yethiraj A. Effect of macromolecular crowding on reaction rates: a computational and theoretical study. Biophys. J. 2009;96:1333–1340. doi: 10.1016/j.bpj.2008.11.030. [DOI] [PMC free article] [PubMed] [Google Scholar]
- 28.Golding I., Cox E.C. Physical nature of bacterial cytoplasm. Phys. Rev. Lett. 2006;96:098102. doi: 10.1103/PhysRevLett.96.098102. [DOI] [PubMed] [Google Scholar]
- 29.Guigas G., Weiss M. Sampling the cell with anomalous diffusion—the discovery of slowness. Biophys. J. 2008;94:90–94. doi: 10.1529/biophysj.107.117044. [DOI] [PMC free article] [PubMed] [Google Scholar]
- 30.Sereshki L.E., Lomholt M.A., Metzler R. A solution to the subdiffusion-efficiency paradox: Inactive states enhance reaction efficiency at subdiffusion conditions in living cells. Europhys. Lett. 2012;97:20008. [Google Scholar]
- 31.Berry H. Monte carlo simulations of enzyme reactions in two dimensions: fractal kinetics and spatial segregation. Biophys. J. 2002;83:1891–1901. doi: 10.1016/S0006-3495(02)73953-2. [DOI] [PMC free article] [PubMed] [Google Scholar]
- 32.Hellmann M., Heermann D.W., Weiss M. Enhancing phosphorylation cascades by anomalous diffusion. Europhys. Lett. 2012;97:58004. [Google Scholar]
- 33.Lauffenburger D.A., Linderman J.J. Oxford University Press; New York: 1993. Receptors: Models for Binding, Trafficking, and Signaling. [Google Scholar]
- 34.Platani M., Goldberg I., Swedlow J.R. Cajal body dynamics and association with chromatin are ATP-dependent. Nat. Cell Biol. 2002;4:502–508. doi: 10.1038/ncb809. [DOI] [PubMed] [Google Scholar]
- 35.Murase K., Fujiwara T., Kusumi A. Ultrafine membrane compartments for molecular diffusion as revealed by single molecule techniques. Biophys. J. 2004;86:4075–4093. doi: 10.1529/biophysj.103.035717. [DOI] [PMC free article] [PubMed] [Google Scholar]
- 36.Bronstein I., Israel Y., Garini Y. Transient anomalous diffusion of telomeres in the nucleus of mammalian cells. Phys. Rev. Lett. 2009;103:018102. doi: 10.1103/PhysRevLett.103.018102. [DOI] [PubMed] [Google Scholar]
- 37.Jeon J.-H., Tejedor V., Metzler R. In vivo anomalous diffusion and weak ergodicity breaking of lipid granules. Phys. Rev. Lett. 2011;106:048103. doi: 10.1103/PhysRevLett.106.048103. [DOI] [PubMed] [Google Scholar]
- 38.Saxton M.J. Anomalous diffusion due to obstacles: a Monte Carlo study. Biophys. J. 1994;66:394–401. doi: 10.1016/s0006-3495(94)80789-1. [DOI] [PMC free article] [PubMed] [Google Scholar]
- 39.Höfling F., Franosch T., Frey E. Localization transition of the three-dimensional Lorentz model and continuum percolation. Phys. Rev. Lett. 2006;96:165901. doi: 10.1103/PhysRevLett.96.165901. [DOI] [PubMed] [Google Scholar]
- 40.Spanner M., Höfling F., Franosch T. Anomalous transport of a tracer on percolating clusters. J. Phys. Condens. Matter. 2011;23:234120. doi: 10.1088/0953-8984/23/23/234120. [DOI] [PubMed] [Google Scholar]
- 41.Saxton M.J. A biological interpretation of transient anomalous subdiffusion. I. Qualitative model. Biophys. J. 2007;92:1178–1191. doi: 10.1529/biophysj.106.092619. [DOI] [PMC free article] [PubMed] [Google Scholar]
- 42.Henry B.I., Langlands T.A.M., Wearne S.L. Anomalous diffusion with linear reaction dynamics: from continuous time random walks to fractional reaction-diffusion equations. Phys. Rev. E Stat. Nonlin. Soft Matter Phys. 2006;74:031116. doi: 10.1103/PhysRevE.74.031116. [DOI] [PubMed] [Google Scholar]
- 43.Mendez V., Fedotov S., Horsthemke W. Springer; Berlin: 2010. Reaction-Transport Systems: Mesoscopic Foundations, Fronts, and Spatial Instabilities (Springer Series in Synergetics) [Google Scholar]
- 44.Kampen N.V. Elsevier; Amsterdam: 2007. Stochastic Processes in Physics and Chemistry. [Google Scholar]
- 45.Singer S.J., Nicolson G.L. The fluid mosaic model of the structure of cell membranes. Science. 1972;175:720–731. doi: 10.1126/science.175.4023.720. [DOI] [PubMed] [Google Scholar]
- 46.Kamar R.I., Organ-Darling L.E., Raphael R.M. Membrane cholesterol strongly influences confined diffusion of prestin. Biophys. J. 2012;103:1627–1636. doi: 10.1016/j.bpj.2012.07.052. [DOI] [PMC free article] [PubMed] [Google Scholar]
- 47.Feder T.J., Brust-Mascher I., Webb W.W. Constrained diffusion or immobile fraction on cell surfaces: a new interpretation. Biophys. J. 1996;70:2767–2773. doi: 10.1016/S0006-3495(96)79846-6. [DOI] [PMC free article] [PubMed] [Google Scholar]
- 48.Rajani V., Carrero G., Cairo C.W. Analysis of molecular diffusion by first-passage time variance identifies the size of confinement zones. Biophys. J. 2011;100:1463–1472. doi: 10.1016/j.bpj.2011.01.064. [DOI] [PMC free article] [PubMed] [Google Scholar]
- 49.Vrljic M., Nishimura S.Y., McConnell H.M. Translational diffusion of individual class II MHC membrane proteins in cells. Biophys. J. 2002;83:2681–2692. doi: 10.1016/S0006-3495(02)75277-6. [DOI] [PMC free article] [PubMed] [Google Scholar]
- 50.Burov S., Jeon J.-H., Barkai E. Single particle tracking in systems showing anomalous diffusion: the role of weak ergodicity breaking. Phys. Chem. Chem. Phys. 2011;13:1800–1812. doi: 10.1039/c0cp01879a. [DOI] [PubMed] [Google Scholar]
- 51.Condamin S., Tejedor V., Klafter J. Probing microscopic origins of confined subdiffusion by first-passage observables. Proc. Natl. Acad. Sci. USA. 2008;105:5675–5680. doi: 10.1073/pnas.0712158105. [DOI] [PMC free article] [PubMed] [Google Scholar]
- 52.Kneller G.R., Baczynski K., Pasenkiewicz-Gierula M. Communication: consistent picture of lateral subdiffusion in lipid bilayers: molecular dynamics simulation and exact results. J. Chem. Phys. 2011;135:141105. doi: 10.1063/1.3651800. [DOI] [PubMed] [Google Scholar]
- 53.Jeon J.-H., Monne H.M.-S., Metzler R. Anomalous diffusion of phospholipids and cholesterols in a lipid bilayer and its origins. Phys. Rev. Lett. 2012;109:188103. doi: 10.1103/PhysRevLett.109.188103. [DOI] [PubMed] [Google Scholar]
- 54.Javanainen M., Hammaren H., Vattulainen I. Anomalous and normal diffusion of proteins and lipids in crowded lipid membranes. Faraday Discuss. 2013;161:397–417. doi: 10.1039/c2fd20085f. discussion 419–459. [DOI] [PubMed] [Google Scholar]
Associated Data
This section collects any data citations, data availability statements, or supplementary materials included in this article.