

Abstract
Increased accumulation of p53 tumor suppressor protein is an early response to low-level stressors. To investigate the fate of mitochondrial-sequestered p53, mouse embryonic fibroblast cells (MEFs) on a p53-deficient genetic background were transfected with p53-EGFP fusion protein led by a sense (m53-EGFP) or antisense (c53-EGFP) mitochondrial import signal. Rotenone exposure (100 nM, 1 h) triggered the translocation of m53-EGFP from mitochondrion to nucleus, thus shifting transfected cells from a mitochondrial p53 to a nuclear p53 state. Antibodies for p53 serine phosphorylation or lysine acetylation indicated a different post-translational status of recombinant p53 in the nucleus and mitochondrion, respectively. These data suggest that cycling of p53 through mitochondria may establish a direct pathway for p53 signaling from mitochondria to nucleus during mitochondrial dysfunction. PK11195, a pharmacological ligand of mitochondrial TSPO (formerly known as the peripheral-type benzodiazepine receptor), partially suppressed the release of mitochondria-sequestered p53. These findings support the notion that p53 function mediates a direct signaling pathway from mitochondria to nucleus during mitochondrial dysfunction.
Keywords: p53, mitochondria, rotenone, embryo, PK11195, mouse, TspO
1. Introduction
Perturbation of mitochondrial DNA (mtDNA) function has been reported in tumors [1–6]. Mitochondrial dysfunction can disrupt cellular energy and redox status, calcium (Ca2+) balance, and patterns of gene expression in many cell types. As such, signaling pathways linking mitochondrial function to nuclear events are important for cellular homeostasis.
Mitochondria to nucleus ‘retrograde’ (RTG) signaling was first reported in yeast [7, 8]. The pathway led from an alteration of mitochondrial state in which depletion of mtDNA invoked adaptive changes in gene expression [9]. Counterparts to yeast RTG genes have not been identified in the mammalian genome, although RTG signaling has been proposed [10–12]. Evidence for a mammalian RTG stress response was reported by Biswas et al. 1999 in C2C12 myocytes and A549 human lung cancer cells depleted of mtDNA and treated with 2, 3, 7, 8-tetrachlorodibenzodioxin (TCDD). The response involved reduced ATP, calcium signaling, and activation of a number of genes (NFkB/Rel factors, calcineurin, NFAT, ATF2) [11, 13]. Smiraglia et al. (2008) also reported the capacity of mitochondria to regulate epigenetic modifications in the nucleus in breast carcinoma cells [14]. In addition, Kulaweic et al. (2008) identified the tumor suppressor, p53 as a nodal protein involved in the gene network associated with depletion of mtDNA in breast epithelial cells [15].
Studies demonstrating the mammalian RTG stress pathway revealed many similarities to the yeast RTG pathway [9], including a decrease in ATP content, changes in the NADH/NAD+ balance, changes in redox state due to free radical production, and deregulation of Ca2+ homeostasis. Many of these changes were seen following rotenone exposure in mouse 3T3 cells. In cells transfected with a mitochondrion-specific p53 construct (m53-EGFP), rotenone shifted m53-EGFP from mitochondria to nucleus and restored cellular NADH balance [10]. These preliminary results suggest a role for the p53 tumor suppressor in signaling from mitochondria to nucleus during mitochondrial stress or dysfunction.
Studies with Cyclosporin A have shown that blocking mitochondrial permeability transition pore (MPTP) prevented p53 translocation into mitochondria [16]. A key component of the MPTP is the 18kDa ligand-gated mitochondrial transporter TSPO (tryptophan-rich sensory protein), formerly known as the peripheral benzodiazepine receptor [17]. TSPO is enriched in the outer/inner mitochondrial membrane contact sites and interacts with the voltage-dependent anion channel (VDAC, a protein critical for ion and metabolite entry) and adenine nucleotide translocator (ANT, transporter that mediates the exchange of ADP-ATP between mitochondrial matrix and cytoplasm). PK11195, a specific and potent (~7 nM) pharmacological ligand of TSPO, suppresses upstream activating signals leading to the nuclear accumulation of p53 protein in early mouse embryos [18,19] and has significant capacity to protect early mouse embryos from eye reduction malformations induced with diverse mitochondrial stressors such as methylmercury [20], 2-chlorodeoxyadenosine [18], hypoxia [21], and alcohol [22].
Although the role of mitochondrial-p53 is well described for a role in apoptosis, effects of p53 on mitochondrial biogenesis are less known [19, 23–26]. The present study has examined the effect of mitochondrial dysfunction and PK11195 activity on the release of mitochondrion-specific p53, which may be likened to a mammalian RTG stress response triggered by mitochondrial dysfunction. Pharmacologically active concentrations of PK11195 suppressed this pathway.
2. Materials and Methods
2.1. Cell culture
NIH/3T3 mouse embryonic fibroblast (MEF) cells (wild-type) and p53-deficient MEF cells (null) were obtained from the American Type Culture Collection (ATCC, Manassas, VA) and grown at 37°C in a humidified atmosphere of 5% CO2 in either 4-well chamber slides or T-75 flasks (Fisher Scientific, Pittsburgh, PA). Cells were harvested at approximately 80% confluence based on cell counts; all studies were performed between passages 2 and 15 using multiple stocks with multiple passages and all studies were run in three or more independent experiments. Cells were passaged every three days and cultured in Dulbecco’s Modified Eagle’s Medium (DMEM) (Gibco/Invitrogen, Carlsbad, CA) supplemented with 10% fetal bovine serum (Atlanta Biologicals, Lawrenceville, GA) and 0.025% gentamicin sulfate. Rotenone (CAS Number 83-79-4, PubChem Substance ID 24278683, ≥95% purity), PK11195 (CAS Number 85532-75-8, PubChem Substance ID 24278822), colchicine (CAS Number 64-86-8, PubChem Substance ID 24278348, ≥95% purity) and tissue culture grade dimethylsulfoxide (DMSO, ≥99.9% purity) were purchased from Sigma-Aldrich (St. Louis, MO). Rotenone concentrations (0 to 100 nM) concentrations used here were of the known range of its inhibitory action on NIH/3T3 cells [27].
2.2. Cell Transfection
Plasmids used in transfection studies were previously described [10, 19]. Plasmids (1:1 ratio, 3 μg), serum-free DMEM, and SuperFect Transfection Reagent (1 DNA: 5 SuperFect ratio) (Qiagen) were incubated for 10 min and complete DMEM was added to the suspension. Cells were incubated in transfection solution for 3 h; the solution was aspirated and replaced with complete DMEM. These vectors were stably transfected, with the neomycin resistance gene, into the p53 null cells that were then selected with 1.5 mg/mL neomycin (Sigma-Aldrich, St. Louis, MO). Selected cells were treated with DMSO or rotenone (0–100 nM) for 0–3 h before harvesting for western blot or immunostaining.
2.3. Reactive Oxygen Species (ROS) Detection
P53-null MEF cells were treated with DMSO vehicle, rotenone (100 nM, 1.5 h) as established in Green et al. (2011) or 100 nM rotenone co-treated with PK11195 (0–400 nM). ROS detection used Image-IT LIVE Green Reactive Oxygen Species Detection Kit (Molecular Probes). Cells were incubated in DCFDA (5-(and-6-)-carboxy-2′,7′-dichlorodihydrofluorescein diacetate) prepared in Hanks Balanced Salt Solution (HBSS) at a final concentration of 25 μM for 30 min at 37°C. Hoescht 33342 was used to identify nuclei. Cells were mounted in warm HBSS solution for fluorescence microscopy.
2.4. Immunofluorescent staining for cytochrome c and p53 phosphorylation sites
P53-null MEF cells were transfected with mEGFP (mitochondrial leader peptide + EGFP reporter + neomycin gene marker) or m53-EGFP (mitochondrial leader peptide + wild-type p53 + EGFP reporter + neomycin gene marker) vectors and treated with 100 nM rotenone or DMSO in complete medium for 0, 40, 80, 120, 180 min. Treated cells were fixed in 4% paraformaldehyde for 15 min, permeabilized with 0.2% Triton X-100 for 7 min, blocked with 10% BSA in phosphate-buffered saline (PBS) for 30 min, and incubated overnight with either monoclonal anti-cytochrome c or anti-phosphoserine p53 (Ser 6, 15, 20) (1:1000 dilution in 1% BSA/PBS) (Molecular Probes/Invitrogen, Carlsbad, CA) at 4°C in a humidified dark chamber. Slides were rinsed in PBS and later incubated with AlexaFluor 594-tagged goat anti-mouse IgG (1:1000 dilution, Molecular Probes). Finally, the cells were counterstained with Hoechst 33342. Slides were mounted with ProLong Anti-fade (Molecular Probes) and fluorescence was observed with Nikon E600 or DXM1200F microscopes for each individual channel and imaged using ACT software for three-color imaging. Localization of p53 was based on co-localization with compartmental markers Hoechst (nuclear) or mitochondrial vectors. At least four independent replicates were run for each study. One hundred cells were scored, within 4 or more different fields of view, for each treatment (DMSO + m53-EGFP, Rotenone + m53-EGFP, Rotenone + PK11195 + m53-EGFP and Rotenone +mEGFP) per replicate.
2.5. Protein Detection Using Western Blot
Stably transfected cells treated with DMSO, rotenone (100 nM) or co-treated with PK11195 for 80 min were washed with cold PBS and lysed with cell disruption buffer on ice for 5 min. Cells were scraped with a rubber policeman and collected in 1.5 ml tubes and 10 micrograms of protein were loaded onto 4–20% SDS-PAGE gel at 100V and transferred onto nitrocellulose membrane at 35V for 2 h. Membranes were blocked using non-fat dry milk for 1 h at room temperature. Membranes were washed in 1x Tris buffer saline with tween-20x (TBST) three times for 5 min each. Primary polyclonal p53, anti-Acetyl-p53 (lys379) and anti-glyceraldehyde 3-phosphate dehydrogenase (GAPDH) (1:1000) antibody (Santa Cruz Biotechnology, Santa Cruz, CA) 1:1000 was used overnight at 4°C. Membranes were washed in TBST and incubated in secondary anti-rabbit antibody 1:2000 and anti-biotin 1:1000 to detect the ladder for 1 h. Membranes were washed in PBS and proteins were detected via chemiluminescence (Cell Signaling, Beverly, MA) using a Kodak Image Station (Kodak Molecular Image Station 440, Eastman Kodak Company, New Haven, CT).
2.6. Reverse transcription/polymerase chain reaction (RT-PCR) analysis
Total RNA was isolated from p53 wild-type and p53-null cells using RNeasy (Qiagen, Valencia, CA) for four biological replicates. RNA was quantitated spectrophotometrically. After an 1 h RNase-free DNase digestion, 2μg of RNA was reversed transcribed with Superscript II Reverse transcriptase (Gibco-BRL, Gaithersburg, MD) at 42 °C in the presence of dithiothreitol (DTT), random primers, and 0.2 mM each dNTP. In each tube of Ready-to-go PCR beads (GE Healthcare Bio-sciences, Piscataway, NJ), 500 ng of cDNA and 2.5 μl of each primer were added, with a total volume of 25 μl. PCR cycles were 95 °C (1 min), 64 °C (1 min), and 72 °C (1 min). Reference gene (β-actin) and NAD-deacetylase genes (SIRT1 and SIRT3) reactions used 27 cycles. The primers were: 5′-TAC CAC AGG CAT TGT GAT GG-3′ and 5′-AAT AGT GAT GAC CTG GCC GT-3′ for β-actin (310 bp), 5′-CCC CAT GAA GTG CCT CAA AT -3′ and 5′-GAT TAC CCT CAA GCC GCT TA- 3′ for Sirtuin 1 (Sirt1) (550 bp) and 5′-CAG TAT GAC ATC CCG TAC CCT -3′ and 5′-AGA ATG AGT AGC AGA TCT GCC -3′ for Sirtuin 3 (Sirt3) (445 bp). PCR products were loaded on the DNA 1000 LabChip for quantification by the Agilent Bioanalyzer 2100. This application of the Bioanalyzer sizes and measures PCR double-stranded DNA fragments ranging from 25 to 1000 bp. Gel images are digitally created to replicate electrophoresis results.
2.7. Mitochondrial Extractions
To collect mitochondrial extracts, p53 wild-type MEF cells treated with rotenone (0, 50 and 500 nM) were trypsinized and pelleted. Samples were weighed and resuspended in 10 volumes of 1X Extraction Buffer A (10 mM HEPES, pH 7.5, 200 mM mannitol, 70 mM sucrose, 1 mM EGTA, and 2 mg/ml albumin)(Sigma-Aldrich, St Louis, MO) Samples were centrifuged at 600 x g for 5 minutes. The supernatant was transferred into a new tube and centrifuged at 11,000 x g for 10 minutes. The supernatant was removed and the pellet was resuspended in 1X Extraction Buffer A. Centrifugation speeds and times were repeated. The final pellet was resuspended in 200 μl of 1X Storage Buffer (20 mM MOPS, pH 7.5, 110 mM KCl, and 1 mM EGTA)(Sigma-Aldrich, St Louis, MO) for quantification. Mitochondrial extracts were quantified using the BCA Protein Assay (Pierce Biotechnology, Rockford, IL).
2.8. SIRT Histone Deacetylase Assay
For each assay, 25 μl of 2x substrate was added. Substrate solutions contained various concentrations of NAD+. SIRT-2, and SIRT Assay Buffer (Biomol, Plymouth Meeting, PA). Substrates were added to 1ug – 5 ug of mitochondrial extracts and SIRT assay buffer with a total volume of 20 μl. Trichostatin A (TriA) was used in an effort to inhibit Class I and II histone deacetylases. Class III histone deacetylases, such as SIRT3 are insensitive to TrA. A total of 5 μl of TriA (50 nM – 50 μM) was added to assays. Reactions were carried out for 30 minutes at 37°C. Afterwards, 50 μl of 1x Developer II and 2 mM nicotinamide solution were added to each reaction well. Plates were allowed to incubate for 45 minutes at 37°C for signal to develop. Plates were read on the multiplate reader, Wallac 1420 VICTOR3 (Excitation 355 nm, Emission 460 nm) (PerkinElmer Life and Analytical Sciences, Inc., Boston, MA).
2.9. Statistical Analysis
For quantitation of m53-EGFP translocation (control vs. rotenone), (rotenone vs. rotenone + PK11195) and (colchicine vs. colchicine + PK11195) treatment and band intensity for western blot analysis, a Two-tailed t test was performed and p values less than 0.05 were taken as significant.
3. Results
3.1. Rotenone exposure releases p53 from the mitochondria
P53-null MEF cells were stable-transfected with m53-EGFP or mEGFP to yield cells that sequestered p53-EGFP recombinant protein or EGFP (Figure 1), respectively in the mitochondrion based on co-localization with MitoTracker Red [10]. Treatment with 100 nM rotenone resulted in a translocation of m53-EGFP to the nucleus of most cells within 3h (Figure 2 and Supplementary Figure 1). This was in stark contrast to cells transfected with mEGFP and c53-EGFP, where the fluorescent signal remained sequestered to mitochondria and nucleus, respectively (Figure 2 and Supplementary Figure 2). The effect of rotenone was evident at 100 nM and could be at least partially blocked with 400 nM PK11195 (Figure 2). To monitor the progression, we scored 100 cells per treated group by fluorescent signal as mitochondrial (Class-0), nuclear (Class-2), or intermediate (Class-1). Control cultures had virtually all Class-0 cells. Upon rotenone exposure, an increasing fraction of the 100 scored cells shifted to Class-1 and Class-2 states within 20 min to 40 min and peaking at 80 min before recovery (Figure 3). At the peak time (80 min) PK11195 dramatically suppressed the effect. Neither the mitochondrial release of m53-EGFP, nor its nuclear translocation, were cycloheximide-sensitive (not shown).
Fig. 1. Schematic representation of p53 and deduced proteins.
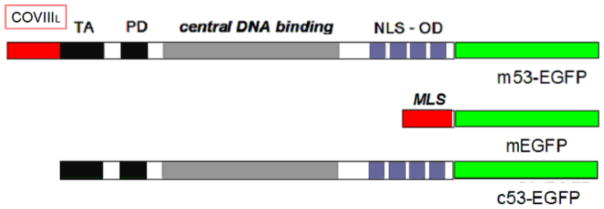
The p53 protein contains an N-terminal transactivation domain (TA), and proline-rich domain(PD) (black), a sequence–specific DNA binding domain (gray) and a C-terminal tetramerization domain (blue) containing a nuclear localization sequence (NLS) with or without an EGFP tag (green). Vectors target the nucleus (c53-EGFP) or mitochondria which contain the cytochrome c oxidase subunit 8 (CoxVIII) mitochondrial localization (MLS) in red (mEGFP and m53-EGFP).
Fig. 2. Recombinant p53 translocates from the mitochondria to nucleus upon rotenone treatment of MEF cells.

Panel A: Mitochondria-targeted p53-EGFP remains localized to mitochondria in sham treated cultures. Panel B: Rotenone exposure (100 nM, 80 min) in p53 null MEF cell cultures induces p53 translocation from the mitochondria to the nucleus as shown with overlapping Hoechst stain. Panel C: Co-treatment of rotenone (100 nM, 80 min) and PK11195 (peripheral benzodiazepine receptor ligand) largely-prevents p53 nuclear translocation. Panel D: mEGFP transfected p53 null cells treated with rotenone. Magnification 40x.
Fig. 3. Optimal time for m53-EGFP export is 80 minutes.

m53-EGFP transfected p53 null MEFs were treated with either rotenone (100 nM) (blue and white solid and striped columns) or rotenone (100 nM) with PK11195 (400 nM) (black and white solid and striped columns). Cells were scored as class-0 (mitochondrial p53), class-1 (mitochondrial and nuclear p53) or class-3 (nuclear p53). At 0 minutes, cells were scored as class-0 only, whereas; rotenone treatment was scored as class 0–2 at varying levels. PK11195 decreased the amount of m53-EGFP released at the optimal time point (80 min) by 50%. There was a significant difference in mitochondrial localization as assessed by a two-tailed T test (*p<0.01 at 0 min vs. 80 min rotenone exposure and *p<0.05 for 80 min rotenone exposure vs 80 min rotenone + PK11195 exposure).
3.2. ROS accumulation and cytochrome c release
Rotenone (100 nM) induced ROS accumulation in p53 null MEF cells sometime between 10 min and 40 min (Figure 4). There was a 61% increase in cells stained positive for ROS with rotenone and this was compared to 15% increase DMSO treatment and 57% tert-butyl hydroperoxide, as a positive control. This coincided with the early effects of rotenone shifting the cells from Class-0 to Class-2 with respect to mitochondrial release of m53-EGFP. PK11195 (400 nM) suppressed rotenone-induced ROS accumulation just as it did maintain Class-0 status (22%). The correlation suggests a possible relationship between ROS accumulation and mitochondrial release of p53. In contrast, both of these events occurred well in front of a demonstrable release of cytochrome c from the mitochondrion and was first evident at the 80 min time point (Figure 5A, B and Supplemental Figure 3).
Fig. 4. Nanomolar concentrations of rotenone induce ROS accumulation.

A: p53 null MEF cells were either DMSO vehicle or B: Rotenone (100 nM, 40 min) treated and exposed to C-H2DCFA dye to detect total cellular ROS. C: Rotenone and PK11195 (400 nM) co-treatment. Results show positive accumulation of ROS in cells treated with rotenone observed by green fluorescence in panel B.
Fig. 5. Mitochondria to nuclear p53 translocation precedes cytochrome c release.
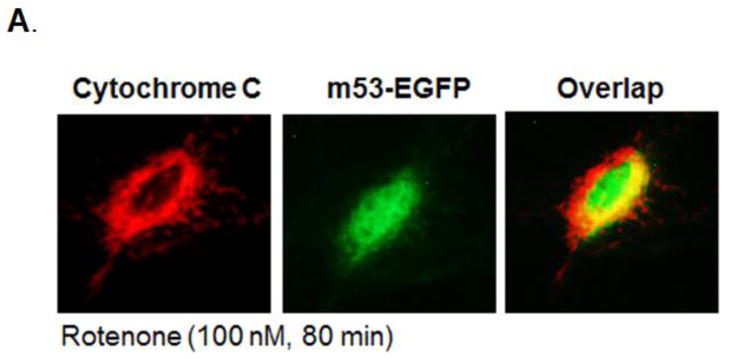
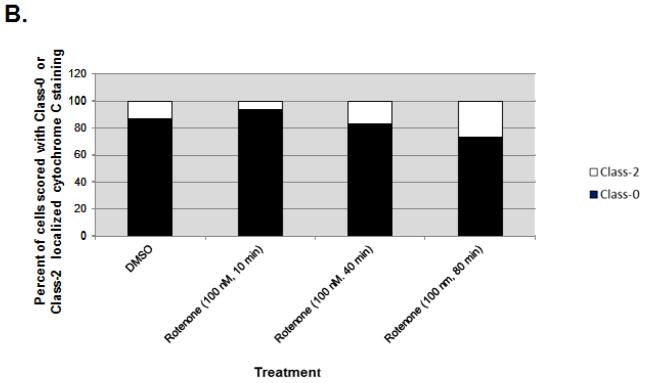
A: Cytochrome c: Immunofluorescent staining of mitochondrial localized cytochrome c (red) in rotenone exposed (100 nM, 80 min) p53 null MEFs. m53-EGFP: Mitochondria-targeted p53-EGFP (green) translocates to nucleus upon rotenone exposure in p53 null transfected cells. Overlap: Overlap of cytochrome c and p53-EGFP suggests p53 nuclear translocation occurs before cytochrome c release, an indicator of apoptosis. Magnification 40x. B: Bar graph shows the number of cells (100 m53-EGFP transfected cells scored per treatment) with cytochrome c localized to mitochondria (black columns). Results show that upon rotenone treatment, cytochrome c remains in mitochondria while m53-EGFP translocates from mitochondria to nucleus.
3.3. Colchicine induces p53 translocation independent of ROS
TP53 physically associates with microtubules in the cell [28], and rotenone has been shown to disrupt the microtubular network [10]. This raised the question of whether microtubule destabilization could also trigger the release of mitochondrial p53 because tubulin binds to mitochondria specifically at VDAC (which interacts with TSPO) and rotenone and colchicine treatment leads to partial mitochondrial depolarization [41]. MEF cells null for p53 and transfected with m53-EGFP were treated with 500 nM colchicine for 1.5 h. No demonstrable ROS accumulation was observed (Figure 6A). Colchicine, in the absence of rotenone, was a strong inducer of mean m53-EGFP release (70% combined Class-1 and Class-2) and the effect of colchicine was lessened by PK11195 (40nM) or PK11195 (400nM) in a total of 100 scored cells per treatment (60% and 63%, respectively with combined Class-1 and Class-2) (Figure 6A and 6B). There were, however, statistically significant differences between Class-0, Class-1 and Class-2 morphologies, between colchicine and colchicine w/ PK11195 in m53-EGFP transfected cells as assessed by a paired t test for Class-0, Class-1 and Class-2 (*p ≤ 0.01), for colchicine vs. colchicine + PK11195 40 or 400 nM.
Fig. 6. Colchicine treatment induces m53-EGFP translocation from mitochondria to nucleus.


A: Colchicine does not induce ROS, suggesting that ROS accumulation is independent of m53-EGFP translocation. B: Bar graph shows ratio of m53-EGFP localization to either mitochondria, Class-0 (black); nucleus, Class-2 (white) or both, Class-1 (striped) compartments. Co-treatment of colchicine + PK11195 does not completely inhibit nuclear translocation. *p<0.05 colchicine vs. colchicine w/ PK11195
3.4. Ser 15 phosphorylation and Lys 379 acetylation of p53
MEF cells null for p53 and transfected with m53-EGFP were stimulated with rotenone (100 nM) and at 80 min were fixed and immunostained with anti-p53 monoclonal antibodies specific for phosphorylation at Ser-6, Ser-15, Ser-20. m53-EGFP protein released from the mitochondrion and translocated to the nucleus was shown to be specifically stained with Ser-15 phosphorylated antibodies (Figure 7A). Upon rotenone treatment at 80 min, approximately 60% of the m53-EGFP transfected cells stained positive for Ser-15 compared to 0% of cells sham treated with DMSO (Figure 7B). Positive staining corresponded to Class-1 and -2 morphology, only. Western blot analysis was used to detect post-translational modification of m53-EGFP using anti-acetylated (Lys 379) p53 antibody. Acetylation of recombinant p53 was observed in both control (DMSO vehicle) and rotenone-exposed cells (Figure 8A and 8B). This effect was specific for p53 that cycled through the mitochondria because MEF cells transfected with c53-EGFP, which is not competent for mitochondrial import, did not show immunoreactivity to anti-acetylated (Lys 379) p53 antibody. The immunoreactive protein band was located at ~200kDa. The experiment was repeated multiple times under different conditions such as with new biological replicates, new antibody and/or with different reducing agents and each time yielded the same ~200 kDa band, which would be 2-times the size expected from a protein 53 kDa in size with a mitochondrial import (14 kDa) signal and EGFP (27kDa) reporter. Quantification of band density as assessed by a paired t-test from the electronic images of the immunoblot did not reveal an effect of rotenone compared to control. However, there was a significant change between rotenone and rotenone co-treated with PK11195. We may conclude from these findings that p53 is Lys 379 acetylated in the mitochondrion and, when released is rapidly translocated to the nucleus and Ser-15 phosphorylated. It is uncertain whether p53 is Lys 379 acetylated in the nucleus, as well.
Fig. 7. Phosphorylation at serine 15 of p53 occurs once m53-EGFP is released from the mitochondria to nucleus.


A: m53-EGFP (green) transfected p53 null cells were either treated with DMSO vehicle control or rotenone (100 nM, 80 min). Phosphorylated p53 (red) did not occur in the mitochondria in any of the controls. Rotenone treatment induced release of mitochondrial p53 to nucleus (blue). Only phosphorylation at serine 15 occurred when p53 translocated to the nucleus. NOTE: mEGFP is retained upon rotenone treatment (data not shown). Magnification 20x. B: Bar graph shows ratio of 100 m53-EGFP transfected cells scored for each group with m53-EGFP localization to either mitochondria, Class-0 (black); nucleus, Class-2 (white) or both, Class-1 (striped) compartments. Treatment with DMSO were Class-0 only whereas, Class-2 cells in the rotenone (100 nM, 80 min) treated group all stained positive for Ser-15.
Fig. 8. Acetylation at Lys 379 of p53 occurs in m53-EGFP stable transfected cell lysates.
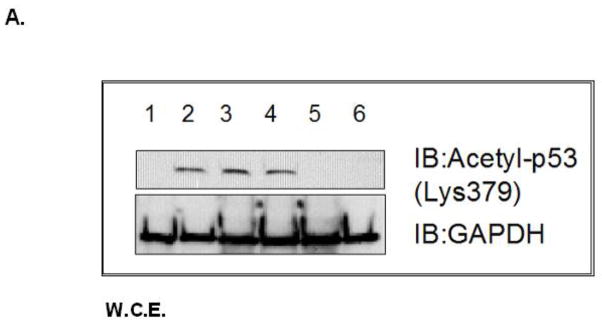

Whole cell lysates from A: Lane 1: p53 null MEF, Lane 2–4: m53-EGFP transfected p53 null MEF (1) untreated (2) rotenone (100 nM, 80 min), (3) PK11195 (4 nM) co-treat, Lane 5–6: c53-EGFP transfected p53 null MEF, (5) untreated, (6) rotenone treated. GAPDH loading control for total cell lysates. B: Quantitation of band intensity for acetyl-p53 (200 kDa band) using p53:GAPDH ratio. *P<0.05 Two-tailed t-test (rotenone vs rotenone w/PK11195 m53-EGFP transfected cells).
3.5. Rotenone treatment decreases mitochondrial sirtuin 3 mRNA and enzyme levels
Previously, we found that rotenone-induced accumulation of NADH is directly linked with mitochondrial p53 function (10). To determine whether endogenous NAD-dependent deacetylase sirtuins are influenced by the presence on p53 and rotenone treatment, we examined mRNA levels of Sirt1 (nuclear) and Sirt3 (mitochondrial) in p53 wild-type (+/+) and p53 null (−/−) MEF cells and treated both cell lines with rotenone (Supplementary Figure 4). Sirt1 transcripts were not altered with rotenone treatment or p53 genotype. However, in p53 +/+ cells, Sirt3 transcript levels decreased (Lane 3). p53 −/− cells had low basal transcript levels of Sirt3. To determine whether rotenone treatment affected SIRT deacetylase activity in p53 +/+ mitoplasts, cells were co-treated with TriA (inhibits Class I and II sirtuins) and rotenone. Mitoplasts were isolated and examined for deacetylase activity. Rotenone (500 nM) decreased SIRT activity however, this was not statistically significant.
4. Discussion
The p53 tumor suppressor protein directly influences mitochondrial function in apoptosis, mitochondrial respiration [24, 29, 30–32] and interaction with the mtDNA genome [23, 25, 33–36]. In this report, we found recombinant p53 targeted to the mitochondrial matrix is rapidly released to the nucleus following mitochondrial dysfunction (with submicromolar rotenone exposure). This event coincided with ROS accumulation and preceded cytochrome c release suggesting an early stress-response pathway. This is supported by DNA damage, caused by gamma irradiation in mouse tissues, induces an “emergency response” whereby, cell fate is rapidly determined by both the nuclear and mitochondrial p53 pathways [37]. Here, translocation of p53 was accompanied by rotenone-induced microtubule disruption, ROS accumulation, and post-translational modifications. Most all of these responses were PK11195-sensitive suggesting a mechanism involving TSPO. Since TSPO mediates various functions involving maintenance of mitochondrial biogenesis, through mechanisms such as mitochondrial permeability transition pore opening and/or mitochondrial respiration, the presence of ligand, PK11195, may influence mitochondrial bioenergetics leading to these responses.
TP53 associates with microtubules and requires a functional microtubule network for nuclear translocation [38]. Since rotenone and colchicine destabilize microtubules [10, 39], our findings suggest that this may be a critical signal for mitochondrial release of p53, which has been shown to be involved in rotenone-induced cell death [40]. Since the effect of colchicine occurred without demonstrable ROS accumulation, suppression by PK11195 may be through an alternative mechanism whereby PK11195 interferes with VDAC permeability and therefore, controls mitochondrial respiration. Mitochondrial depolymerization by colchicine is coupled with changes in inner mitochondrial membrane potential that could be explained by the modulation of VDAC permeability to ATP/ADP and other mitochondrial respiratory substrates caused by tubulin changes in the cytosol [41, 42].
The unique post-translational modifications and changes in post-translational status that accompany the redistribution of p53 from mitochondrion to nucleus are Lys-379 acetylation and Ser-15 phosphorylation, respectively. Phosphorylation on Ser 15 suggests activation of ataxia- telangiectasia mutated (ATM) and ataxia telangiectasia and Rad3 related (ATR) kinases are responsible. It is well known that activation of ATM kinase leads to targets for DNA repair and induction of microRNA biogenesis that ultimately regulates cell cycle checkpoints (43). Previously, we showed that rotenone treatment induced expression of miR-34 in p53 wild-type MEF cells (10). Together these data suggest that ATM kinase is required for p53 phosphorylation and induction of miR-34 expression. These post-translational modifications are consistent with other studies [44, 45]. We may speculate that differential acetylation addresses p53 to a different function in the nucleus that reflects cycling through the mitochondrion. Further studies are needed to confirm this hypothesis.
The presence of higher molecular weight acetylated bands may indicate interactions with other mitochondrial proteins [19, 46]. Our western blot analysis suggests that only the oligomerized form of mitochondrial-p53 observed as a ~200 kDa molecular weight band was acetylated. Nacent p53 is a 53 kDa monomeric tetramer with Zn+ [47], and therefore the 200 kDa band most likely represents a stable p53-tetramer-DNA complex on our immunoblot. Tetramers may provide a docking site for acetyltransferases and subsequent acetylation of p53. The acetylation of p53 could then further stabilize the p53 complex to facilitate recruitment of co-activators leading to transactivation of target genes in the mitochondria. Studies have shown that p53, when localized to the mitochondria, physically interacts with mtDNA to enhance the fidelity of mtDNA synthesis [23, 25]. We showed that Lys-379-acetylated p53 was only found in m53-EGFP transfected untreated and treated cell fractions suggesting that acetylation took place in the mitochondria. However, since the organelle fractions were not independently investigated, the exact site(s) of p53 acetylation is unknown.
Sirtuin-3, a mitochondrial deacetylase, can reversibly bind to and regulate Complex I of the respiratory chain [48] and can assist in p53-mediated effects on cellular senescence [49]. Rotenone treatment decreased Sirt3 levels which may have enabled activation of p53 and this was partially prevented by PK11195. It has been shown that Sirt3 inactivation enhances ROS production and p53 activation which leads to developmental arrest in early embryos [50]. Together, Sirt3 and p53 may be key players in the communication of the mitochondrial stress response, from mitochondria to nucleus, and the presence of PK11195 interrupts this cross-talk between organelles.
5. Conclusion
Release of p53 from the mitochondrion is an early response to mitochondrial dysfunction that can be linked with the MPTP (through TSPO) and microtubule destabilization in MEF cells. Its translocation to the nucleus constitutes a potential RTG signal for mitochondrial dysfunction that may uniquely signal p53-responsive genes in the nucleus. This supports the notion that p53 performs multi-compartmental functions in the cell and implies that it participates in mitochondrial-to-nuclear signaling.
Supplementary Material
Highlights.
Induction of p53 tumor suppressor protein accumulation is an early response to low-level stressors.
To investigate the fate of mitochondrial-sequestered p53, p53-null MEFs were transfected with a p53-EGFP fusion protein led by a mitochondrial import signal (m53-EGFP).
Rotenone exposure triggered m53-EGFP translocation from mitochondrion to nucleus. PK11195 partially suppressed this.
p53 serine phosphorylation or lysine acetylation indicates a different post-translational status of recombinant p53 in the nucleus and mitochondrion.
p53 function mediates a direct signaling pathway from mitochondria to nucleus during mitochondrial dysfunction.
Acknowledgments
The authors would like to thank the previous members of Dr. Knudsen’s laboratory: Amar Singh, Nafeesa Owens, Bruno Ruest, Reetu Singh and Jennifer Case for their contributions to this research.
Funding
This research was supported by the NIH grants RO1-AA13205, RO-1ES09120 and T32-ES07282, and a pilot grant from the University of Louisville Center for Genetics and Molecular Medicine.
Footnotes
Disclaimer: The views expressed in this article are those of the authors and do not necessarily reflect the views or policies of the U.S. Environmental Protection Agency. Mention of trade names or commercial products does not constitute endorsement or recommendation for use.
Conflict of interest statement: None declared.
Author contributions: Conceived and designed the experiments: MLG, TBK. Performed the experiments: MLG. Analyzed the data: MLG, TBK, MMP, RAP. Contributed reagents/materials/analysis tools: MMP, TBK, RAP. Wrote the paper: MLG, TBK.
Publisher's Disclaimer: This is a PDF file of an unedited manuscript that has been accepted for publication. As a service to our customers we are providing this early version of the manuscript. The manuscript will undergo copyediting, typesetting, and review of the resulting proof before it is published in its final citable form. Please note that during the production process errors may be discovered which could affect the content, and all legal disclaimers that apply to the journal pertain.
References
- 1.Gasparre G, Kurelac I, Capristo M, Iommarini L, Ghelli A, Ceccarelli C, Nicoletti G, Nanni P, De Giovanni C, Scotlandi K, Betts C, Carelli V, Lollini P, Romeo G, Rugolo M, Porcelli A. Cancer Res. 2011 Oct 1;71(19):6220–6229. doi: 10.1158/0008-5472.CAN-11-1042. [DOI] [PubMed] [Google Scholar]
- 2.Modica-Napolitano J, Kulawiec M, Singh K. Curr Mol Med. 2007 Feb;(1):121–31. doi: 10.2174/156652407779940495. Review. [DOI] [PubMed] [Google Scholar]
- 3.Larosche I, Lettéron P, Fromenty B, Vadrot N, Abbey-Toby A, Feldmann G, Pessavre D, Mansouri A. J Pharm and Exp Thera. 2007;321(2):526–535. doi: 10.1124/jpet.106.114546. [DOI] [PubMed] [Google Scholar]
- 4.Desouki M, Kulawiec M, Bansal S, Das G, Singh K. Cancer Biol Ther. 2005 Dec;4(12):1367–73. doi: 10.4161/cbt.4.12.2233. [DOI] [PubMed] [Google Scholar]
- 5.Zhou S, Kachhap S, Singh K. Mutagenesis. 2003;18:287–292. doi: 10.1093/mutage/18.3.287. [DOI] [PubMed] [Google Scholar]
- 6.Simonnet H, Alazard N, Pfeiffer K, Gallou C, Béroud C, Demont J, Bouvier R, Schägger H, Godinot C. J Pharmacol Exp Ther. 2007 May 3;21(2):526–35. [Google Scholar]
- 7.Parikh V, Morgan M, Scott R, Clements L, Butow R. Science. 1987;235:576–580. doi: 10.1126/science.3027892. [DOI] [PubMed] [Google Scholar]
- 8.Liao X, Butow R. Cell. 1993;72:61–71. doi: 10.1016/0092-8674(93)90050-z. [DOI] [PubMed] [Google Scholar]
- 9.Jones A, Yao Z, Vicencio J, Karkucinska-Wieckowska A, Szabadkai G. Mitochondrion. 2012 Jan;12(1):88–99. doi: 10.1016/j.mito.2011.09.009. [DOI] [PubMed] [Google Scholar]
- 10.Green M, Singh A, Ruest L, Pisano M, Prough R, Knudsen T. Toxicology. 2011;28:290(1):31–41. doi: 10.1016/j.tox.2011.08.013. [DOI] [PMC free article] [PubMed] [Google Scholar]
- 11.Biswas G, Srinivasan S, Anandatheerthavarda H, Avandhani N. PNAS. 2008;105:186–191. doi: 10.1073/pnas.0706183104. [DOI] [PMC free article] [PubMed] [Google Scholar]
- 12.Amuthan G, Biswas G, Amamdatheerthawarada H, Vijayasarathy C, Shephard H, Avadhani N. Oncogene. 2002;21(51):7839–7849. doi: 10.1038/sj.onc.1205983. [DOI] [PubMed] [Google Scholar]
- 13.Biswas G, Adebanjo OA, Freedman BD, Amamdatheerthawarada HK, Vijayasarathy C, Zaidi M, Kotlikoff M, Avadhani NG. EMBO J. 1999;18(3):522–533. doi: 10.1093/emboj/18.3.522. [DOI] [PMC free article] [PubMed] [Google Scholar]
- 14.Smiraglia D, Kulawiec M, Bistulfi G, Gupta S, Singh K. Cancer Biol Ther. 2001 Aug;7(8):1182–1190. doi: 10.4161/cbt.7.8.6215. [DOI] [PMC free article] [PubMed] [Google Scholar]
- 15.Kulawiec M, Safina A, Desouki M, Still I, Matsui S, Bakin A, Singh K. Cancer Biol Ther. 2008;7(11):1732–1743. doi: 10.4161/cbt.7.11.6729. [DOI] [PMC free article] [PubMed] [Google Scholar]
- 16.Liu J. FEBS Lett. 2008;582:1319–1324. doi: 10.1016/j.febslet.2008.03.013. [DOI] [PMC free article] [PubMed] [Google Scholar]
- 17.Papadopoulos V, Baraldi M, Guilarte T, Knudsen T, Lacapère J, Lindemann P, Norenberg M, Nutt D, Weizman A, Zhang M, Gavish M. Trends Pharmacol Sci. 2006;27:402–409. doi: 10.1016/j.tips.2006.06.005. [DOI] [PubMed] [Google Scholar]
- 18.Charlap J, Donahue R, Knudsen T. Birth Defects Res Part A Clin Mol Teratol. 2003;67:108–115. doi: 10.1002/bdra.10026. [DOI] [PubMed] [Google Scholar]
- 19.Donahue R, Razmara M, Hoek J, Knudsen T. FASEB. 2001;15:635–644. doi: 10.1096/fj.00-0262com. [DOI] [PubMed] [Google Scholar]
- 20.O’Hara M, Charlap J, Craig R, Knudsen T. Teratology. 2002;65:131–144. doi: 10.1002/tera.10028. [DOI] [PubMed] [Google Scholar]
- 21.O’Hara M, Nibbio B, Craig R, Nemeth K, Charlap J, Knudsen T. Reprod Toxicol. 2003;17:365–375. doi: 10.1016/s0890-6238(03)00035-2. [DOI] [PubMed] [Google Scholar]
- 22.Green M, Singh A, Nemeth K, Zhang Y, Knudsen T. Dev Dyn. 2007;236:613–631. doi: 10.1002/dvdy.21048. [DOI] [PubMed] [Google Scholar]
- 23.Bakhanashvili M, Grinberg S, Bonda E, Simon A, Moshitch-Moshkovitz S, Rahav G. Cell Death and Differentiation. 2008;15:1865–1874. doi: 10.1038/cdd.2008.122. [DOI] [PubMed] [Google Scholar]
- 24.Matoba S, Kang J, Patino W, Wragg A, Boehm M, Gavrilova O, Hurley P, Bunz F, Hwang P. Science. 2006;312:1650–1653. doi: 10.1126/science.1126863. [DOI] [PubMed] [Google Scholar]
- 25.Wong T, Rajagopalan S, Townsley F, Freund S, Petrovich M, Loakes D, Fersht A. Nucleic Acid Res. 2009;37:568–581. doi: 10.1093/nar/gkn974. [DOI] [PMC free article] [PubMed] [Google Scholar]
- 26.Saleem A, Adhihetty PJ, Hood DA. Physiol Genomics. 2009;37:58–66. doi: 10.1152/physiolgenomics.90346.2008. [DOI] [PubMed] [Google Scholar]
- 27.Yang D, Wang M, Tang Y, Chen Y, Jiang H, Jones T, Rao K, Brewer G, Singh K, Nie D. Cancer Biol Ther. 2010;9(2):122–133. doi: 10.4161/cbt.9.2.10379. [DOI] [PMC free article] [PubMed] [Google Scholar]
- 28.Giannakakou P, Sackett D, Ward Y, Webster K, Blagosklonny M, Fojo T. Nat Cell Biol. 2000 Oct;2(10):709–717. doi: 10.1038/35036335. [DOI] [PubMed] [Google Scholar]
- 29.Fantin V, St-Pierre J, Leder P. Cancer Cell. 2006;9:425–434. doi: 10.1016/j.ccr.2006.04.023. [DOI] [PubMed] [Google Scholar]
- 30.Ma W, Sung H, Park J, Matoba S, Hwang P. J Bioenerg Biomembr. 2008;39:243–246. doi: 10.1007/s10863-007-9083-0. [DOI] [PubMed] [Google Scholar]
- 31.Polyak K, Xia Y, Zweier J, Kinzler K, Vogelstein B. Nature. 1997;389:300–305. doi: 10.1038/38525. [DOI] [PubMed] [Google Scholar]
- 32.Vaseva A, Moll U. Methods Mol Biol. 2013;962:75–84. doi: 10.1007/978-1-62703-236-0_6. [DOI] [PubMed] [Google Scholar]
- 33.Achanta G, Sasaki R, Feng L, Carew J, Lu W, Peliciano H, Keating MJ, Huang P. EMBO J. 2005;24:3482–3492. doi: 10.1038/sj.emboj.7600819. [DOI] [PMC free article] [PubMed] [Google Scholar]
- 34.Chen D, Yu Z, Zhu Z, Lopez C. Cancer Res. 2003;66:3485–3494. doi: 10.1158/0008-5472.CAN-05-4103. [DOI] [PubMed] [Google Scholar]
- 35.de Souza-Pinto N, Harris C, Bohr V. Oncogene. 2004;23:6559–6568. doi: 10.1038/sj.onc.1207874. [DOI] [PubMed] [Google Scholar]
- 36.Yoshida Y, Izumi H, Torigoe T, Ishiguchi H, Itoh H, Kang D, Kohno K. Cancer Res. 2003;63:3729–3734. [PubMed] [Google Scholar]
- 37.Tian X, Liu F, Zhang X, Li J, Wang W. Plos One. 2012;7(6):e38164. doi: 10.1371/journal.pone.0038164. [DOI] [PMC free article] [PubMed] [Google Scholar]
- 38.Trostel S, Sackett D, Fojo T. Cell Cycle. 2006;5:2253–2259. doi: 10.4161/cc.5.19.3291. [DOI] [PubMed] [Google Scholar]
- 39.Srivastava P, Panda D. FEBS J. 2007;274:4788–4801. doi: 10.1111/j.1742-4658.2007.06004.x. [DOI] [PubMed] [Google Scholar]
- 40.Goncalves A, Maximo V, Lima J, Singh K, Soares P, Videira A. Biochim Biophys Acta. 2011;1813(3):492–499. doi: 10.1016/j.bbamcr.2011.01.006. [DOI] [PMC free article] [PubMed] [Google Scholar]
- 41.Maldonado EN, Patnaik J, Mullins MR, Lemasters J. Cancer Res. 2011;70:10192–10201. doi: 10.1158/0008-5472.CAN-10-2429. [DOI] [PMC free article] [PubMed] [Google Scholar]
- 42.Sheldon K, Maldonado E, Lemasters J, Rostovtseva T, Bezrukov S. Plos One. 2011;6(10):e25539. doi: 10.1371/journal.pone.0025539. [DOI] [PMC free article] [PubMed] [Google Scholar]
- 43.Zhang X, Wan G, Berger F, He X, Lu X. Mol Cell. 2011;41(4):371–383. doi: 10.1016/j.molcel.2011.01.020. [DOI] [PMC free article] [PubMed] [Google Scholar]
- 44.Riley T, Sontag E, Chen P, Levine A. Nature Rev Mol Cell Biol. 2008;9:402–412. doi: 10.1038/nrm2395. [DOI] [PubMed] [Google Scholar]
- 45.Nemajerova A, Erster S, Moll U. Cell Death and Differentiation. 2005;12:197–200. doi: 10.1038/sj.cdd.4401526. [DOI] [PubMed] [Google Scholar]
- 46.Itahana Y, Ke H, Zhang YJ. Biol Chem. 2008;7:3641–3646. doi: 10.4161/cc.7.23.7105. [DOI] [PubMed] [Google Scholar]
- 47.Cho Y, Gorina S, Jeffery P, Pavletich N. Science. 1994;265:346–355. doi: 10.1126/science.8023157. [DOI] [PubMed] [Google Scholar]
- 48.Ahn B, Kim H, Song S, Lee I, Liu J, Vassilopoulos A, Deng C, Finkel T. PNAS. 2008;105:14447–14452. doi: 10.1073/pnas.0803790105. [DOI] [PMC free article] [PubMed] [Google Scholar]
- 49.Li S, Banck M, Mujtaba S, Zhou M, Sugrue M, Walsh M. Plos One. 2010;5:1–12. doi: 10.1371/journal.pone.0010486. [DOI] [PMC free article] [PubMed] [Google Scholar]
- 50.Kawamura Y, Uchijima Y, Horike N, Tonami K, Nishiyama K, Amano T, Asano T, Kurihara Y, Kurihara H. J of Clin Invest. 2010;120(8):2817–2827. doi: 10.1172/JCI42020. [DOI] [PMC free article] [PubMed] [Google Scholar]
Associated Data
This section collects any data citations, data availability statements, or supplementary materials included in this article.