

Abstract
Water dynamics at the surface of two homologous proteins with different thermal resistances is found to be unaffected by the different underlying amino-acid compositions, and when proteins are folded it responds similarly to temperature variations. Upon unfolding the water dynamics slowdown with respect to bulk decreases of a factor of two. Our findings are explained by the dominant topological perturbation induced by the protein on the water hydrogen bond dynamics.
1 Introduction
Proteins from thermophilic organisms are stable and function at very high temperatures, up to 100 °C. The molecular origins of such resistance -very appealing for chemical processing and biotechnology- are still unknown1,2. It is now widely accepted that the enhanced stability as compared to the mesophilic counterparts does not originate from a single mechanism. Putative stabilizing factors include the high number of salt-bridges and hydrogen bonds (HB)3,4, the efficient hydrophobic packing as well as the strong coupling with the solvent1. While intramolecular forces have been largely studied, much less is known about the role of hydration in thermal stabilization5,6.
Buried water molecules detected in crystal structures are thought to stabilize key regions in thermostable proteins by extending the intramolecular HB networks7-9 or filling inter-nal cavities10. Moreover, thermophilic proteins are generally enriched in charged amino-acids that form strong HBs with the solvent at the protein surface. These interactions may prevent water penetration in the hydrophobic core and avoid the early steps of unfolding11. It was recently demonstrated that enhanced protein stability can be achieved by optimizing the interactions between charged amino-acids at the protein surface12. Bulk and interfacial water molecules play an indirect role on the stability of intramolecular interactions too, e.g. salt-bridges were suggested to be stronger at high temperature because the lower value of water dielectric constant reduces the desolvation penalty3,13,14. The role of hydration on protein stability has been also addressed for another class of extremophiles, the halophilic proteins that resist to high salt concentration (see15 and refs within).
It is hard to discern the most important mechanism involving water for protein stability6. We note that a shift of ~50 K in the protein melting temperature is associated to a difference in unfolding free energies as small as a few kcal/mol which in turn corresponds to a few extra HBs6. Therefore a systematic study on the role of hydration on the stability of thermophiles is essential.
Here we start by focusing on the effect of protein composition, conformation and temperature on the average hydration dynamics of two homologous proteins: the mesophilic (Escherichia coli) and hyperthermophilic (Sulfolobus solfataricus, SS) variants of the G-domain of the Elongation Factor-Thermo unstable (EF-Tu) and -1α. The EF-Tu controls the delivering of aminoacyl-tRNA to the ribosome during protein synthesis in prokaryotes, a process energized by the GTPase reaction occurring in the G-domain. The E.Coli and SS G-domains are stable and functional at very different temperatures, e.g. half guanosine diphosphate (GDP) binding activity is measured at about 41°C and 84 °C for the mesophile16 and the hyperthermophile17, respectively. While as shown in Figure 1 the two G-domains share a similar structure, their sequence identity is rather low, 34% and the hyperthermophilic variant is enriched in charged (mostly basic) amino-acids, ~ 30% vs ~ 23%. The surplus of positively charged amino-acids is a common property of hyperthermophiles18. These domains are a good case study since i) their stability gap is very large, ~40 °C, ii) their folds contain both α and β structures and are representative of the G protein superfamily, iii) they are part of multi-domain proteins with a similar stability gap (~ 50 °C) to which they will be compared in a future investigation of the stability of inter-domains interfaces1,14,19, and finally iv) EF-Tu is considered a potential target for a new generation of antibiotics20.
Fig. 1.

Superimposition of the two G-domains showing the high degree of structural homology (left panel), the two proteins share the same globular shape with some structural differences (two helices insertion at the N- terminus, a small helix insertion at mid sequence and a loop insertion at the C- terminus of the hyperthermophile11). The surface of the two proteins shows specific characters as graphically represented in the right panel figures. Amino acid chemical groups are colored according to their HB propensity: charged HB acceptor (red), charged HB donor (blue), neutral HB acceptor (orange), neutral HB donor (cyan), and apolar (white).
The two proteins have been studied by extended molecular dynamics simulations in a wide range of temperatures between 300 K and 360 K. Water translational and rotational dynamics were investigated21, and HB dynamics was rationalized via analytic modeling22,23.
Anticipating our main result, we found that for the folded state the average water dynamics at the protein surface is not affected by the different amino acid compositions of the two proteins and responds similarly to a temperature increase. The dynamics of water within the hydration shell is retarded by a factor between 3 and 5, depending on the specific motion being considered, and this slowdown factor is comparable to what has been previously computed21,23 and measured24 for other globular proteins. This weak perturbation is suggested to be a common feature of globular proteins because it is mostly caused by an excluded volume effect on the water HB reorientation23. For this reason, when we modeled the unfolded mesophilic protein in an extended conformation -therefore reducing the local confinement-the interfacial water slowdown decreased by a factor of two.
The remainder of the article is organized as follows: In section 2 we describe the computational protocol of the simulations as well as the tools used to analyze the water dynamics, in section 3 we discuss the results obtained for hydration water translational and rotational motions, HB dynamics and its analytical modeling. We end the manuscript with brief concluding remarks.
2 Methods
2.1 Computer simulations
2.1.1 System preparation
We have simulated by classical Molecular Dynamics two homologous proteins exhibiting different thermal stabilities: the G-domain of the E.Coli EF-Tu and the SS EF-1α. The G-domain is the part of the protein where the guanosine triphosphate (GTP) is hydrolyzed in GDP. The G-domains were extracted from the crystallographic structures of the proteins (PDB codes 1EFC and 1SKQ for the mesophilic and the hyperthermophilic protein, respectively). The two domains have been previously simulated for a short time (4-10 ns)11. The final protein configurations extracted at the end of the trajectories at 300 K were solvated in a larger simulation box containing water and counter-ions to neutralize the systems. The larger number of water molecules allows to avoid finite-size effects on protein stability and hydration. The mesophilic domain (196 aa) was solvated with 7440 water molecules and the hyperthermophilic one (226 aa) with 10673. New simulations were performed at temperatures of 300 K, 330 K and 360 K and P=1 atm for about 260 ns. These simulations are part of a long term effort aimed at the investigation of the long-time dynamics, stability and eventual unfolding of these homologous proteins. In order to sample the soft modes of the proteins and their response to temperature we combined the charmm22 force field25,26 for the protein and the TIP3P water model for which charm22 was originally developed25. The results of this investigation will be presented in future works.
In order to study the effect of protein composition, protein conformation and temperature on water dynamics, four representative configurations separated from each other by at least 20 ns were extracted from each of these long trajectories and used as starting points for new simulations, see 2.1.2. The relative distance between each pair of configurations is measured through the root mean square displacement (RMSD) which lies in the 2.0-4.5 A range at 300 K and increases to 4-8Å at the higher temperatures. It is worth noting that the configurations sampled at high temperature are still representative of the folded state, since the unfolding of the mesophilic domain is observed only on a longer time scale (μs).
2.1.2 The MD protocol
Since in the present study we are especially interested in the dynamics of water, we chose to use the SPC/E model27, which was shown to provide a very good description of water dynamics28,29. In contrast, at ambient temperature, the TIP3P model predicts translational and rotational dynamics which are approximately twice faster than those determined experimentally21.
Each configuration was equilibrated for 2 ns in the NPT ensemble followed by a 2-ns production run in the NVT ensemble. In order to improve the accuracy of the activation energies for the translational and rotational water motions (see Figure 2), four additional simulations were performed at T=310K, 320K, 340K and 350K for both proteins. We also studied water dynamics close to the fully unfolded mesophilic G-domain. To obtain the completely unfolded random coil structure, the simulation temperature was raised to T=700 K. After the complete unfolding, the protein was solvated using 86,136 water molecules. After a short equilibration, 2 ns of production runs in the NVT ensemble were performed at a series of temperatures comprised between 300 and 360 K.
Fig. 2.

Top Panel: characteristic times of water translational motion (τT). Bottom Panel: characteristic times of reorientational motion computed using the water dipole moment μ (τR). The arrows indicate the temperature transition between the folded and unfolded states in the mesophilic protein. The red circles refer to the hyperthermophilic domain (H), the blue circles refer to the mesophilic domain (M) and the open blue circles refer to the unfolded model of M (Munf).
We used the NAMD software package30 to run the simulations. The NVT ensemble was sampled using the Langevin algorithm with a frictional frequency of 1 ps−1 and the trajectories were integrated with a time-step of 1 fs. Configurations were saved every 200 fs. Analyses were performed with inhouse developed codes.
2.2 Analysis of results
2.2.1 Translational and rotational dynamics
The translation and reorientation dynamics were calculated for the water molecules in the hydration layer of the protein. The hydration layer is defined as including all water molecules whose oxygen atom lies within 4.5Å from any heavy atom of the protein. This definition was verified to give very similar results to others commonly used, including e.g. a) an atom-dependent radial cut-off and b) Voronoi-cell based hydration shell construction21. The water translational dynamics in the hydration shell was measured by computing the mean square displacement . Since water translation close to protein surfaces shows a rather strong sub-diffusive transient character, we have characterized this motion by computing the time τT needed for a water to cover a distance of 3Å, a typical water molecular length-scale.
To characterize the reorientation dynamics we have computed the time correlation function (tcf):
| (1) |
where θ(t) is the angle formed between the water dipole at times τ and τ + t and whose relaxation time is τR. The characteristic time (τR) for the average water reorientation in the hydration shell is computed by fitting the time correlation function decay using a stretched exponential function21, the parameters of the fitting are reported in ESI.
2.2.2 Extended Jump Model
Laage and Hynes22 suggested that water reorientation is not a diffusive process but occurs mainly via large angular jumps caused by a hydrogen bond (HB) exchange event. The non diffusive path is combined with a minor diffusive contribution that describes the reorientation of the local frame of a water OH bond occurring between successive jumps. The extended jump model (EJM) reorientation time is calculated as22
| (2) |
The jump contribution is given by
| (3) |
The jump time, τ jump, is defined as the time to replace one stable HB acceptor by another stable HB acceptor and it corresponds to the inverse rate constant for the HB acceptor exchange reaction. The frame reorientation is instead defined as the characteristic time of the water OH bonds reorientation between successive jumps22. The jump angle is close to 70° in pure water and is evaluated following the reactive path of the HB exchange process. The EJM reorientation time reproduces the characteristic time for reorientation directly computed via MD simulation using eq. 1 and following the water OH bonds dynamics (τMDR). Further details are given in refs22,23,31. Within the protein hydration shell, the water OH bonds can be conveniently separated into three distinct ensembles: i) water OH lying next to a hydrophobic protein group and donating a HB to another water, ii) water OH receiving a HB from a protein HB donor group and donating a HB to another water, iii) water OH donating a HB to a protein HB acceptor group. The HB formed by water with an acceptor a is defined geometrically using rather tight criteria on the Ow-Oa distance (d≤3.2Å), and the angle (θ ≤ 20°). The proximity to a hydrophobic group is based on a radial cut-off (rc=4.4Å). These criteria are used to compute the τ jump for the water OHs near HB acceptor, HB donor and hydrophobic groups. Moreover, for each site the local τMDR is extracted using an exponential fit of the tcf in eq. 1 and requiring for the water molecules to verify at t = 0 the tight criteria listed above. Since in this study we are interested in the effect of the protein amino-acid composition we limited the calculations to amino-acid side-chains.
2.2.3 The Transition State free energy terms
The kinetics of the water HB exchange mechanism is determined by the free-energy barrier separating the reactant and the product states. The perturbation of this kinetics with respect to the pure water situation can be estimated using a Transition State picture. It was shown that the ratio can be predicted on the basis of two solute features, the first one measuring the hindrance to the water reorientation caused by the presence of the solute, and the second one estimating the strength of the HB that should be broken in order to activate the rotation. We detail below how to compute such contributions.
2.2.3.1 Excluded Volume Factor
The transition state excluded volume (TSEV) slowdown is determined32 from thefraction f of transition state (TS) locations excluded by the presence of the solute
| (4) |
This factor is determined for each protein site by calculating32f as the fraction of transition state locations which overlap with the protein.
2.2.3.2 Hydrogen-Bond Strength Factor
The TransitionState Hydrogen Bond (TSHB) factor is given by33
| (5) |
where is the free energy cost to stretch the initial HB with a protein (or with a water) HB acceptor to its TS length, computed from the potential of mean force (pmf) along the acceptor–water oxygen distance. The pmf is calculated for each HB acceptor protein site following the procedure described in refs23,33.
Our analytical model is expected to provide robust results with respect to the water force field used in simulations. The flexible and polarizable model Amoeba and SPC/E give qualitatively similar results at ambient temperature28 for the water jump mechanism and kinetics. Recently it was also shown by ab-initio MD simulations34,35 that the water-water HB strength is not affected by the proximity with a small apolar solute and that the excluded volume picture holds. Explicitly considering the water polarization may lead to a strengthening of the few HB with charged protein HB acceptor sites36. However, on the basis of previous results on lysozyme23 no qualitative change is expected.
3 Results and Discussion
3.1 Translational and rotational dynamics
In this section we focus on the average dynamics of water in the hydration shell. Crucially, the data reveal that the water roto-translational dynamics is insensitive to protein composition as previously suggested by NMR measurements15,24, and exhibits an Arrhenius behavior with temperature. Figure 2 displays the translational and rotational relaxation times of water averaged over the hydration shell, τT determined from the mean square displacement and τR calculated from the second order reorientation time correlation function for the water dipole μ (see Sec. 2.2.1). In both cases the value of the tcfs at time t were computed by considering the contribution from water molecules continuously present in the hydration shell for the interval t. The uncertainty determined at each temperature from 4 independent trajectories is between 2 and 5%. This small variability suggests that the differences between protein conformations, representative of substates of the folded basin, have a weak impact on the average water dynamics. However, as we discuss later in the text, we have verified that around individual amino-acids water motion experiences rather important fluctuations coupled to the amino-acids conformations. The apparent activation energy for τT is approximately Ea=4.4 kcal/mol for both proteins. Comparable energies are obtained for the reorientation of the water dipole, 4.0 kcal/mol. We define the translational and rotational slowdown factors relative to the bulk situation as where are respectively the translational and rotational relaxation times in pure water. At room temperature, both ρT and ρR are approximately 5, in agreement with previous simulations and experiments on globular proteins21,23,24. The reorientation time correlation function was computed also using the vector orthogonal to the water plane and we obtained very similar results, as reported in ESI.
Since the mesophilic protein unfolds at high temperature the water dynamics was also monitored around a conformation modeling the unfolded state. This random-coil weakly perturbs the solvent motion and both retardation factors drop from approximately 5 to respectively ρT =2.9 and ρR=2.3. A weak perturbation of water dynamics at ambient temperature was recently measured by NMR for the unfolded state of a halophilic-like small protein15 (ρ ~ 2) and by THz spectroscopy for the irreversible unfolded human serum albumin37. When a protein extends to the random-coil state upon unfolding, the superficial pockets and clefts that hinder water motion23 disappear and the water dynamics is less perturbed, and resembles more that observed for isolated amino-acids33. However this finding may lack generality since the unfolded state might be different from a random-coil depending on other factors, e.g. if protein aggregation occurs a fraction of hydration water could be confined in the aggregates slowing down the average dynamics.
3.2 Water reorientation and HB dynamics
While the average water dynamics is not affected by the different amino-acid compositions of the two G-domains, the dynamics of water next to a specific site probably depends on the chemical nature of this site. It was recently shown by two of us23 that the elementary step of water reorientation at a protein surface, similarly to the bulk behavior, is not diffusive and is more correctly described by the Extended Jump Model22(EJM). According to EJM water reorients mainly via a HB exchange mechanism with sudden large angular jumps. We have successfully tested EJM for the mesophilic G-domain at room temperature and verified that the main contribution to water reorientation comes from the HB exchange. Since the main contribution to water reorientation comes from jump HB exchanges, we hereafter restrain our attention to this mechanism23.
The jump and frame times as well as the jump angle were computed for HB exchange events near each individual protein site classified according to its type, HB acceptor, donor and hydrophobic groups, respectively. For each site, the EJM reorientational time was compared to the time directly computed via MD showing good agreement. For about 80% of the water in the hydration shell the relative error was less than 20% (see ESI-Fig.2).
Figure 3 reports the distribution of the retardation factor obtained for the jump time with respect to the bulk analogue. The distributions obtained for the two proteins are both strikingly similar to that obtained for lysozyme in a prior study23, and they do not noticeably change with temperature. A Gaussian peak centered at a mild retardation factor, ρ jump ≃ 1-2, is followed by a power law decay extending at larger ρ jump value. The average retardation computed from the distribution is < ρ jump >~ 2.7 – 3.0 for both proteins. The retardation factor calculated for each site at T=300 K is mapped onto the protein surfaces, see Fig. 4. We observe a rather uniform distribution of mild retardations for both domains, isolated spots associated to slow water dynamics are individuated in superficial pockets or at the edge of the binding site.
Fig. 3.

Probability distribution of the retardation factor for the jump time with respect to the bulk. Left chart: comparison of retardation factor distributions for the mesophilic and hyperthermophilic proteins at T=300 K. The dashed line is a guide to the eye for the distribution for H system. The right panels show the distributions for M (top) and H (bottom) at different temperatures.
Fig. 4.

The mapping of the retardation factor ρ jump onto the surface of the two proteins is showed on the top panels, E.coli G-domain on the left, and SS G-domain on the right, respectively. The surface is almost uniformly characterized by a mild slowdown ρ jump < 5. The hyperthermophilic protein shows a somewhat higher number of localized sites with high slowdown value mainly caused by the presence of local clefts and pockets. The lower panels show the location of the internal water molecules filling a common protein cavity.
To compute the average < ρ jump > we have excluded the water molecules that have jump times longer than 100 ps whose statistics is poor. The contribution of these molecules is negligible for the mesophile but it increases the average retardation by about 16-30% for some conformations of the hyperthermophile. This finding suggests that a difference in the hydration between the two proteins, if any, should be found in the behavior of a few water molecules buried in the protein structure. These water molecules penetrated surface clefts, generally at the interface between different secondary structures but their locations vary depending on the conformation and the temperature. We have however individuated a cavity filled by several water molecules that is common between the two domains, see lower panels of Fig. 4. A detailed investigation of the behavior of these molecules and their contribution to protein stability is reserved to future work.
We note that the effect of the water molecules with long residence times present in the tail of the distribution could be probed by NMR experiments38. Moreover, the rate of water exchange from the interior of the protein to the bulk and its temperature dependence provide a valuable indirect information on the conformational landscape of the protein, as pioneered in the analysis of NMR experiments39 and MD simulations40,41, therefore providing a new key to investigating the contribution of protein flexibility to stability6,42-45.
3.3 The effect of local conformational states
Although the average hydration dynamics is rather insensitive to the different conformations of the protein in the folded state, water reorientational dynamics exhibits significant variability in specific locations. In Figure 5 we separately report for HB acceptor, donor and hydrophobic sites the range of τ jump values determined from the four independent trajectories generated at T=300 K for the two proteins. The sites that show the larger variability are generally at the interface between adjacent secondary structures and loops or form ion-pairs. The fluctuations in the reorientation dynamics are caused by a different degree of confinement due to local rearrangement of the protein matrix (open/close fluctuations of superficial cleft or pocket). Despite the structural homology, the water dynamics variability is differently partitioned in the two proteins mirroring a specific distribution of rigid and flexible regions. This feature could be checked experimentally by 2D IR spectroscopy and using an ad-hoc probe linked to different protein regions46.
Fig. 5.

Effect of local conformation on the jump time estimated as averaged over the four independent trajectories (300K). The vertical bar represents the range of jump times for each site. The top panel refers to the mesophilic protein and the bottom panel to the hyperthermophilic protein.
3.4 The molecular origin of water slowdown
We now investigate the physical origin of the water slowdown with respect to the bulk. Following previous studies23,33, the reorientational slowdown can be ascribed to the protein excluded volume inhibiting the HB exchange mechanism, and to an energetic contribution coming from the strength of the HBs formed by water with protein HB acceptor sites. Therefore, we decompose the free energy barrier for the jump mechanism in a geometrical (transition state excluded volume factor, TSEV) and an energetic (transition state hydrogen bond strength factor, TSHB) contribution, whose details are given in 2.2.3 and23. According to the TSEV/TSHB decomposition, the time for a jump event is predicted to be , where is the jump time in pure water. In Figure 6 we report the TSHB and TSEV factors for the HB acceptors (left panel), HB donors and hydrophobes (right panel).
Fig. 6.
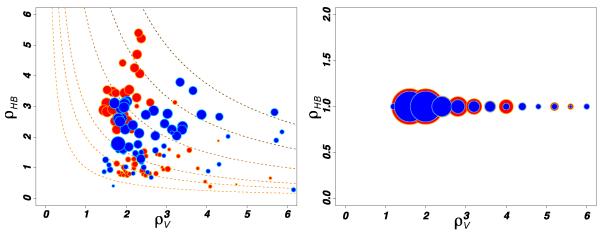
Distributions of the retardation factors, ρV and ρHB for acceptor (left), and donor and hydrophobic (right) sites. The data are extracted from simulations at T=300 K for both the hyperthermophilic (red) and mesophilic (blue) proteins. The area of each disk is proportional to the square root of the water population associated to each site. Dashed lines in the panel represent curves at ρV*ρHB = c for different values of c.
The data in Figure 6 indicate that the mesophilic and the hyperthermophilic proteins perturb the hydration layer in a very similar way. The majority of water molecules in the hydration shell is retarded because of a mild excluded volume effect ρV ~1.5-3.0 caused by HB donor and hydrophobic sites. Although 90% of water molecules HBonded to protein acceptor groups lie in the tail of the distribution of retardation factor (ρ jump > 3) they represent only a minor fraction of the whole hydration shell, 12% for the hyperthermophile and 16% for the mesophile, see ESI. For HB donors and hydrophobes only 16-18% of waters contributes to the tail of the distribution (ρ jump > 3). Including explicitly polarization effect in the simulation36 would stretch the tail of the slowdown distribution without a qualitative change.
The cumulative contribution of the three groups to the distribution of retardation factors is highlighted in Figure 7. This result explains why the difference in the amino-acid composition between the two G-domains does not affect the average hydration dynamics that is mainly controlled by a geometric excluded volume effect mostly associated to apolar groups. Apolar CHx groups are present in the side-chain of every amino-acid and constitute the majority of the sites accessible to water. This causes, on average, a weak slowdown of water dynamics: a conserved common feature among proteins of globular shape24. Such an effect is strongly reduced for an unfolded protein in extended conformation because of the change in the local topology, where confined sites occur much less frequently. It is worth highlighting that collective processes involving hydration water could be more sensitive to surface chemistry as recently suggested by ultrafast optical Kerr effect spectroscopy47. Interestingly the effect of surface chemistry could also be investigated by using neutron spectroscopy and focusing on THz vibrational dynamics48.
Fig. 7.

The probability distribution of the retardation factor is decomposed as the cumulated sum of contributions from hydrophobic (green), HB donor (blue), and HB acceptor (red) groups. The top panel refers to the mesophilic protein, the lower panel refers to the hyperthermophilic protein.
4 Conclusion
In conclusion, we have shown that the average hydration dynamics of two homologous proteins is not affected by their different amino-acid compositions because it is mostly controlled by a similar geometrical perturbation. In addition, our analysis also indicates that potentially important differences should be found in the behavior of a small set of buried waters that reorient slowly compared to the bulk. Further investigations are required to unveil whether this and other hydration properties are important for thermostability. These studies should include the free-energy contribution to protein stability of buried and interfacial water molecules and the water dielectric response at the protein interface and its effect on the stability of ion-pairs.
Supplementary Material
5 Acknowledgments
The research leading to these results has received funding from the European Research Council under the European Communitys Seventh Framework Programme (FP7/2007-2013) Grant Agreement no.258748. We are grateful to Caspur-HPC for generous allocation of cpu-time (std11-426) and CINECA ISCRA grants: KINPROT HP10B86HLY and FLEXPROT HP10BTJ4LQ.
Footnotes
Electronic Supplementary Information (ESI) available: Supplementary informations for Figures 2, 3 and 6. See DOI: 10.1039/b000000x/
References
- 1.Vieille C, Zeikus GJ. Microbiol Mol Biol Rev. 2001;65:1–43. doi: 10.1128/MMBR.65.1.1-43.2001. [DOI] [PMC free article] [PubMed] [Google Scholar]
- 2.Feller G. J Phys: Condens Matter. 2010;22:323101. doi: 10.1088/0953-8984/22/32/323101. [DOI] [PubMed] [Google Scholar]
- 3.Xiao L, Honig B. J Mol Biol. 1999;289:1435–44. doi: 10.1006/jmbi.1999.2810. [DOI] [PubMed] [Google Scholar]
- 4.Chan C-H, Yu T-H, Wong K-B. PLoS ONE. 2011;6:e21624. doi: 10.1371/journal.pone.0021624. [DOI] [PMC free article] [PubMed] [Google Scholar]
- 5.Sen S, Milsson L, editors. Thermostable Proteins. CRC Press; 2012. [Google Scholar]
- 6.Sterpone F, Melchionna S. Chem Soc Rev. 2012;41:1665–1676. doi: 10.1039/c1cs15199a. [DOI] [PMC free article] [PubMed] [Google Scholar]
- 7.S Macedo-Ribeiro, Darimont B, Sterner R, Huber R. Structure. 1996;4:1291–1301. doi: 10.1016/s0969-2126(96)00137-2. [DOI] [PubMed] [Google Scholar]
- 8.Chi Y-I, Martinez-Cruz LA, Jancarik J, Swanson RV, Robertson DE, Kim S-H. FEBS Lett. 1999;445 doi: 10.1016/s0014-5793(99)00090-3. year. [DOI] [PubMed] [Google Scholar]
- 9.Ahmad S, Kamal MZ, Sankaranarayanan R, Rao NM. J Mol Biol. 2008;381:324–40. doi: 10.1016/j.jmb.2008.05.063. [DOI] [PubMed] [Google Scholar]
- 10.Yin H, Hummer G, Rasaiah JC. J Am Chem Soc. 2007;129:7369–77. doi: 10.1021/ja070456h. [DOI] [PubMed] [Google Scholar]
- 11.Sterpone F, Bertonati C, Briganti G, Melchionna S. J Phys Chem B. 2009;113:131–7. doi: 10.1021/jp805199c. [DOI] [PubMed] [Google Scholar]
- 12.Gribenko AV, Patel MM, Liu J, McCallum SA, Wang C, Makhatadze GI. Proc Natl Acad Sci U S A. 2009;106:2601–6. doi: 10.1073/pnas.0808220106. [DOI] [PMC free article] [PubMed] [Google Scholar]
- 13.Elcock AH. J Mol Biol. 1998;284:489–502. doi: 10.1006/jmbi.1998.2159. [DOI] [PubMed] [Google Scholar]
- 14.Salari R, Chong LT. J Phys Chem B. 2012;116:2561–2567. doi: 10.1021/jp210172b. [DOI] [PubMed] [Google Scholar]
- 15.Qvist J, Ortega G, Tadeo X, Millet O, Halle B. J Phys Chem B. 2012;116:3436–3444. doi: 10.1021/jp3000569. [DOI] [PubMed] [Google Scholar]
- 16.Jensen M, Cool R, Mortensen K, Clark B, Parmeggiani A. Eur. J. Biochm. 1989;182:247–255. doi: 10.1111/j.1432-1033.1989.tb14824.x. [DOI] [PubMed] [Google Scholar]
- 17.B. V., Adinolfi B, A. P., Arcucci A, Dello Russo A, De Vendittis E, Ianniciello G, Masullo M, Raimo G. Biochimie. 1998;80:895–898. doi: 10.1016/s0300-9084(00)88885-9. [DOI] [PubMed] [Google Scholar]
- 18.Berezovsky IN, Chen WW, Choi PJ, Shakhnovich EI. PLoS Comput Biol. 2005;1:e47. doi: 10.1371/journal.pcbi.0010047. [DOI] [PMC free article] [PubMed] [Google Scholar]
- 19.Karshikoff A, Ladenstein R. Trends Biochem Sci. 2001;26:550–6. doi: 10.1016/s0968-0004(01)01918-1. [DOI] [PubMed] [Google Scholar]
- 20.Kavaliauskas D, Nissen P, Knudsen CR. Biochemistry. 2012;51:2642–2651. doi: 10.1021/bi300077s. [DOI] [PubMed] [Google Scholar]
- 21.Marchi M, Sterpone F, Ceccarelli M. J Am Chem Soc. 2002;124:6787–91. doi: 10.1021/ja025905m. [DOI] [PubMed] [Google Scholar]
- 22.Laage D, Hynes JT. Science. 2006;311:832–5. doi: 10.1126/science.1122154. [DOI] [PubMed] [Google Scholar]
- 23.Sterpone F, Stirnemann G, Laage D. J Am Chem Soc. 2012;134:4116–4119. doi: 10.1021/ja3007897. [DOI] [PubMed] [Google Scholar]
- 24.Halle B. Philos Trans R Soc Lond B Biol Sci. 2004;359:1207–23. doi: 10.1098/rstb.2004.1499. [DOI] [PMC free article] [PubMed] [Google Scholar]
- 25.MacKerell AD, Bashford D, Bellott R, Dunbrack L, Evanseck JD, Field MJ, Fischer S, Gao J, Guo H, Ha S, Joseph-McCarthy D, Kuchnir L, Kuczera K, Lau FTK, Mattos C, Michnick S, Ngo T, Nguyen DT, Prodhom B, Reiher WE, Roux B, Schlenkrich M, Smith JC, Stote R, Straub J, Watanabe M, Wiórkiewicz-Kuczera J, Yin D, Karplus M. J Phys Chem B. 1998;102:3586–3616. doi: 10.1021/jp973084f. [DOI] [PubMed] [Google Scholar]
- 26.MacKerell AD, Feig M, Brooks CL., III J Comput Chem. 2004;25:1400–1415. doi: 10.1002/jcc.20065. [DOI] [PubMed] [Google Scholar]
- 27.Berendsen HJC, Grigera JR, Straatsma TP. J Phys Chem. 1987;91:6269–6271. [Google Scholar]
- 28.Laage D, Hynes JT. J Phys Chem B. 2008;112:14230–14242. doi: 10.1021/jp805217u. [DOI] [PubMed] [Google Scholar]
- 29.Roberts ST, Loparo JJ, Tokmakoff A, Fayer MD, Skinner JL. Chem Phys. 2007;341:143. [Google Scholar]
- 30.James C P, Wang RBW, Gumbart J, Tajkhorshid E, Villa E, Skeel CCRD, Kalé L, Schulten K. J Comp Chem. 2005;26:1781–1802. doi: 10.1002/jcc.20289. [DOI] [PMC free article] [PubMed] [Google Scholar]
- 31.Laage D, Stirnemann G, Sterpone F, Rey R, JT JH. Ann Rev Phys Chem. 2011;62:395–416. doi: 10.1146/annurev.physchem.012809.103503. [DOI] [PubMed] [Google Scholar]
- 32.Laage D, Stirnemann G, Hynes JT. J Phys Chem B. 2009;113:2428–2435. doi: 10.1021/jp809521t. [DOI] [PubMed] [Google Scholar]
- 33.Sterpone F, Stirnemann G, Hynes JT, Laage D. J Phys Chem B. 2010;114:2083–9. doi: 10.1021/jp9119793. [DOI] [PubMed] [Google Scholar]
- 34.Rossato L, Rossetto F, Silvestrelli PL. J Phys Chem B. 2012;116:4552–4560. doi: 10.1021/jp300774z. [DOI] [PubMed] [Google Scholar]
- 35.Montagna M, Sterpone F, Guidoni L. J Phys Chem B. 2012;116:11695–11700. doi: 10.1021/jp303213m. [DOI] [PMC free article] [PubMed] [Google Scholar]
- 36.Xu H, Stern HA, Berne B. J Phys Chem B. 2002;106:2054–2060. [Google Scholar]
- 37.Luong T, Quan V, Promad K, Mitra R, Havenith M. Biophys J. 2011;101:925–933. doi: 10.1016/j.bpj.2011.05.011. [DOI] [PMC free article] [PubMed] [Google Scholar]
- 38.Mattea C, Qvist J, Halle B. Biophys J. 2008;95:2951–63. doi: 10.1529/biophysj.108.135194. [DOI] [PMC free article] [PubMed] [Google Scholar]
- 39.Denisov1 VP, Peters J, Hörlein HD, Halle B. Nat Struct Mol Biol. 1996;3:505–509. doi: 10.1038/nsb0696-505. [DOI] [PubMed] [Google Scholar]
- 40.García AE, Hummer G. Proteins. 2000;38:261–72. [PubMed] [Google Scholar]
- 41.Sterpone F, Ceccarelli M, Marchi M. J Mol Biol. 2001;311:409–19. doi: 10.1006/jmbi.2001.4860. [DOI] [PubMed] [Google Scholar]
- 42.Hernandez G, Jenney FE, Adams MWW, LeMaster DM. Proc Natl Acad Sci USA. 2000;97:3166–3170. doi: 10.1073/pnas.040569697. [DOI] [PMC free article] [PubMed] [Google Scholar]
- 43.Jaenicke R. Proc. Natl. Acad. Sci. USA. 2000;97:2962–2964. doi: 10.1073/pnas.97.7.2962. [DOI] [PMC free article] [PubMed] [Google Scholar]
- 44.Lazaridis T, Lee I, Karplus M. Protein Science. 1997;6:2589–2605. doi: 10.1002/pro.5560061211. [DOI] [PMC free article] [PubMed] [Google Scholar]
- 45.Wintrode PL, Zhang D, Vaidehi N, Arnold FH, Goddard WA., III J Mol Biol. 2003;327:745–757. doi: 10.1016/s0022-2836(03)00147-5. [DOI] [PubMed] [Google Scholar]
- 46.King JT, Kubarych KJ. J Am Chem Soc. 2012;134:18705–18712. doi: 10.1021/ja307401r. [DOI] [PubMed] [Google Scholar]
- 47.Mazur K, Heisler IA, Meech SR. J Phys Chem A. 2012;116:2678–2685. doi: 10.1021/jp2074539. [DOI] [PubMed] [Google Scholar]
- 48.Orecchini A, Paciaroni A, Francesco AD, Petrillo C, Sacchetti F. J Am Chem Soc. 2009;131:4664–4669. doi: 10.1021/ja807957p. [DOI] [PubMed] [Google Scholar]
Associated Data
This section collects any data citations, data availability statements, or supplementary materials included in this article.