

Abstract
Background
Metabolic disorders with visceral obesity have become a major medical problem associated with the development of hypertension, type 2 diabetes, and dyslipidemia and, ultimately, life‐threatening cardiovascular and renal diseases. Adipose tissue dysfunction has been proposed as the cause of visceral obesity‐related metabolic disorders, moving the tissue toward a proinflammatory phenotype.
Methods and Results
Here we first report that adipose tissues from patients and mice with metabolic disorders exhibit decreased expression of ATRAP/Agtrap, which is a specific binding modulator of the angiotensin II type 1 receptor, despite its abundant expression in adipose tissues from normal human and control mice. Subsequently, to examine a functional role of ATRAP in the pathophysiology of metabolic disorders, we produced homozygous ATRAP deficient (Agtrap−/−) mice, which exhibited largely normal physiological phenotype at baseline. Under dietary high fat loading, Agtrap−/− mice displayed systemic metabolic dysfunction, characterized by an increased accumulation of pad fat, hypertension, dyslipidemia, and insulin resistance, along with adipose tissue inflammation. Conversely, subcutaneous transplantation of donor fat pads overexpressing ATRAP derived from Agtrap transgenic mice to Agtrap−/− recipient mice improved the systemic metabolic dysfunction.
Conclusions
These results demonstrate that Agtrap−/− mice are an effective model of metabolic disorders with visceral obesity and constitute evidence that ATRAP plays a protective role against insulin resistance, suggesting a new therapeutic target in metabolic disorders. Identification of ATRAP as a novel receptor binding modulator of adipose tissue inflammation not only has cardiovascular significance but may have generalized implication in the regulation of tissue function.
Keywords: adipocyte, angiotensin receptor, inflammation, insulin resistance, transplantation
Introduction
Presently, patients with metabolic disorders with visceral obesity are increasing worldwide. One common metabolic phenotypic change is reported to be systemic insulin resistance, and the chronic activation of an inflammatory response in adipose tissue is suggested to contribute to the development of systemic insulin resistance in visceral obesity.1–3 However, the pathological molecular mechanisms involved in the interplay between the chronic inflammation of adipose tissue and metabolic disorders with visceral obesity have not been fully elucidated, and it is critically important to generate model mice with human‐like metabolic syndrome, which is principally provoked by environmental factors such as dietary high caloric loading.
The excessive activation of the renin‐angiotensin system (RAS), a system that regulates both cardiovascular and body fluid homeostasis, has been implicated in the development of obesity‐related metabolic disorders, such as type 2 diabetes mellitus (T2DM), hypertension, and dyslipidemia.4–5 At local tissue sites, RAS acts through the production of the bioactive molecule angiotensin II (Ang II), and the Ang II type 1 receptor (AT1R) is the main receptor subtype. We have previously identified the AT1R‐associated protein (ATRAP/Agtrap) as a directly interacting molecule with the carboxyl‐terminal domain of AT1R,6–7 and previous studies showed that ATRAP promotes constitutive internalization of the AT1R so as to inhibit the pathological activation of its downstream signaling but preserve physiological signaling activity.8–11
In the present study, we showed that both patients and mice with metabolic disorders exhibited decreases in the adipose expression of ATRAP without any significant changes in adipose AT1R expression. In addition, animals with a genetic disruption of the Agtrap gene displayed a largely normal physiological phenotype under standard diet but developed metabolic disorders on dietary high fat (HF) loading. Together with the metabolic functional rescue by a transplantation of fat overexpressing ATRAP into Agtrap−/− mice, this result revealed that the suppression of ATRAP expression in local adipose tissue is critically involved in the development of metabolic disorders with visceral obesity. The results of these analyses suggest that Agtrap−/− mice can serve as a model of human metabolic syndrome induced by dietary loading and suggest a novel protective role of ATRAP in the pathogenesis of metabolic disorders with visceral obesity, and hence the therapeutic potential of ATRAP.
Materials and Methods
This study was performed in accordance with the National Institutes of Health (NIH) “Guide for the Care and Use of Laboratory Animals.” All of the animal studies were reviewed and approved by the Animal Studies Committee of Yokohama City University. For gene expression analyses in human tissues, written informed consent was obtained from all patients, and the study was approved by the Human Ethics Review Committee of Yokohama City University Graduate School of Medicine.
Human Total RNA in Normal Tissues
We purchased commercially available normal human total RNAs from either Takara Bio Inc or Wako Pure Chemical for the analysis of ATRAP and AT1R mRNA expression in normal human tissues. According to the description in the instruction sheets of these purchased RNAs, total RNAs were extracted from normal tissues of the brain (No. R1234035‐50; Wako Pure Chemical), heart (No. R1234122‐50; Wako Pure Chemical), liver (No. 636531; Takara Bio Inc), fat (No. 636558; Takara Bio Inc), skeletal muscle (No. 636534; Takara Bio Inc), and kidney (No. R1234142‐50; Wako Pure Chemical), which were derived from pooled donors. For example, with respect to human adipose tissues, total RNAs were derived from a variety of donors (n=18) pooled from male and female whites aged 21 to 61, whose cause of death was trauma or sudden death.
Visceral Adipose Tissues From Patients
Visceral adipose tissues from patients undergoing abdominal surgery, such as early‐stage gastric or colon cancer, were obtained from 36 Japanese patients and used for the analysis of ATRAP and AT1R mRNA expression using a real‐time quantitative RT‐PCR method. Among the patients analyzed, the serum triglyceride level was measured in 28 patients (21 men and 7 women). Written informed consent was obtained from all patients, and this study was approved by the Human Ethics Review Committee of Yokohama City University Graduate School of Medicine.
Animals
The animals were housed in a controlled environment with a 12‐hour light‐dark cycle and were allowed free access to food and water. They were fed either a standard diet (SD, 3.6 kcal/g; 13.3% energy as fat; Oriental MF, Oriental Yeast Co, Ltd) or an HF diet (HFD, 5.6 kcal/g; 60.0% energy as fat) for 6 weeks beginning at 7 weeks of age. Body weight and food intake were recorded weekly throughout the experimental period. In the KKAy mice study, male KKAy mice were purchased from Clea Japan. This study was performed in accordance with the NIH guidelines for the use of experimental animals. All of the animal studies were reviewed and approved by the Animal Studies Committee of Yokohama City University.
Targeted Disruption of the Gene Encoding ATRAP/Agtrap in C57BL6 Mice
To construct the targeting vector for disruption of the Agtrap gene, a neomycin resistance gene was substituted for exons 3, 4, and 5 in the coding region of the Agtrap gene (Figure 1A). The vector contained 4.6‐kb 5′ and 4.7‐kb 3′ homology arms. At the 5′ terminus of the homologous region, the phosphoglycerate kinase 1‐thymidine kinase gene was inserted to negatively select for random integrations. The Agtrap targeting vector was linearized and electroporated into RENKA (C57BL/6) embryonic stem cells, and G418‐resistant clones were screened for homologous recombination by Southern blot analysis (Figure 1B). Eleven independent cell lines of 288 G418‐resistant cells underwent homologous recombination at the Agtrap locus. Chimeric mice were generated by injecting these positive clones into ICR 8‐cell embryos, and 1 clone gave rise to germline transmission. After confirmation of the transmission of the mutations into germ cells, the heterozygous mice were intercrossed to produce homozygous offspring, and mutation at the Agtrap locus was identified by Southern blot analysis, using probe A of the tail DNA from the F1 offspring (Figure 1C).
Figure 1.

Targeted disruption of the gene encoding ATRAP/Agtrap. A, Schematic representation of the gene‐targeting strategy. Top, partial restriction map of the Agtrap locus. Middle, the targeting vector used to disrupt the Agtrap gene. Bottom, the expected mutant locus. B, Southern blot analysis of ES cell DNA. Genomic DNA extracted from the wild‐type (WT) and targeted ES cell clones was digested with EcoRI (top) and BamHI (bottom), electrophoresed, and blotted. The hybridization probes used were A and B (ie, probes located inside the targeting vector and neo probe, respectively). Digestion with EcoRI gave a 6.5‐kb band for the WT allele and an 8.7‐kb band for the mutated allele, whereas digestion with BamHI gave an 8.0‐kb and 9.0‐kb band, respectively. C, Southern blot analysis of a representative litter derived from a heterozygous intercross. Genomic DNAs isolated from the tail of WT (+/+) and heterozygous (+/−) as well as homozygous (−/−) mutant mice were digested with EcoRI, electrophoresed, and blotted. Fragments obtained from WT (6.5 kb) and targeted alleles (8.7 kb) were detected by probe A. D, Representative immunoblots for ATRAP protein expression in tissues of WT (+/+) mice and homozygous (−/−) mutant mice. ATRAP indicates angiotensin II type 1 receptor–associated protein; neor, the neomycin resistance gene; PGKp‐TK, phosphoglycerate kinase 1‐thymidine kinase; eWAT, epididymal white adipose tissue; ES, embryonic stem.
Heterozygous mice were backcrossed with C57BL/6 for 2 generations and then intercrossed (hetero×hetero) to obtain homozygous Agtrap−/− mice, a result that was confirmed by PCR‐based genotyping. Of the 257 offspring analyzed, 58 (23%) were homozygous for the disrupted allele, and 61 (24%) were the Agtrap+/+ (WT) mice, indicating normal embryonic development of the homozygous mutant mice. The results of immunoblot analysis showed substantial expression of ATRAP protein in tissues of WT Agtrap+/+ mice, whereas the protein expression of ATRAP was not detected in tissues of homozygous Agtrap−/− mice (Figure 1D). All experiments in this study were performed with the Agtrap−/− mice and their Agtrap+/+ littermates.
Biochemical Assay
Blood samples were obtained by cardiac puncture at the time mice were sacrificed in the fed state, unless otherwise stated. Enzymatic assay kits were used for the determination of plasma glucose, glycoalbumin, free fatty acids, triglycerides, and total cholesterol (Wako Pure Chemical). Plasma insulin concentrations were measured with a commercially available ELISA kit (Morinaga).
Glucose Tolerance Test and Insulin Tolerance Test (ITT)
Glucose tolerance test (GTT) was performed in 13‐week‐old male mice after 16‐hour fasting. Blood glucose concentrations were measured with a blood glucose test meter (Glutest Neo Super; Sanwa‐Kagaku) using blood samples taken from the tail tip at baseline and at 30, 60, and 120 minutes after the intraperitoneal injection of glucose (1 g/kg body weight). For insulin tolerance test (ITT), insulin (0.7 U/kg body weight in 0.1% BSA; Humulin R‐Insulin; Eli Lilly & Co, Kobe, Japan) was administered via intraperitoneal injection after 1‐hour fasting. Blood glucose concentrations were measured 0 minutes before and 30 and 60 minutes after the injection. GTT and ITT were performed 7 days apart.
Blood Pressure Measurement
Systolic blood pressure was measured noninvasively by the tail‐cuff method (MK‐2000 BP monitor; Muromachi Kikai Co). The MK‐2000 BP monitor made it possible to measure blood pressure without preheating the animals and anesthesia, thus avoiding very stressful condition.12 At least 8 readings were taken for each measurement.
Histological Analysis
The epididymal white adipose tissue was isolated and fixed with 10% paraformaldehyde overnight and embedded in paraffin. Tissue sections were stained with hematoxylin and eosin for cell size determination. Paraffin sections of white adipose tissue were also stained with an antibody against F4/80 (rat monoclonal; Abcam). Briefly, antigen retrieval was performed by microwave heating and endogenous reactive molecules were quenched by peroxidase blocking reagent (DAKO). Then, the sections were incubated with monoclonal anti‐F4/80 antibody (diluted 1:10) at room temperature for 2 hours, followed by Histofine Simple Stain Max PO (Nichirei Bioscience Inc). Antibody binding was visualized with 3,3′‐diaminobenzidine (DAB) using a detection kit (Nichirei Bioscience Inc), and all sections were counterstained with hematoxylin. The adipocyte diameter and area were quantified using Image‐Pro Plus software, and F4/80‐positive nuclei were counted in low‐powered fields.
Fat Transplantation
In the fat transplantation experiments,13 6‐week‐old male Agtrap−/− mice were used as recipients. Donor epididymal fat pads were removed from sex‐matched Agtrap−/−, WT Agtrap+/+, or Agtrap transgenic (Tg19) mice (6 to 11 weeks of age). The generation and characterization of Agtrap transgenic (Tg64 and Tg19) mice carrying the hemagglutinin (HA)‐tagged mouse ATRAP cDNA have been described previously.14 The donor fat pads were cut into 100‐ to 200‐mg pieces and kept in saline until transplantation. Small incisions were made on the back of each anesthetized recipient mouse, and a total of 900 mg of fat pad tissue (5 pieces of the donor fat pads 3 cm apart from one another) was implanted subcutaneously (ie, below the skin on the back of recipient mouse). One week after transplantation surgery, the recipient mice were fed an HF diet (5.6 kcal/g; 60.0% energy as fat; Oriental MF, Oriental Yeast Co Ltd) for 6 weeks, and the endogenous epididymal adipose tissues of the recipient mice were harvested for analysis of adipose tissue weight.
Real‐time Quantitative RT‐PCR Analysis
Total RNA was extracted from epididymal adipose tissue with ISOGEN (Nippon Gene), and cDNA was synthesized using the SuperScript III First‐Strand System (Invitrogen). Real‐time quantitative RT‐PCR was performed with an ABI PRISM 7000 Sequence Detection System by incubating the reverse transcription product with TaqMan PCR Master Mix and a designed Taqman probe (Applied Biosystems), essentially as described previously.15 The mRNA levels were normalized to those of the 18S rRNA control. The primer sequences used are shown in Table 1.
Table 1.
Primer Sequences and Taqman Assay ID for Real‐time Quantitative RT‐PCR Analysis
| Gene Name | Forward Primer Reverse Primer Probe |
|---|---|
| Human AT1R | 5′‐GGGGCGCGGGTGTATTTG‐3′ 5′‐TTCAGTAGAAGAGTTGAGAATCATTTTG3‐′ 5′‐AGTGTTTGCAACAAATTCGACCCAGGTGA3‐′ |
| Gene Name | Taqman Assay ID |
|---|---|
| Human ATRAP | Hs01564425_m1 |
| Mice AT1R | Mm00616371_m1 |
| Mice ATRAP | Mm00507771_m1 |
| Mice MCP‐1 | Mm00441242_m1 |
| Mice IL6 | Mm00446190_m1 |
| Mice TNFα | Mm00443258_m1 |
| Mice PAI‐1 | Mm00435860_m1 |
| Mice CD68 | Mm03047343_m1 |
| Mice F4/80 | Mm00802529_m1 |
Immunoblot Analysis
A 14–amino acid synthetic peptide corresponding to amino acids 148 to 161 of the carboxyl‐terminal tail of mouse (DBA/2J) ATRAP was used for the generation of a polyclonal anti‐ATRAP antibody.6 The characterization and specificity of the anti‐ATRAP antibody were described previously.14,16–17 For immunoblot analysis, the total protein was extracted from adipose tissues of Agtrap+/+ (WT) and Agtrap transgenic (Tg64 and Tg19) mice with SDS‐containing sample buffer, and the protein concentration of each sample was measured with a DC protein assay kit (Bio‐Rad) using BSA as the standard. Equal amounts of protein extract from the tissue samples were fractionated on a polyacrylamide gel (ATTO), then transferred to a polyvinylidene difluoride (PVDF) membrane using the iBlot Dry Blotting System (Invitrogen). Membranes were blocked for 1 hour at room temperature with phosphate‐buffered saline containing 5% skim milk powder and probed overnight at 4°C with the anti‐ATRAP antibody diluted at 1:1000. Then, the membranes were washed and incubated with the anti‐rabbit secondary antibody diluted at 1:300 for 40 minutes at room temperature. After they were washed, the sites of the antibody–antigen reaction were visualized by enhanced chemiluminescence substrate (GE Healthcare). The images were quantitated using a FUJI LAS3000 Image Analyzer (FUJI Film).
Statistical Analysis
All data are shown as mean±SEM. Differences were analyzed by Student's unpaired t test or ANOVA followed by the Newman–Keuls multiple‐comparison test. Two‐way ANOVA was used for analysis of data that are measured longitudinally from the same mouse. Kruskal–Wallis test with Dunn post‐hoc test was used for analysis of small sample size. A P value of <0.05 was considered statistically significant.
Results
ATRAP Is Abundantly Expressed in Adipose Tissue but Decreased in Metabolic Disorders in Humans
Both ATRAP and AT1R mRNA were abundantly expressed in normal human adipose tissue from pooled donors (Figure 2A and 2B). To examine whether the dynamic balance of the endogenous expression of ATRAP and AT1R in adipose tissue is modulated in metabolic disorders in humans, visceral adipose tissues were obtained from 36 patients during abdominal surgery (Table 2). We divided these patients into 2 groups using the 4 metabolic parameters (hypertension, obesity, diabetes, and hypertriglyceridemia) using the criteria of Japanese Society of Internal Medicine for the diagnosis of metabolic syndrome.18 Interestingly, we found that the expression of ATRAP mRNA was significantly decreased in the adipose tissue from hypertensive patients compared with normotensive patients (0.55±0.07 versus 1.00±0.16, P=0.031; Figure 2C). Similar trends of decrease in adipose ATRAP mRNA expression were observed in patients with obesity and diabetes (Figure 2C). On the other hand, the adipose AT1R mRNA levels in patients with these metabolic disorders were the same as those in patients without respective metabolic disorders (Figure 2D).
Figure 2.
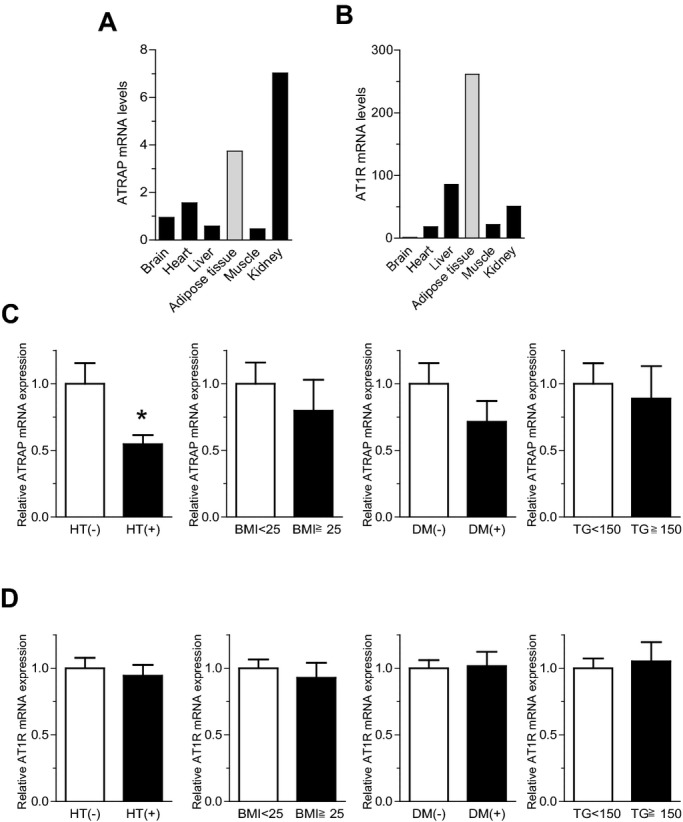
ATRAP is abundantly expressed in normal adipose tissues, but decreased in adipose tissues with metabolic disorders. A, Tissue distribution of ATRAP mRNA in normal human subjects (pooled donors). B, Tissue distribution of AT1R mRNA in normal human subjects (pooled donors). In A and B, ATRAP and AT1R mRNA levels were analyzed by quantitative RT‐PCR. Values were normalized relative to the level of 18S rRNA control. C, Comparison of the ATRAP mRNA levels in human visceral adipose tissue according to the presence or absence of metabolic disorders. D, Comparison of the AT1R mRNA levels in human visceral adipose tissue according to the presence or absence of metabolic disorders. In C and D, patients were divided into 2 groups using 4 metabolic parameters: HT, hypertension (n=15) or nonhypertension (n=21); obesity (BMI≥25, n=6) or nonobesity (BMI<25, n=30); diabetes (DM) (n=5) or nondiabetes (n=31); and hypertriglyceridemia (TG≥150, n=10) or nonhypertriglyceridemia (TG<150, n=18). Values are normalized relative to the level of 18S rRNA control and expressed relative to those achieved with RNA from patients without respective metabolic disorders. Data are shown as mean±SEM. *P<0.05 vs patients without respective metabolic disorders (t test). ATRAP indicates angiotensin II type 1 receptor‐associated protein; AT1R, angiotensin II type 1 receptor; BMI, body mass index; TG, triglycerides.
Table 2.
Profile of Patients
| Total (N=36) | Male (n=28) | Female (n=8) | |
|---|---|---|---|
| Sex, n male/female | 28/8 | 28/0 | 0/8 |
| Age, y | 65.6±1.7 | 66.1±2.0 | 64.0±3.3 |
| SBP, mm Hg | 125±3 | 125±3 | 122±4 |
| DBP, mm Hg | 74±2 | 74±2 | 77±2 |
| BMI, kg/m2 | 22.5±0.5 | 22.7±0.7 | 22.0±0.6 |
| Hypertension, n | 15 | 12 | 3 |
| Obesity (BMI≥25), n | 6 | 6 | 0 |
| Diabetes mellitus, n | 5 | 4 | 1 |
| Hyperlipidemia (triglycerides ≥150), n | 10 | 8 | 2 |
All of the values are mean±SEM or number of patients. SBP and DBP indicate systolic and diastolic blood pressure, respectively; BMI, body mass index.
ATRAP Expression in Adipose Tissue Is Decreased in Mice With Metabolic Dysfunction
To analyze metabolic disorder–related change in the balance of the endogenous expression of ATRAP and AT1R in the adipose tissue of mice as well, we examined ATRAP and AT1R gene expression in the adipose tissues from genetically obese diabetic KKAy mice, a model of T2DM without any dietary loading. Although the ATRAP mRNA was abundantly expressed in adipose tissue of the control C57BL6 mice (Figure 3A), the adipose ATRAP mRNA expression was significantly decreased in 13‐week‐old male KKAy mice compared with control mice (0.40±0.02 versus 1.00±0.07, P<0.0001; Figure 3B). On the other hand, the adipose AT1R mRNA expression did not differ between KKAy mice and control mice (Figure 3C), which was consistent with the results observed in the adipose tissue of patients with metabolic disorders. The finding that adipose ATRAP expression was decreased in metabolic disorders both in humans and in diabetic mice prompted us to hypothesize that a decrease in ATRAP expression in local adipose tissue is involved in the pathogenesis of metabolic disorders with visceral obesity.
Figure 3.
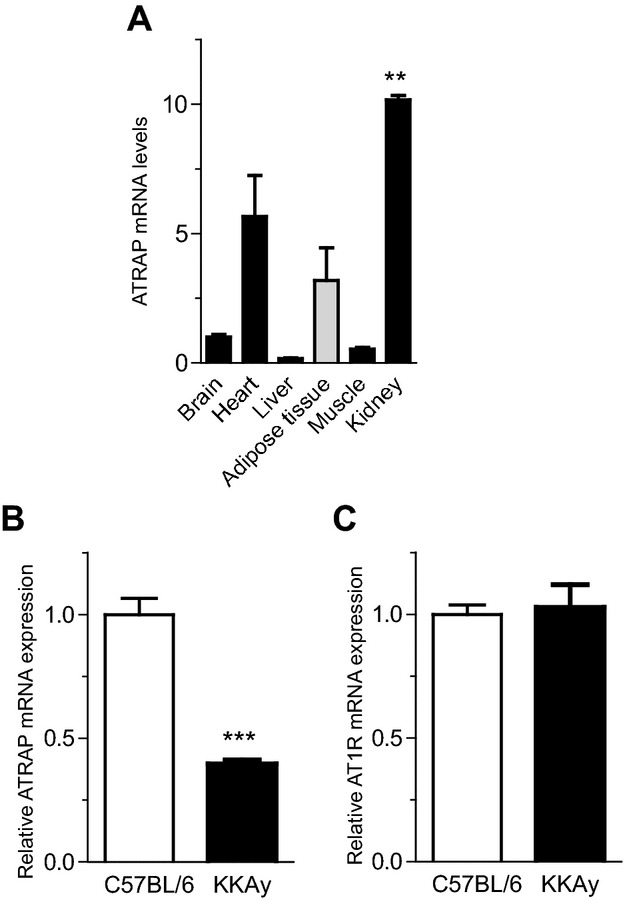
ATRAP is abundantly expressed in adipose tissues in control C57BL/6 mice but decreased with metabolic dysfunction. A, Tissue distribution of ATRAP mRNA in control C57BL/6 mice. The mRNA amounts were quantified with real‐time RT‐PCR, using the total RNA extracted from tissues of C57BL/6 mice (n=3). Values are normalized relative to the level of the 18S rRNA control and expressed relative to those achieved with RNA from brain. Data are shown as mean±SEM. **P<0.01 between kidney and liver (Kruskal–Wallis test). B, Expression of ATRAP mRNA in epididymal white adipose tissue in KKAy mice. C, Expression of AT1R mRNA in epididymal white adipose tissue in KKAy mice. In B and C, values are normalized relative to the level of 18S rRNA control and expressed relative to those achieved with RNA from control C57BL/6. Data are shown as mean±SEM. ***P<0.0001 vs control C57BL/6 mice; n=8 in each group (t test). ATRAP indicates angiotensin II type 1 receptor–associated protein; AT1R, angiotensin II type 1 receptor.
ATRAP Deficiency Causes an Increase in Blood Pressure and Adipocyte Hypertrophy in Response to Dietary HF Loading
To examine the hypothesis that a decrease in adipose ATRAP expression is associated with the development of metabolic disorders, we next generated mice with mutations in Agtrap (Figure 1A through 1C). Agtrap−/− mice at baseline displayed no evident anatomical abnormality or alteration in physiological parameters (Table 3). This is in striking contrast to the genetic inactivation of other RAS components, such as angiotensinogen, rennin, and AT1R. These RAS‐inactivated mice exhibited significant decreases in blood pressure, as well as alterations in renal morphology and function, compared with WT mice, even at baseline.19–22 We also examined whether there was any change in AT1R expression in the adipose tissue of Agtrap−/− mice, and Agtrap−/− mice exhibited comparable AT1R mRNA expression in the epididymal adipose tissue with WT Agtrap+/+ mice (relative AT1R mRNA level, 1.00±0.08 versus 0.78±0.14, P=0.176, n=7 to 8).
Table 3.
Blood Pressure (BP), Heart Rate (HR), Body Weight (BW), and Tissue Weight at 13 Weeks in Agtrap+/+ (WT) and Agtrap−/− (KO) Mice on Standard Diet (SD) and High‐Fat Diet (HFD)
| Variable | WT | KO | ||
|---|---|---|---|---|
| SD | HFD | SD | HFD | |
| SBP, mm Hg | 119±2 | 125±3 | 119±3 | 133±3a |
| HR, bpm | 714±13 | 755±6a | 736±3 | 762±8a |
| BW, g | 21.8±0.5 | 30.3±0.5a | 21.2±0.5 | 32.6±1.1a |
| WAT weight, mg | ||||
| Epididymal WAT | 228±15 | 1112±89b | 233±16 | 1376±115b,c |
| Mesenteric WAT | 195±12 | 357±29b | 197±11 | 421±37b |
| WAT weight/BW,% | ||||
| Epididymal WAT | 1.1±0.1 | 3.8±0.2b | 1.1±0.1 | 4.4±0.3b,c |
| Mesenteric WAT | 0.9±0.1 | 1.2±0.1a | 0.9±0.1 | 1.3±0.1b |
| Liver weight, mg | 871±40 | 853±18 | 941±37 | 966±43 |
All of the values are means±sem (n=6 to 8). BP indicates blood pressure; HR heart tate; BW, body weight; WT, Agtrap+/+; KO, Agtrap−/−; SD, standard diet; HFD, high‐fat diet; SBP, the systolic BP by the tail cuff method; WAT, white adipose tissue.
aP<0.05, bP<0.01 vs SD within the same group, cP<0.05 vs WT on the same diet (ANOVA).
Next, to examine a functional role of ATRAP in the modulation of the metabolic phenotype under pathological environmental stimuli, we used a dietary HF loading in Agtrap−/− mice. Although the HF diet caused significantly greater weight gain by the end of the 6‐week period only in the Agtrap−/− mice (Table 3 and Figure 4A), body weight, change in body weight, and food intake did not significantly differ between the 2 groups (Figure 4A through 4C). On the other hand, the epididymal fat weight of Agtrap−/− mice fed a HF diet was increased compared with that of their WT littermates, whereas there was no significant difference in mesenteric fat weight (Table 3). With respect to the regulation of blood pressure, only Agtrap−/− mice exhibited a significant elevation of blood pressure on HF loading (Table 3). Since ATRAP was highly expressed in the adipose tissue of WT mice and there was a decrease in adipose ATRAP expression in diabetic KKAy mice, we examined whether there was any phenotypic alteration in the adipose tissue of Agtrap−/− mice under HF loading, and Agtrap−/− mice indeed had significantly larger adipocytes in the epididymal adipose tissue than WT Agtrap+/+ mice (diameter, 96.6±5.2 versus 79.2±3.0 μm, P=0.048; area, 8100±863 versus 5340±393 μm2, P=0.046; Figure 4D).
Figure 4.
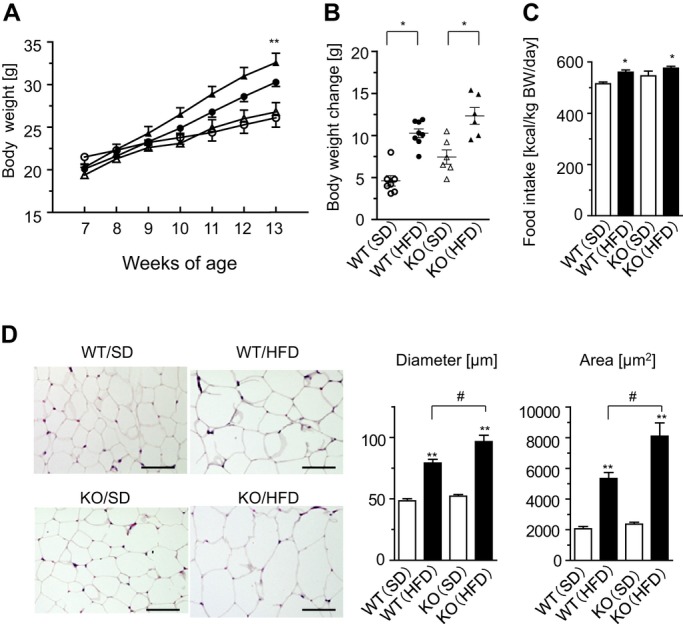
ATRAP deficiency causes adipocyte hypertrophy in response to HF loading. A, Growth curve of Agtrap+/+ (WT) and Agtrap−/− (KO) mice on either standard diet (SD) or HF diet (HFD). WT (○) and KO (Δ) mice on SD, and WT (●) and KO (▲) mice on HFD are shown. Data are shown as mean±SEM. *P<0.05, **P<0.01 vs SD; n=6 to 8 (2‐way ANOVA). B, Body weight change in WT and KO mice on either SD or HFD. WT (○) and KO (Δ) mice on SD, and WT (●) and KO (▲) mice on HFD are shown. Data are shown as means±SEM. *P<0.05 vs SD; n=6 to 8 (ANOVA). C, Daily food intake. Data are shown as mean±SEM. *P<0.05 vs SD; n=6 to 8 (ANOVA). D, Left, histological analysis of epididymal adipose tissue sections stained with hematoxylin and eosin (H&E) in each experimental group. Original magnification, ×200. Scale bar=50 μm. Right, adipocyte diameter and area. Data are shown as mean±SEM. **P<0.01 vs SD within the same group; #P<0.05 vs WT mice on the same diet; n=7 to 8 (ANOVA). ATRAP indicates angiotensin II type 1 receptor–associated protein; HF, high fat.
ATRAP Deficiency Causes Insulin Resistance in Response to HF Loading
Since there was evident dietary HF loading–mediated enlargement of adipocytes in Agtrap−/− mice, we next examined the patterns of glucose and lipid metabolism, which are suggested to be closely associated with adipose tissue function,23–24 using blood samples obtained by cardiac puncture at the time mice were sacrificed (Figure 5A). Nonfasting blood glucose did not differ significantly between Agtrap−/− mice and WT Agtrap+/+ mice. However, Agtrap−/− mice fed HFD showed a significant increase in the nonfasting plasma insulin concentration compared with WT littermates (2.87±0.26 versus 1.89±0.19 ng/mL, P=0.049). In addition, only Agtrap−/− mice showed a significant increase in plasma glycated albumin on HFD (2.73±0.12% versus 2.06±0.19%, P=0.035). In regard to lipid metabolism, Agtrap−/− mice fed either SD or HFD exhibited a significant increase in plasma free fatty acids compared with WT mice (SD, 628±57 versus 437±64 μEq/L, P=0.045; HFD, 784±128 versus 465±56 μEq/L, P=0.045), whereas the total cholesterol level did not differ. The fasting triglyceride level in Agtrap−/− mice was also significantly higher than that in WT mice even on SD (30.1±2.8 versus 21.4±1.6 mg/dL, P=0.035). These results suggest that ATRAP deficiency causes insulin resistance and an increase in circulating free fatty acids with a concomitant increase in visceral adipose tissues.
Figure 5.
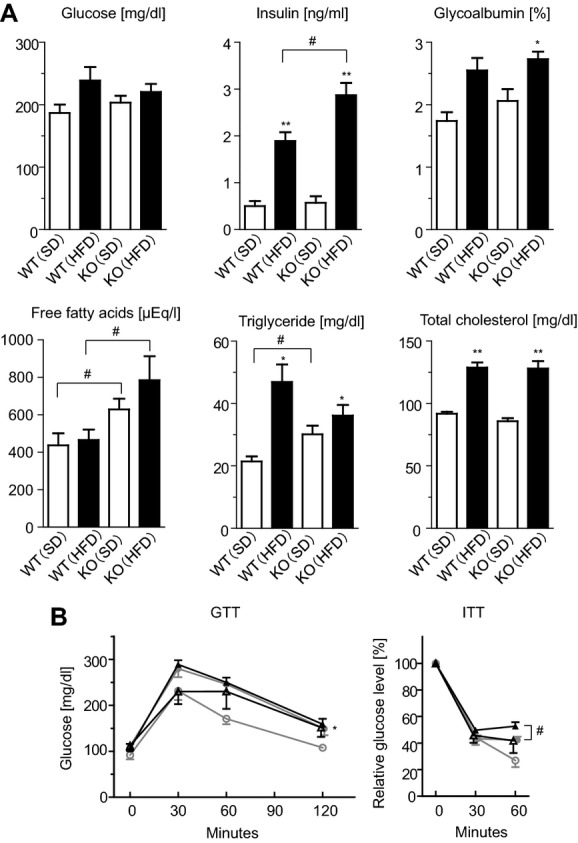
ATRAP deficiency causes insulin resistance in response to HF loading. A, Nonfasting blood glucose and plasma insulin concentrations (n=6 to 13). The other blood parameters are fasting samples at 13 weeks of age (n=7 to 12). Data are shown as mean±SEM. *P<0.05, **P<0.01 vs SD within the same group; #P<0.05 vs Agtrap+/+ (WT) mice on the same diet (ANOVA). B, The glucose tolerance test (GTT) and insulin tolerance test (ITT). WT (○) and Agtrap−/− (KO) (Δ) mice on SD, and WT (●) and KO (▲) mice on HFD are shown. Data are shown as mean±SEM. *P<0.05, **P<0.01 vs SD within the same group; #P<0.05 vs WT mice on the same diet; n=6 to 10 (2‐way ANOVA). ATRAP indicates angiotensin II type 1 receptor–associated protein; HF, high fat.
To further examine effects of ATRAP deficiency on insulin sensitivity, we performed GTT and ITT, which reflect insulin secretion and resistance, respectively (Figure 5B). There were no significant differences between Agtrap−/− mice and WT Agtrap+/+ mice on the same diet in terms of GTT (blood glucose concentration; SD, 151.7±20.2 versus 107.7±6.6 mg/dL, F=1.874, P=0.198; HFD, 158.7±12.0 versus 149.3±14.4 mg/dL, F=0.061, P=0.808). On the other hand, the results of ITT showed that the glucose‐lowering effect of insulin was significantly impaired in Agtrap−/− mice on HFD compared with WT Agtrap+/+ mice (relative glucose level; SD, 41.8±9.3% versus 26.9±5.0%, F=1.247, P=0.290; HFD, 52.7±3.0% versus 42.3±2.5%, F=7.200, P=0.016) (Figure 5B). These results support the conclusion that ATRAP deficiency is closely associated with insulin resistance.
ATRAP Deficiency Exacerbates Inflammatory Responses in Adipose Tissue in Response to HF Loading
We investigated possible changes in adipocytokine production and found that the HF loading–mediated upregulation of MCP‐1, a key player in the inflammatory process,25–26 was exacerbated in the adipose tissue of Agtrap−/− mice compared with WT Agtrap+/+ mice (Figure 6A). On the other hand, the HF loading–mediated increase in IL‐6 expression did not reach the statistical significance in the adipose tissue of Agtrap−/− mice and no significant changes were observed in TNFα or PAI‐1. Because MCP‐1 contributes to the macrophage recruitment in inflamed adipose tissue, we next examined macrophage‐related gene expression and macrophage infiltration.
Figure 6.
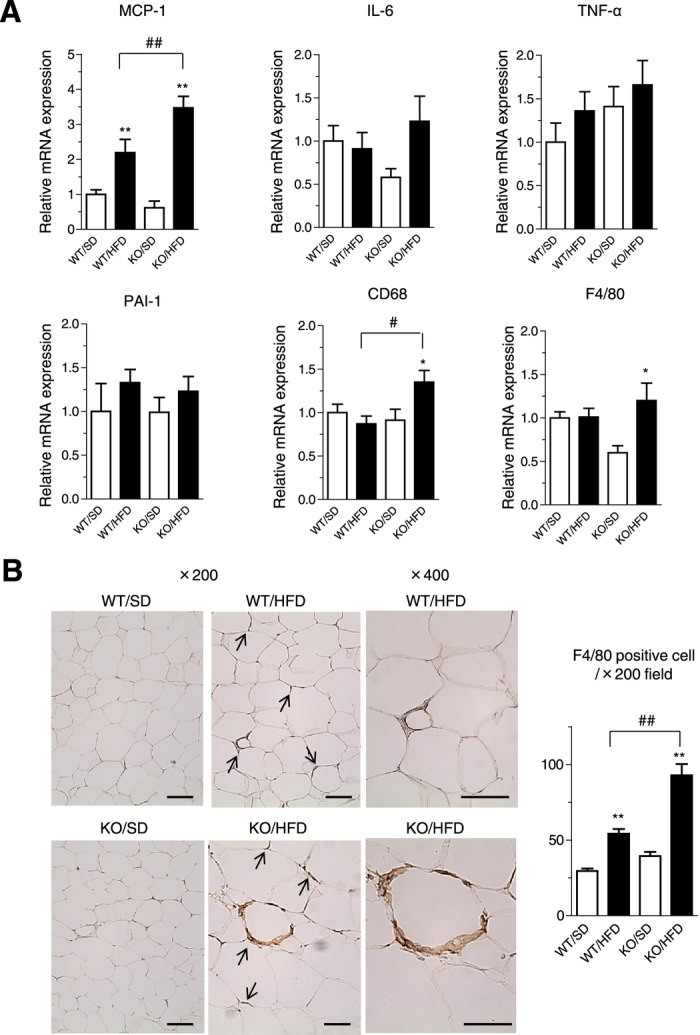
ATRAP deficiency exacerbates upregulation of inflammatory gene expression and causes macrophage infiltration in adipose tissue in response to HF loading. A, Expression of MCP‐1, IL‐6, TNFα, PAI‐1, CD68, and F4/80 mRNA in epididymal white adipose tissue of Agtrap+/+ (WT) and Agtrap−/− (KO) mice on either standard diet (SD) or HF diet (HFD). Values are calculated as the fold induction of those achieved with extracts from WT mice on SD. Data are shown as mean±SEM. *P<0.05, **P<0.01 vs SD within the same group; #P<0.05, ##P<0.01 vs WT mice on the same diet; n=7 to 10 (ANOVA). B, Representative immunohistochemical images of epididymal white adipose tissue sections stained with the anti‐F4/80 antibody (left). Arrows indicate macrophage infiltration. Original magnification, ×200 or ×400. Scale bar=100 μm. Quantitative analysis of F4/80‐positive cells in white adipose tissue sections (left). Data are shown as mean±SEM. **P<0.01 vs SD within the same group; ##P<0.01 vs WT mice on the same diet; n=6 to 8 (ANOVA). ATRAP indicates angiotensin II type 1 receptor–associated protein; HF, high fat.
We found that the expression patterns of CD68 and F4/80 were significantly elevated in the adipose tissue of Agtrap−/− but not WT Agtrap+/+ mice on HFD (CD68, 1.54±0.18 versus 0.87±0.09 fold induction, P=0.001; F4/80, 1.73±0.33 versus 1.01±0.12 fold induction, P=0.013; Figure 6A). On immunohistochemical staining for F4/80‐positive cells and its quantitative analysis, there was an increased accumulation of infiltrating macrophages in white adipose tissue of the Agtrap−/− mice on HF loading compared with WT Agtrap+/+ mice (Figure 6B). This finding is consistent with the upregulation of macrophage‐specific genes (CD68, F4/80 in Figure 6A) in the adipose tissue of Agtrap−/− mice. Collectively, these results in the Agtrap−/− mice indicate that ATRAP deficiency causes macrophage infiltration of adipose tissues, with an induced secretion of proinflammatory adipocytokines and resultant adipose tissue inflammation in response to HF loading.
Transplantation of Fat Overexpressing ATRAP Improves Metabolic Dysfunction in ATRAP Deficiency Under HF Loading
As described here, the results of present study indicate that Agtrap−/− mice are an effective model of metabolic disorders with visceral obesity by dietary intervention and suggest a protective role of ATRAP against the pathogenesis of metabolic dysfunction. Thus, we hypothesized that physiological production and secretion of putative protective factors from normal adipose tissue may be impaired by the ATRAP deficiency so as to provoke systemic metabolic dysfunction. Therefore, we next performed a fat‐transplantation strategy to examine our hypothesis.13
We examined effects of transplantation of donor fat pads derived from Agtrap−/− mice, WT Agtrap+/+ mice and Agtrap transgenic mice (Tg19). The total adipose ATRAP protein expression detected by the anti‐ATRAP antibody was significantly higher in Agtrap transgenic mice (Tg19) (endogenous ATRAP and transgene HA‐ATRAP) than in Agtrap+/+ mice (WT) (endogenous ATRAP) (Figure 7A). Therefore, the donor fat pads derived from Agtrap transgenic mice (Tg19), which exhibited a 3.7‐fold increase in ATRAP mRNA expression in epididymal adipose tissue compared with Agtrap+/+ mice (WT) (Figure 7A), were used to examine a possible beneficial effect of adipose‐specific ATRAP activation on systemic metabolic dysfunction in Agtrap−/− mice. The donor fat pads derived from Agtrap−/− mice without detectable adipose ATRAP expression were used as negative control.
Figure 7.
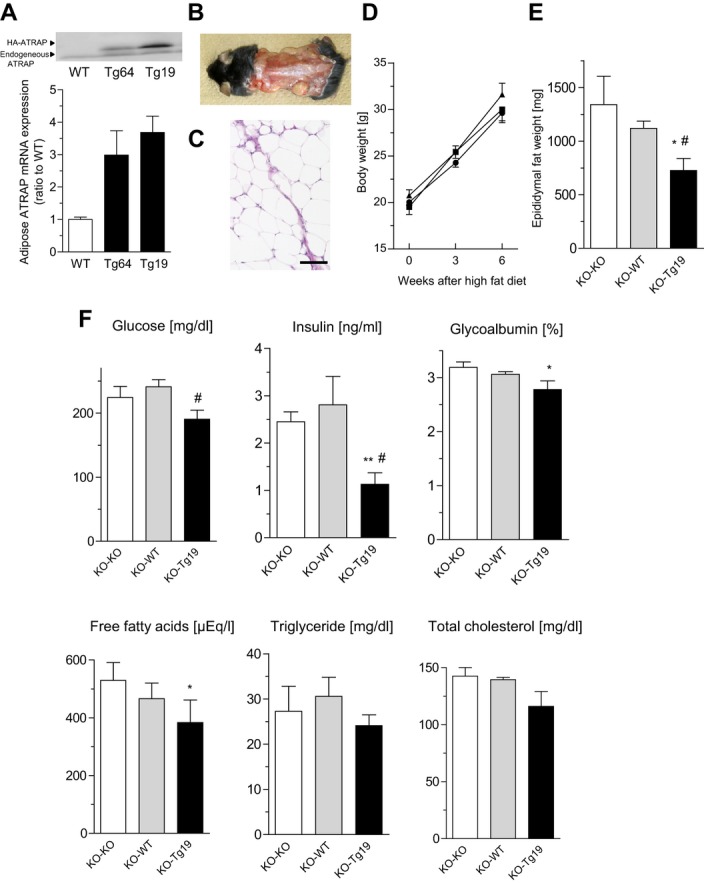
Transplantation of fat overexpressing ATRAP improves metabolic dysfunction in ATRAP deficient mice in response to HF loading. A, Top, representative immunoblot of the total ATRAP protein expression (endogenous ATRAP and transgene HA‐ATRAP) in epididymal white adipose tissue from Agtrap+/+ (WT), Agtrap transgenic (Tg64), and Agtrap transgenic (Tg19) mice. The anti‐ATRAP antibody was used for immunoblot analysis. The upper and lower arrowheads indicate the transgene‐derived HA‐ATRAP protein and endogenous ATRAP protein, respectively. Bottom, comparison of the total ATRAP (endogenous ATRAP and transgene HA‐ATRAP) mRNA levels in epididymal white adipose tissue from Agtrap+/+ (WT), Agtrap transgenic (Tg64), and Agtrap transgenic (Tg19) mice. Values are normalized relative to the level of 18S rRNA control and expressed relative to those achieved with RNA from Agtrap+/+ mice (WT). Data are shown as mean±SEM; n=3 each (Kruskal–Wallis test). B, Appearance of 13‐week‐old Agtrap−/− recipient mice 6 weeks after transplantation with 900 mg of fat pad tissue in 5 grafts. C, Histology of the adipose tissue graft 6 weeks after transplantation stained with hematoxylin and eosin (H&E). Left, donor epididymal fat tissue. Right, recipient subcutaneous fat tissue. Original magnification, ×200. Scale bar=100 μm. D, Growth curve of Agtrap−/− recipient mice on HF diet. Donor fat pads were used from KO (▲), WT (●), and Tg19 (■) mice (n=6 to 7). Data are shown as mean±SEM (2‐way ANOVA). E, Weight of the endogenous epididymal white adipose tissue in Agtrap−/− recipient mice. Data are shown as mean±SEM. *P<0.05 vs KO‐KO; #P<0.05 vs KO‐WT; n=5 to 6 (ANOVA). F, Nonfasting plasma glucose, insulin, glycoalbumin, free fatty acids (FFA), triglycerides, and total cholesterol concentrations in the Agtrap−/− recipient mice. Data are shown as mean±SEM. *P<0.05, **P<0.01 vs KO‐KO; #P<0.05 vs KO‐WT; n=6 to 7 (ANOVA). ATRAP indicates angiotensin II type 1 receptor–associated protein; HF, high fat.
We transplanted a total of 900 mg of the fat pad subcutaneously into Agtrap−/− recipient mice, which were then subjected to HF loading for 6 weeks. These fat grafts were successfully implanted and viable, as confirmed by histological analysis (Figure 7B and 7C). After the HF loading, there was no significant difference in body weight among the 3 groups (Figure 7D). However, the weight of the endogenous epididymal adipose tissue in Agtrap−/− mice receiving the fat pad from the Agtrap transgenic mice (KO‐Tg19) was markedly decreased compared with that of the animals receiving endogenous epididymal adipose tissue from Agtrap−/− mice (KO‐KO) and WT Agtrap+/+ mice (KO‐WT) (726±112 versus 1342±264 and 1120±69 mg, P=0.048 and P=0.020, respectively; Figure 7E). Furthermore, Agtrap−/− mice receiving fat pad tissue from Agtrap transgenic mice (KO‐Tg19) fed a HF diet showed a dramatic improvement in glucose and lipid metabolism, especially a significant decrease in the nonfasting plasma insulin and free fatty acids concentrations compared with mice receiving fat pad tissue from Agtrap−/− mice (KO‐KO) (plasma insulin, 1.13±0.24 versus 2.45±0.21 ng/mL, P=0.002; plasma free fatty acids, 383±79 versus 529±62 μEq/L, P=0.018; Figure 7F). Taken together, these results indicate that adipose ATRAP plays a protective role against systemic insulin resistance.
Discussion
It is demonstrated here that ATRAP deletion not only exaggerated the inflammation in adipose tissue, with a concomitant adipose infiltration of macrophages causing a dysfunction of adipocytes, but also provoked systemic insulin resistance. Furthermore, almost of these pathological changes induced by ATRAP deletion were exhibited after dietary HF loading. Various T2DM models, such as ob/ob, db/db, and KKAy mice, display a diabetic phenotype even without dietary intervention,27–29 which is in striking contrast with Agtrap−/− mice. Thus, Agtrap−/− mice may be a good model of human metabolic syndrome, which is principally provoked by environmental factors (eg, a high caloric diet). These Agtrap−/− mice will make it possible to analyze the molecular mechanisms of the pathologic progress of metabolic disorders with visceral obesity. Furthermore, the critical preventive role of ATRAP in local adipose tissue in the pathogenesis of metabolic disorders was strongly supported by the results of fat transplantation from Agtrap transgenic mice into Agtrap−/− recipient mice, which rescued metabolic dysfunction in Agtrap−/− recipient mice.
Considering the HF loading–mediated metabolic phenotype in Agtrap−/− mice, the decrease in ATRAP and not AT1R expression in adipose tissue in metabolic disorders in both patients and diabetic mice might be related to a primary and not secondary cause. Several of the lines of evidence presented in this study show that the HF loading–mediated pathological alteration of the metabolic phenotype in Agtrap−/− mice was caused by adipose tissue inflammation. First, the adipocyte hypertrophy was enhanced in the Agtrap−/− mice compared with WT Agtrap+/+ mice under the condition of HF loading. Second, the infiltrating macrophages were significantly elevated in the adipose tissue of Agtrap−/− mice compared with WT Agtrap+/+ mice under HF loading. Third, the HF loading–mediated upregulation of MCP‐1 was exacerbated in the Agtrap−/− mice compared with the WT Agtrap+/+ mice. Local adipose tissue ATRAP may be a modulator of adipokine production and inflammation that exerts beneficial regulatory effects on the function of adipocytes and improves systemic insulin sensitivity.
With respect to possible mechanisms involved in the rescue of metabolic dysfunction in Agtrap−/− recipient mice by fat transplantation, the transplanted adipose tissue is likely to be functionally active to promote glucose uptake by the fat graft itself at the local site. However, despite the transplantation of fat overexpressing ATRAP into Agtrap−/− recipient mice, a considerable amount of the total adipose tissue mass remained ATRAP deficient. Thus, the transplanted adipose tissue overexpressing ATRAP may have some cell‐autonomous properties with the capacity to release some protective factors that can act on other organs and tissues including the ATRAP‐deficient adipose tissue to improve insulin sensitivity against metabolic dysfunction, but such protective factor was not identified yet in this study. A previous study that first reported and examined the effects of fat transplantation also showed that surgical implantation of adipose tissue successfully improved the muscle insulin sensitivity in lipoatrophic mice, thereby suggesting the metabolic and endocrine communication between adipose tissue and the rest of the body.30 Therefore, although our findings of crosstalk specifically between fat graft and other adipose tissue are of considerable interest, the possible mechanisms need to be further elucidated.
Taken together, we suggest that adipose tissue ATRAP plays a preventive role against the development of metabolic disorders with visceral obesity, provoked by pathological HF loading. Because ATRAP is highly expressed in adipose tissue of WT Agtrap+/+ mice, the development of systemic insulin resistance related to ATRAP deficiency is attributable to the exaggeration of adipose tissue inflammation in Agtrap−/− mice that occurs via the secretion of proinflammatory cytokines and factors derived from enlarged adipocytes.1–3,1–32
However, as a limitation of the present study, even though the results of fat transplantation experiment would support the important protective role of adipose ATRAP against metabolic dysfunction, these results strictly do not rule out the secondary effects from other tissues.30 In particular, since this is a systemic gene knockout model but not adipose tissue–specific gene knockout model, the function of ATRAP in other tissues, mainly in the cardiovascular and renal systems, can also contribute to the metabolic dysfunction observed in the Agtrap−/− mice. Thus, although our findings of crosstalk specifically between fat graft, liver, and other adipose tissue are of considerable interest, the possible mechanisms need to be further elucidated.
In summary, the data obtained from this study demonstrated that ATRAP, a directly interacting and functionally inhibiting molecule of AT1R, plays a protective role against the development of systemic insulin resistance via regulatory effects on adipose tissue function. Adipose tissue ATRAP may therefore serve as a molecular target in metabolic disorders with visceral obesity. Characterization of the cellular and molecular mechanism of ATRAP regulatory adipose tissue function should have important cardiovascular pathophysiological and therapeutic implications.
Sources of Funding
This work was supported by a Health and Labor Sciences Research grant (to Drs Tamura, Toya, and Umemura) and by Grants‐in‐Aid for Scientific Research from the Japan Society for the Promotion of Science (JSPS) (No. 24591233 to Dr Tamura; No. 22590913 to Kanaoka), the Salt Science Research Foundation (No. 1134 to Dr Tamura), the Kidney Foundation, Japan (JKFB13‐17 to Dr Tamura) and the Novartis Foundation for Gerontological Research (2012) (to Dr Tamura).
Disclosures
None.
References
- 1.Apovian CM, Bigornia S, Mott M, Meyers MR, Ulloor J, Gagua M, McDonnell M, Hess D, Joseph L, Gokce N. Adipose macrophage infiltration is associated with insulin resistance and vascular endothelial dysfunction in obese subjects. Arterioscler Thromb Vasc Biol. 2008; 28:1654-1659 [DOI] [PMC free article] [PubMed] [Google Scholar]
- 2.Neels JG, Olefsky JM. Inflamed fat: what starts the fire? J Clin Invest. 2006; 116:33-35 [DOI] [PMC free article] [PubMed] [Google Scholar]
- 3.Schenk S, Saberi M, Olefsky JM. Insulin sensitivity: modulation by nutrients and inflammation. J Clin Invest. 2008; 118:2992-3002 [DOI] [PMC free article] [PubMed] [Google Scholar]
- 4.Holness MJ, Sugden MC. The impact of genetic hypertension on insulin secretion and glucoregulatory control in vivo: studies with the TGR(mRen2)27 transgenic rat. J Hypertens. 1998; 16:369-376 [DOI] [PubMed] [Google Scholar]
- 5.Massiera F, Bloch‐Faure M, Ceiler D, Murakami K, Fukamizu A, Gasc JM, Quignard‐Boulange A, Negrel R, Ailhaud G, Seydoux J, Meneton P, Teboul M. Adipose angiotensinogen is involved in adipose tissue growth and blood pressure regulation. FASEB J. 2001; 15:2727-2729 [DOI] [PubMed] [Google Scholar]
- 6.Daviet L, Lehtonen JY, Tamura K, Griese DP, Horiuchi M, Dzau VJ. Cloning and characterization of ATRAP, a novel protein that interacts with the angiotensin II type 1 receptor. J Biol Chem. 1999; 274:17058-17062 [DOI] [PubMed] [Google Scholar]
- 7.Lopez‐Ilasaca M, Liu X, Tamura K, Dzau VJ. The angiotensin II type I receptor‐associated protein, ATRAP, is a transmembrane protein and a modulator of angiotensin II signaling. Mol Biol Cell. 2003; 14:5038-5050 [DOI] [PMC free article] [PubMed] [Google Scholar]
- 8.Horiuchi M, Iwanami J, Mogi M. Regulation of angiotensin II receptors beyond the classical pathway. Clin Sci (Lond). 2012; 123:193-203 [DOI] [PubMed] [Google Scholar]
- 9.Mogi M, Iwai M, Horiuchi M. Emerging concepts of regulation of angiotensin II receptors: new players and targets for traditional receptors. Arterioscler Thromb Vasc Biol. 2007; 27:2532-2539 [DOI] [PubMed] [Google Scholar]
- 10.Tamura K, Tanaka Y, Tsurumi Y, Azuma K, Shigenaga A, Wakui H, Masuda S, Matsuda M. The role of angiotensin AT1 receptor‐associated protein in renin‐angiotensin system regulation and function. Curr Hypertens Rep. 2007; 9:121-127 [DOI] [PubMed] [Google Scholar]
- 11.Tamura K, Wakui H, Maeda A, Dejima T, Ohsawa M, Azushima K, Kanaoka T, Haku S, Uneda K, Masuda S, Azuma K, Shigenaga A, Koide Y, Tsurumi‐Ikeya Y, Matsuda M, Toya Y, Tokita Y, Yamashita A, Umemura S. The physiology and pathophysiology of a novel angiotensin receptor‐binding protein ATRAP/Agtrap. Curr Pharm Des. 2013; 19:3043-3048 [DOI] [PubMed] [Google Scholar]
- 12.Iwamoto T, Kita S, Zhang J, Blaustein MP, Arai Y, Yoshida S, Wakimoto K, Komuro I, Katsuragi T. Salt‐sensitive hypertension is triggered by Ca2+ entry via Na+/Ca2+ exchanger type‐1 in vascular smooth muscle. Nat Med. 2004; 10:1193-1199 [DOI] [PubMed] [Google Scholar]
- 13.Tran TT, Yamamoto Y, Gesta S, Kahn CR. Beneficial effects of subcutaneous fat transplantation on metabolism. Cell Metab. 2008; 7:410-420 [DOI] [PMC free article] [PubMed] [Google Scholar]
- 14.Wakui H, Tamura K, Matsuda M, Bai Y, Dejima T, Shigenaga A, Masuda S, Azuma K, Maeda A, Hirose T, Ishigami T, Toya Y, Yabana M, Minamisawa S, Umemura S. Intrarenal suppression of angiotensin II type 1 receptor binding molecule in angiotensin II‐infused mice. Am J Physiol Renal Physiol. 2010; 299:F991-F1003 [DOI] [PubMed] [Google Scholar]
- 15.Sato K, Kihara M, Hashimoto T, Matsushita K, Koide Y, Tamura K, Hirawa N, Toya Y, Fukamizu A, Umemura S. Alterations in renal endothelial nitric oxide synthase expression by salt diet in angiotensin type‐1a receptor gene knockout mice. J Am Soc Nephrol. 2004; 15:1756-1763 [DOI] [PubMed] [Google Scholar]
- 16.Tanaka Y, Tamura K, Koide Y, Sakai M, Tsurumi Y, Noda Y, Umemura M, Ishigami T, Uchino K, Kimura K, Horiuchi M, Umemura S. The novel angiotensin II type 1 receptor (AT1R)‐associated protein ATRAP downregulates AT1R and ameliorates cardiomyocyte hypertrophy. FEBS Lett. 2005; 579:1579-1586 [DOI] [PubMed] [Google Scholar]
- 17.Tsurumi Y, Tamura K, Tanaka Y, Koide Y, Sakai M, Yabana M, Noda Y, Hashimoto T, Kihara M, Hirawa N, Toya Y, Kiuchi Y, Iwai M, Horiuchi M, Umemura S. Interacting molecule of AT1 receptor, ATRAP, is colocalized with AT1 receptor in the mouse renal tubules. Kidney Int. 2006; 69:488-494 [DOI] [PubMed] [Google Scholar]
- 18.Matsuzawa Y. Metabolic syndrome – definition and diagnostic criteria in Japan. J Atheroscler Thromb. 2005; 12:301. [DOI] [PubMed] [Google Scholar]
- 19.Jayasooriya AP, Mathai ML, Walker LL, Begg DP, Denton DA, Cameron‐Smith D, Egan GF, McKinley MJ, Rodger PD, Sinclair AJ, Wark JD, Weisinger HS, Jois M, Weisinger RS. Mice lacking angiotensin‐converting enzyme have increased energy expenditure, with reduced fat mass and improved glucose clearance. Proc Natl Acad Sci USA. 2008; 105:6531-6536 [DOI] [PMC free article] [PubMed] [Google Scholar]
- 20.Kouyama R, Suganami T, Nishida J, Tanaka M, Toyoda T, Kiso M, Chiwata T, Miyamoto Y, Yoshimasa Y, Fukamizu A, Horiuchi M, Hirata Y, Ogawa Y. Attenuation of diet‐induced weight gain and adiposity through increased energy expenditure in mice lacking angiotensin II type 1a receptor. Endocrinology. 2005; 146:3481-3489 [DOI] [PubMed] [Google Scholar]
- 21.Massiera F, Seydoux J, Geloen A, Quignard‐Boulange A, Turban S, Saint‐Marc P, Fukamizu A, Negrel R, Ailhaud G, Teboul M. Angiotensinogen‐deficient mice exhibit impairment of diet‐induced weight gain with alteration in adipose tissue development and increased locomotor activity. Endocrinology. 2001; 142:5220-5225 [DOI] [PubMed] [Google Scholar]
- 22.Takahashi N, Li F, Hua K, Deng J, Wang CH, Bowers RR, Bartness TJ, Kim HS, Harp JB. Increased energy expenditure, dietary fat wasting, and resistance to diet‐induced obesity in mice lacking renin. Cell Metab. 2007; 6:506-512 [DOI] [PMC free article] [PubMed] [Google Scholar]
- 23.Hajer GR, van Haeften TW, Visseren FL. Adipose tissue dysfunction in obesity, diabetes, and vascular diseases. Eur Heart J. 2008; 29:2959-2971 [DOI] [PubMed] [Google Scholar]
- 24.Sethi JK, Vidal‐Puig AJ. Thematic review series: adipocyte biology. Adipose tissue function and plasticity orchestrate nutritional adaptation. J Lipid Res. 2007; 48:1253-1262 [DOI] [PMC free article] [PubMed] [Google Scholar]
- 25.Kanda H, Tateya S, Tamori Y, Kotani K, Hiasa K, Kitazawa R, Kitazawa S, Miyachi H, Maeda S, Egashira K, Kasuga M. MCP‐1 contributes to macrophage infiltration into adipose tissue, insulin resistance, and hepatic steatosis in obesity. J Clin Invest. 2006; 116:1494-1505 [DOI] [PMC free article] [PubMed] [Google Scholar]
- 26.Lazar MA. The humoral side of insulin resistance. Nat Med. 2006; 12:43-44 [DOI] [PubMed] [Google Scholar]
- 27.Coleman DL. Obese and diabetes: two mutant genes causing diabetes‐obesity syndromes in mice. Diabetologia. 1978; 14:141-148 [DOI] [PubMed] [Google Scholar]
- 28.Suto J, Matsuura S, Imamura K, Yamanaka H, Sekikawa K. Genetic analysis of non‐insulin‐dependent diabetes mellitus in KK and KK‐Ay mice. Eur J Endocrinol. 1998; 139:654-661 [DOI] [PubMed] [Google Scholar]
- 29.Zhang Y, Proenca R, Maffei M, Barone M, Leopold L, Friedman JM. Positional cloning of the mouse obese gene and its human homologue. Nature. 1994; 372:425-432 [DOI] [PubMed] [Google Scholar]
- 30.Gavrilova O, Marcus‐Samuels B, Graham D, Kim JK, Shulman GI, Castle AL, Vinson C, Eckhaus M, Reitman ML. Surgical implantation of adipose tissue reverses diabetes in lipoatrophic mice. J Clin Invest. 2000; 105:271-278 [DOI] [PMC free article] [PubMed] [Google Scholar]
- 31.Ouchi N, Parker JL, Lugus JJ, Walsh K. Adipokines in inflammation and metabolic disease. Nat Rev Immunol. 2011; 11:85-97 [DOI] [PMC free article] [PubMed] [Google Scholar]
- 32.Tabata M, Kadomatsu T, Fukuhara S, Miyata K, Ito Y, Endo M, Urano T, Zhu HJ, Tsukano H, Tazume H, Kaikita K, Miyashita K, Iwawaki T, Shimabukuro M, Sakaguchi K, Ito T, Nakagata N, Yamada T, Katagiri H, Kasuga M, Ando Y, Ogawa H, Mochizuki N, Itoh H, Suda T, Oike Y. Angiopoietin‐like protein 2 promotes chronic adipose tissue inflammation and obesity‐related systemic insulin resistance. Cell Metab. 2009; 10:178-188 [DOI] [PubMed] [Google Scholar]