

Abstract
Purpose: To evaluate and characterize the performance of a new commercially available pixelated portable gamma camera Ergo (Digirad, Poway, CA).
Methods: The authors evaluated a pixelated portable gamma camera system, Ergo, that consists of 11 520 elements of 3 × 3 mm2 CsI(Tl) crystals that are 6-mm thick and are coupled to silicon photodiodes. The detector element has a size of 3.31 × 3.24 mm2. The gamma camera performance was evaluated for both low-energy all-purpose (LEAP) and low-energy high-resolution (LEHR) collimators. The flood-field uniformity for 99mTc and 201Tl was assessed using fillable uniform flood phantoms. Energy spectra were acquired for 99mTc, 111In, 201Tl, and 67Ga to evaluate energy linearity and energy resolution. Spectral fits were performed to calculate the photopeak energies and resolutions. The pixel size and multiwindow spatial registration (MWSR) was evaluated by measuring mixed 99mTc and 201Tl point sources placed at known distances apart. The system’s sensitivity was measured according to the National Electrical Manufacturer’s Association (NEMA) NU1-2007 standards for both LEAP and LEHR collimators as a function of distance from the collimator surface (5, 10, 15, 20, 25, 30, and 40 cm). The system resolution without scatter was measured for both LEAP and LEHR using 99mTc-filled capillary tubes located at 0, 2, 4, 6, 10, and 12 cm away from the surface of the collimator. As a measure of the spatial resolution, the full width at half maximum (FWHM) at a given distance was calculated from the presampling line spread function (LSF), constructed from the line profiles of the capillary tubes at the same distance. As a comparison, the FWHM at 10 cm away from LEHR and LEAP collimators was also calculated from linear interpolation as described by NEMA NU-1 2007 and from fitting the profiles to a Gaussian-plus-constant model.
Results: All isotope-collimator pairs demonstrated good flood-field uniformity with an integral uniformity of ≤5% and a differential uniformity of ≤3%. The system demonstrated excellent energy linearity with maximum discrepancy of measured keV from true keV of <1%. The energy resolution of the 99mTc 140-keV photopeak was 7.4%. The image pixel size was measured as 3.23 × 3.18 mm2, and the MWSR was within 0.3 mm (or ∼10% of the nominal pixel size). The system sensitivity at 10 cm was 112.6 cps/MBq (249.9 cpm/μCi) for LEAP and 63.1 cps/MBq (140.1 cpm/μCi) for LEHR. The system spatial resolution varied linearly with distance from the collimator and the FWHM were measured to be 7.2 and 8.9 mm at 10 cm for LEHR and LEAP, respectively.
Conclusions: Herein, the authors describe detailed performance evaluation procedures of a new pixelated portable gamma camera system, which can also be applied to evaluate other pixelated gamma camera system. Spatial resolution assessment in near-field imaging condition offers a unique challenge where the measured FWHM is highly dependent on relative position between the capillary tube and the detector element. The evaluations of the Ergo gamma camera suggest suitable clinical imaging performance. This portable gamma camera has a high (LEAP) planar sensitivity, high energy and spatial resolutions that are comparable to other available gamma cameras, and it exhibits superior count rate performance that is linear up to tens of millions count per second. The Ergo imaging performance, however, can still be improved, for example, by optimizing collimator design for near field imaging.
Keywords: pixelated gamma camera, performance evaluation, presampling MTF, gamma camera
INTRODUCTION
Traditional gamma cameras are manufactured using monolithic inorganic crystals with an array of photomultiplier tubes (PMTs), while more recently pixelated gamma cameras with discrete detector elements coupled with readouts are being introduced. Some of the more common detector configurations for pixelated systems include solid-state detectors such as cadmium-zinc-telluride and scintillators elements matched with photodiodes or position-sensitive photomultiplier tubes.1, 2, 3, 4, 5 Reference 1 is a topical review about the advancement of gamma camera starting from the traditional anger camera to alternative designs such as pixelated gamma camera. Pixelated gamma cameras have certain advantages over the traditional Anger-type gamma camera. The compact design of pixelated gamma cameras can facilitate manufacturing of portable gamma cameras that are ideal for operating room procedures and bedside examinations. The compactness also facilitates near-field imaging, which takes advantage of higher spatial resolution, e.g., in molecular breast imaging. Compared to the Anger-type gamma cameras, pixelated gamma cameras usually have higher energy resolution, which improves image contrast and spatial resolution through better scatter rejection. Discrete detector gamma cameras have their spatial resolution governed by size of the detector elements, whereas spatial resolution of a monolithic gamma camera is governed by Anger logic and electronic pixel addressing. The sensitivity of pixelated gamma cameras can be increased by matching the collimator hole size with the detector element size.4, 5, 6 Unlike the traditional Anger camera, pixelated gamma camera has “dead space,” which is inactive, in between detector elements. A matching collimator will occupy the space above this “dead space” and minimally occupy the space above the active region, thus higher system sensitivity can be achieved. On the other hand, a hexagonal collimator pattern may block the active detector surface and expose the inactive space between them, thus resulting in a suboptimal sensitivity performance. The higher cost of pixelated gamma cameras has, however, hindered their widespread availability in past decades. Recent advances in fabrication technology have reduced their manufacturing costs; consequently, a number of pixelated gamma camera systems are now available commercially.1, 2
There are a number of publications that deal with acceptance testing and performance characterization of the monolithic gamma camera.7, 8, 9, 10, 11 While some guidance is provided by National Electrical Manufacturer’s Association (NEMA) NU1-2007 (Ref. 10) for pixelated systems, the systematic performance evaluation of pixelated systems specifically for clinical use has not been well established. Manufacturers of nuclear medicine gamma cameras provide system specifications that are usually based on the standards of NEMA.10 Although the NEMA standards are quite comprehensive, many of the tests described require specialized equipment and sophisticated software. These requirements make the verification of quoted NEMA system performance characteristics somewhat difficult.
Reports from the American Association of Physicists in Medicine (AAPM)7, 8, 9 have alleviated some of the difficulties in evaluating gamma camera’s performance characteristics by providing methods and protocols for planar and single-photon emission computed tomography (SPECT) evaluation of gamma cameras that are both practical and time efficient. However, procedural differences between the NEMA and AAPM tests undermine a direct comparison between the results using the AAPM reports and the system performance specifications claimed by the manufacturer. In addition, to our knowledge, no reports have been published that incorporate nominal values for the various planar acceptance tests based on the procedures described in the AAPM reports.
Some of the test procedures for measuring performance characteristics reported here are based on the NEMA standards while other are based on the AAPM reports. The test methodology used clinically relevant test methodology and practical setup. The spatial resolution and sensitivity was evaluated for low-energy high-resolution (LEHR) and low-energy all-purpose (LEAP) as a function of distance from the collimator, and the count rate was evaluated with Copper attenuators.
The purpose of this study was to investigate the clinically relevant performance characteristics of Ergo (Digirad, Poway, CA), a new commercially available portable pixelated gamma camera system (Fig. 1). More specifically, we investigated the following performance characteristics: extrinsic spatial resolution, count rate performance, sensitivity, energy linearity, energy resolution, pixel size, and multiwindow spatial registration (MWSR).
Figure 1.
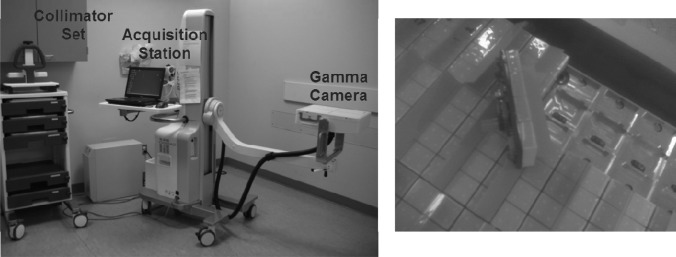
(Left) The Ergo system pictured here shows the gamma camera on an arm extension, a laptop acquisition station, and a collimator shelf with several different collimators. (Right) The image shows the details of the detector consisting of modules of the indirect CsI coupled with Si photodiodes that are mounted on an electronic readout board.
MATERIALS AND METHODS
Ergo is a portable pixelated gamma camera system that has a wide field of view (FOV) of 39.6 × 31.1 cm2. The detailed structure of the camera has been described by Kindem et al.3 The discrete detector elements consist of 11 520 segmented CsI(Tl) coupled with backside-illuminated and low-leakage Si photodiodes. Each crystal element is 6-mm thick and has an area of 3 × 3 mm2. The detector elements are arranged into 4 × 4 arrays (16 pixels). These 4 × 4 arrays are grouped into two rows and four columns to make a module. Four 32-channel ASICs and readout electronics are attached to the bottom side of the modules. The modules also contain a Universal Serial Bus Interface.
The system comes with a variety of collimators, including a LEHR collimator, a LEAP collimator, and a diverging collimator for general nuclear medicine imaging. The Ergo collimators are similar in design to the conventional collimators in terms of holes diameter, septa thickness, and holes length. Both LEAP and LEHR have hexagonal collimator holes with diameters and septa thicknesses of 1.5 and 0.2 mm, respectively. The collimator holes lengths are 23 and 30 mm for LEAP and LEHR, respectively. In addition, a breast paddle is also available for breast imaging.
Spatial resolution
The system spatial resolution was evaluated at distances of 0–120 mm from the collimator’s surface, in 20-mm increments for both the LEAP and LEHR collimators. 99mTc-filled capillary tubes, having an outer diameter of 1 mm and a length of 40 mm, were imaged to evaluate the system spatial resolution. The capillary tubes were arranged on 1-mm graph paper in staggered positions such that they spanned a 5-mm sampling range along both axes, as shown in Fig. 2. The capillary tube arrangement was shifted by 5 mm on both axes at distance of 10 cm so that the capillary tubes spanned a total sampling range of 10 mm along both axes, as recommended by NEMA NU-1 2007 for evaluation of spatial resolution with a discrete pixel detector.10 These 99mTc-filled capillary tube arrangements were imaged at several distances from the LEAP and LEHR collimators to evaluate the system spatial resolution as a function of distance from each collimator. The Ergo system applies a postacquisition 4-mm full-width-at-half-maximum (FWHM) Gaussian smoothing filter to all clinical images, i.e., images that are not acquired in a daily quality control (QC) mode; therefore, to evaluate the native system spatial resolution, all images were acquired using the 99mTc energy window (130–152 keV) in the daily QC mode with a pixel size of 3.3 × 3.2 mm2. The acquisition duration was adjusted to obtain 1000 counts at the peak of the image line profile.
Figure 2.

The arrangement for evaluation of spatial resolution was formed using ten capillary tubes (with an outer diameter ∼1 mm) filled up to ∼40 mm with 99mTc. Along each axis, five capillary tubes were aligned on 1-mm graph papers to be parallel to the detector elements such that they spanned 5 mm of sampling range. The arrangement was then translated 5 mm along both the long and the short axes to sample the parallel adjoining 5 mm along both axes. These two arrangements provided a sampling range of 10 mm for the spatial resolution along both axes.
To calculate the FWHM at a given distance, the presampling line spread functions (LSFs) were constructed from the line profiles of the capillary tubes, as shown in Fig. 3. Averages of seven line profiles were extracted from each capillary tube in one of the two arrangements at every distance. For each axis, the five average line profiles from five staggered capillary tubes were translated to the location of one of the capillary tubes. For example, the top vertical capillary tube was chosen as the reference for the capillary tubes along the short axis. The line profile of the second capillary tube was translated by 1 mm to the right and the line profile from the third, fourth, and fifth capillary tubes were translated by 2, 3, and 4 mm, respectively. After that, those line profiles were combined to create the long axis presampling LSFs for that distance. The process was then repeated for both long and short axes on all distances.
Figure 3.

An illustration of the presampling LSF construction. (a) Three capillary tubes are each staggered by Δx (=1 mm) with respect to the adjacent capillary tubes. The dash lines illustrate the location from which the line profiles are extracted. In this work, seven line profiles were extracted along each capillary tube and they were averaged to create a line profile for that particular capillary tube. (b) The three line profiles are combined to create a presampling LSF. The data markers (diamond, square, and triangle) indicate the origin of the data points. In this illustration, the top capillary tube is picked as the reference. The line profile from the center capillary tube (pale square) is translated to the right by Δx and the line profile from the bottom capillary tube (pale triangle) is translated to the right by 2Δx. The solid line is the Gaussian fit for the presampling LSF.
Next, the presampling LSFs were fitted using the least-squares minimization to a Gaussian plus constant model . The Gaussian fits were used to estimate the FWHMs of the presampling LSF, i.e., . The FWHM at a distance is quoted as the average of the FWHMs from both short and long axes, as suggested by NEMA (Ref. 4) to reduce variability in measured FWHMs due to the asymmetry in detector elements. Then, the averaged FWHMs were plotted against the distance from both LEHR and LEAP collimators. Furthermore, the presampling modulated transfer functions (MTFs) were also derived by taking the magnitude of the Fourier Transform of the presampling LSFs.
As a comparison, the FWHM at 10 cm away from LEHR and LEAP collimators are measured following NEMA NU-1 2007 procedure. Line profiles were extracted from each capillary tube in both arrangements. The half maximum locations were determined by linear interpolation from two adjacent points around the half amplitude. In addition, the line profiles were fitted using the least-squares minimization to a Gaussian plus constant model. The FWHMs were calculated from the fitting parameters. The FWHMs initially measured in pixels were converted to distance by multiplying with the corresponding pixel size. Twenty line profiles were analyzed to generate 20 FHWMs—10 capillary tubes for each axis. The final FWHM at each distance from the collimator was the average of the 20 FHWMs = 10 FWHMs × 2 axes.
Count rate performance
Per Ergo specifications, the observed count rate, , is expected to be linear with the true count rate, , up to 5 Mcps, when measured over the entire detector FOV and not the individual pixel count rate. The count rate performance is commonly evaluated using the decay method, performed by taking sequential measurements of the detector count rate starting with high activity of radioactive material of known half-life.9 The maximum observed count rate and the observed count rate at 20% count loss are most often reported. Alternatively, photon attenuators of a known linear-attenuation coefficient and thicknesses can be used to modulate the incident photon fluence and simulate radioactive decay to evaluate the count rate performance.11 In this study, 2-mm copper sheets were used as the attenuator of choice. At 99mTc photon emission energy of 140 keV, the linear-attenuation coefficient for copper is 0.22 mm−1.12
A linear relationship between the measured count rate, CRm, and the true count rate, CRT, would suggest that , in the presence of a photon attenuator with a known thickness, x, and linear-attenuation coefficient, μ. Therefore
| (1) |
99mTc activity of 1.52 GBq (41 mCi) was placed in a lead pig (collimated into narrow beam geometry) at a distance of 42 cm to irradiate the entire FOV (Fig. 4). The copper sheets, in thickness increments of 2 mm, were placed right in front of the lead pig. Images were acquired intrinsically in the 99mTc energy window (130–152 keV) for 10 s at each copper attenuator thickness, t, ranging from 0 to 22 mm. At the 99mTc photopeak of 140 keV, the copper sheets provide a transmission factor ranging from 100% at 0-mm thickness to 0.75% at 22-mm thickness. The amount of scatter photons that reach the detector was minimal due to the narrow beam geometry and the large distance between the scatter source (copper sheets) and the detector. Since the rationale for this setup is to modulate the measured count rate only due to the presence of attenuators in the beam, we will need to account for the decay of radioactivity between count rate measurements. We, therefore, apply a correction to the measured counts at each Cu thickness to account for the decay of radioactivity since the first measurement with 0 mm of Cu. We used acquisition durations of 10 s to measure the counts with different thicknesses of Cu; therefore, the deadtime does not change greatly during the acquisition. In addition, the entire data acquisition was completed within 180 s, therefore, the magnitude of correction applied to the measured counts to account for decay of radioactivity is small (<1%).
Figure 4.

The count rate performance evaluation setup is shown. The 99mTc vial was placed in a lead pig to simulate narrow beam geometry. Copper sheets in 2-mm increment were placed in front of the 99mTc source to serve as an attenuator and to simulate different count rates. The 99mTc source was placed at a distance so that the entire intrinsic detector was flooded.
For each image, the total counts in the entire FOV were calculated and corrected for decay, and then the count rate was calculated as the corrected total counts divided by the acquisition time to arrive at the measured count rate, .
Noise characteristics
Ideal counting systems follow Poisson statistics, i.e., the standard deviation (noise) of the pixel counts (signal) should equal the square root of the pixel counts for large counts. To investigate the noise characteristic of this detector, a 57Co sheet source was positioned right on top of the detector with LEAP collimation. Flood images were acquired for ten different acquisition times such that the mean pixel count ranged from 6 to 750 counts/pixel. A 300-cm2 region of interest (ROI) was drawn on each image, and the mean and standard deviation were extracted from the ROI. Standard deviations were modeled as a power law function of the mean pixel counts and compared with Poisson distribution.
Sensitivity performance
The sensitivity performance was evaluated for both LEHR and LEAP collimators as a function of distance, ranging from 5 to 40 cm. A precise amount of 99mTc activity measured using a dose calibrator was injected into a 9 × 9 cm2 pathology flask filled with a 2-mm water layer. The water layer was kept thin to minimize the photon attenuation. The postinjection residual activity of 99mTc was also measured to obtain the net amount of 99mTc activity in the flask. The sensitivity measurements involved an initial 5-min background image, followed by three 5-min image acquisitions of the radioactive pathology flask, and completed with a second 5-min background image acquisition. All images were acquired using the default 99mTc energy window (130–152 keV). Total counts from each image were calculated. The average background counts were first subtracted from the total counts for the radioactive pathology flask and then net counts were decay-corrected to the 99mTc activity calibration time. The count rate for each radioactive flask image was calculated as the quotient of the corrected total count and the acquisition time. Finally, the average count rate was normalized by the 99mTc activity in the flask to calculate the system sensitivity in cpm/μCi and cps/MBq.
Energy resolution and linearity
The detector without collimation was irradiated using four different uncollimated radioisotopes, i.e., 67Ga, 99mTc, 111In, and 201Tl. The radioisotopes had an activity of approximately 100 MBq (3 mCi) each. Each of these sources was suspended one at a time in free air at approximately 1 m from the intrinsic detector surface to minimize scatter. The energy spectra of these radioisotopes were separately acquired in the “spectrum” acquisition mode, in which row-by-row data acquisitions were taken at 30 s per row. The photopeak regions in each spectrum were fitted using the least-squares minimization to a Gaussian plus quadratic model. The Gaussian fitting parameters were used to determine the photopeak center energy and the FWHM. For each photopeak, the energy resolution was calculated as the quotient of its FWHM and its center energy. The photopeak center energy was compared to the expected photon energy to assess the energy linearity of the system.
Extrinsic uniformity
The extrinsic uniformity was evaluated for the LEAP, LEHR, and diverging collimators using 99mTc, 201Tl, and 57Co radionuclides. All images were acquired for 6 × 10⁶ counts (per manufacturer’s specification) with a pixel size of 3.3 × 3.2 mm2 (128 × 128 matrix) in the daily QC mode (where no postacquisition smoothing filter was applied) with uniformity corrections. The 57Co image was acquired using a commercially available sheet source, whereas the 99mTc and 201Tl images were acquired using a fillable uniformity flat-field phantom. The NEMA integral uniformity (IU) and differential uniformity (DU) numbers were calculated using flood-field analysis software available in the acquisition system.
MWSR and pixel size
Four point sources were created by filling the tip of capillary tubes (outer diameter of 1 mm) using a mixture of 99mTc and 201Tl to a length of 1 mm. The point sources were then placed on the top of the LEAP collimator. The distances between the five sources were measured. Two images were acquired; the first image was acquired using the 99mTc energy window and the second image was acquired using the 201Tl energy window (60–80 and 154–180 keV). The centroids of the five point sources were calculated for both 99mTc and 201Tl images. The mean and maximum absolute differences in the centroid locations for each point source were calculated for each energy window to assess the MWSR on both axes.
The separations between the point sources along the axes were calculated in pixel number using the centroid locations of the 99mTc point source images. The diagonal distances were not used because the pixels are rectangular in shape. The pixel sizes were then calculated as the quotient of the true distance between two point sources in mm and the distance inferred from the image in pixel.
RESULTS
Extrinsic spatial resolution
Figure 5 shows the presampling LSF on the short axis, constructed from five average line profiles extracted from the capillary tubes’ images along the long axis. The inset in Fig. 5 shows the planar image of the capillary tubes arrangement imaged at 2.7 cm from the LEAP collimator. In the near-field imaging condition, each capillary tube’s image is about 10 pixels long and 1 pixel wide. Thorough visual assessment indicated that the images of the capillary tube were aligned properly with the detector elements; therefore, it can be deduced that the maximum misalignment that might occur happened when the capillary tube was sitting diagonally on the 1 × 10 pixels. Thus the maximum inclination with respect to the detector elements was . Consequently, the maximum uncertainty in the translation of the average line profiles during the presampling LSFs construction was , i.e., the errors in line profile shifts were mm. In the far field imaging condition, the presampling LSFs construction is much less sensitive to capillary tube and detector element misalignment.
Figure 5.

The presampling LSF at 2.7 cm away from the surface of the LEAP collimator. The data markers were constructed from five average line profiles extracted from the horizontal capillary tube images, shown in the inset. The solid line indicates the Gaussian plus constant fit. The inset shows the planar image of the capillary tubes arrangement at one position.
Figure 6 shows the measured extrinsic resolution (millimeter-FWHM) for both LEAP and LEHR collimators as a function of distance from the collimator surface. As expected for parallel-hole collimation, the spatial resolution follows a linear relationship with distance. The LEHR collimator exhibits a higher spatial resolution (i.e., a narrower FWHM) than the LEAP collimator. At the collimator surface, the LEHR resolution is close to the LEAP resolution, i.e., 3.0 and 3.4 mm, respectively, because at the collimator’s surface, the spatial resolution is primarily governed by the finite pixel size. The measured resolutions at 10.8 cm were 9.37 mm for the LEAP collimator and 7.48 mm for the LEHR collimator. The FWHMs at the same location calculated using linear interpolation [NEMA (Ref. 4) method] are 10.52 and 8.43 mm for LEAP and LEHR, respectively. Similarly, the FWHMs calculated from the Gaussian fitting parameter are 9.9 and 7.95 mm for LEAP and LEHR, respectively. The discrepancies between the methods are ∼12% and ∼6% for linear interpolation and Gaussian fit, respectively, with respect to the oversampling method. Even at 10 cm away from the collimators, the full width tenth maximum (FWTM) of the line profiles is only spanned by 4–5 pixels; therefore, the location of half maximum cannot be determined accurately by linear interpolation. The Gaussian fitting, however, worked reasonably well since the line profiles are spanned by enough pixels.
Figure 6.

The spatial resolution in full width at half maximum (FWHM-mm) as a function of distance for both the LEHR and LEAP collimators. The data markers indicate the measured native resolution, which is only available in the daily quality control mode. The dash and dashed-dotted lines represent the nominal resolution, which is realized in the clinical protocol where a 4-mm Gaussian filter is applied to the image by default. The FWHM at 10 cm from the collimator was 7.2 mm for LEHR (manufacturer specification: 7.4 mm) and 8.9 mm for LEAP (manufacturer specification: 10.3 mm). The uncertainty in each data marker is <1%.
The “nominal” spatial resolution that would be realized in clinical mode is also shown as the dashed and dashed-dotted lines in Fig. 6 by adding the 4-mm FWHM Gaussian to the measured resolution in quadrature. For the LEHR collimator, at 3 cm, the FWHM increases by 42%, while at 10 cm the FWHM increases by 15% only. The application of a Gaussian filter degrades the resolution, particularly, in near-field imaging conditions such as molecular breast imaging. The intent of showing the “nominal” spatial resolution in Fig. 6 is only meant to contrast it against the native resolution and not serve as a definitive measure of the clinical spatial resolution. Although it is a well-established fact that application of a 4-mm FWHM Gaussian filter is the same as adding it in quadrature to the measured native resolution, the equivalence may break down in near-field regions where pixel-size effects dominate.
Figure 7 shows the presampling MTFs as a function of distance away from the LEHR and LEAP collimators. Initially, the presampling MTFs degrade rapidly as the capillary tubes move away from the collimator surface in the near-field imaging condition. As the capillary tubes get further in the far field imaging condition, the presampling MTFs become less sensitive to distance, i.e., the presampling MTFs degrade more slowly as the distance increases.
Figure 7.

The presampling MTF as a function of distance from low energy high resolution, LEHR (a) and low energy all purpose, LEAP (b) collimators. As expected, the presampling MTF degrades as the distance of the capillary tubes from the collimator surface increases. The presampling MTF degrades rapidly in the near field and degrades more slowly in the far field as the distance increases.
Count rate performance
The decay-corrected observed count rates, , are plotted against the copper attenuator thicknesses in Fig. 8a, demonstrating an exponential dependence of the measured count rate, , on attenuator thickness. The deviation of the measured data points from the exponential attenuation model is plotted in Fig. 8b. The maximum deviation was found to be 9%, an acceptable level considering the uncertainty of the copper sheet thickness and the imperfect narrow beam geometry.
Figure 8.

(a) The measured count rate as a function of copper thickness. The curve follows a linear-attenuation decay model with a linear-attenuation coefficient of 0.2 mm −1. The linear response of the count rate was verified up to ∼20 Mcps. The uncertainty in each data marker is ≪1%. (b) The maximum deviation of the data from the model is 9%, which suggests that the data fit the linear-attenuation model.
According to Eq. 1, the measured count rate, , was found to be proportional to the true count rate, , up to 20 Mcps. Using the LEAP collimator, whose sensitivity was measured to be ∼112 cps/MBq (250 cpm/μCi) (Sec. 3D), the activity needed to achieve 20 Mcps with the LEAP collimator corresponds to over 185 GBq (5000 mCi) of 99mTc. Therefore, we concluded that for clinically relevant activity levels, the measured count rate was proportional to the true count rate.
The copper linear-attenuation coefficient was calculated from the measured data as the slope of the plot in Fig. 8a. The copper linear-attenuation coefficient at 140 keV was calculated to be 0.20 cm−1, which is within a 10% deviation from the expected value of 0.22 cm−1, as stated in the National Institute of Standards and Technology (NIST) database.12
The measured count rate performance data, however, do not suggest a specific dead-time behavior model, i.e., a nonparalyzable or a paralyzable response. The results only indicate that the dead time is negligible at clinically relevant activity levels.
Noise characteristic
The mean pixel counts and the standard deviations from the 57Co sheet source flood images are plotted in Fig. 9. The power fit of the data suggests that the mean count rate is proportional to the standard deviation to the power of 1.97 ± 0.01; therefore, the Ergo detector noise can be assumed to follow a Poisson distribution.
Figure 9.

The noise characteristic graph shows the standard deviation as a function of the mean pixel counts. The power fit shows that the mean pixel count is proportional to the standard deviation to the power of 1.97, which matches the property of ideal Poisson distribution, i.e., the mean pixel count is proportional to the square of the standard deviation.
Sensitivity
Figure 10 shows the Ergo detector sensitivity for both EHR and LEAP collimators as a function of distance. As expected for parallel-hole collimators, the sensitivities for both LEHR and LEAP do not vary with distance in the near-field imaging condition; the reduction in the photon fluence with distance is exactly offset by the increase in the detection area with distance, thus preserving the detection solid angle and the number of photons incident to the detector.
Figure 10.

The graph shows sensitivity as a function of distance from both LEAP and LEHR collimators. At 10 cm from the collimator, the sensitivity was 63 cps/MBq or 140 cpm/μCi for LEHR (manufacturer specification: 132 cpm/μCi) and 113 cps/MBq or 250 cpm/μCi for LEAP (manufacturer specification: 250 cpm/μCi). The uncertainty in each data marker is <1%.
Since the detector has a finite size, there exists a distance beyond which the photon fluence divergence does not cancel out with the growth of the detection area, as shown in Fig. 11. Beyond this distance, the measured sensitivity is expected to decrease since the number of photons incident to the detector is not preserved. From a purely geometrical perspective based on the dimensions of the collimators, it is expected that the sensitivities start to decrease at distances of ∼24 and ∼32 cm for LEAP and LEHR, respectively. The prediction matches the observation, as shown in Fig. 10, where the sensitivities start decreasing. Note that the decline in the sensitivity may happen at a shorter distance from the collimator, depending on the position and the geometry of the source.
Figure 11.

The illustration shows some parameters that affect sensitivity: collimator hole diameter, d; collimator hole length, h; length of the useful field of view in the short axis, 2w; the source-to-collimator distance, l; and the geometry of the source. Source 1 has a wider dimension causing the solid angle to decrease at a shorter distance from the collimator. Source 2 illustrates a point source at a distance beyond which the solid angle will decrease. Source 3 depicts a point source at a distance where the solid angle has decreased and, hence, the sensitivity decreased as well. As long as the solid angle is kept the same, sensitivity will not vary.
Energy spectra, resolution, and linearity
Table TABLE I. shows measured photopeak energies and energy resolution in FWHMs for seven photopeaks evaluated using 67Ga, 99mTc, 111In, and 201Tl. The maximum deviation of measured photopeak energy from the true photopeak energy is <1%. Figure 12 demonstrates the linearity of the measured energy peak as a function of the true energy peak in the energy range from 70 to 300 keV. The energy resolution improved with photopeak energy and was measured to be 7.4% at 140 keV.
TABLE I.
The measured photopeak mean energies and energy resolutions from 67Ga, 99 mTc, 111In, and 201Tl.
| Energy (keV) | FWHM | |||
|---|---|---|---|---|
| Radionuclide | True | Measure | (keV) | (%) |
| 67Ga | 300 | 299 | 25.5 | 8.5 |
| 111In | 246 | 247 | 22.4 | 9.1 |
| 67Ga | 185 | 184 | 17.2 | 9.3 |
| 111In | 171 | 172 | 17.9 | 10.4 |
| 99mTc | 140 | 141 | 10.4 | 7.4 |
| 67Ga | 93 | 93 | 11.4 | 12.2 |
| 201Tl | 71 | 71 | 7.7 | 10.9 |
Figure 12.

The graph shows the plot of the energy response against the true energy. The linearity of the energy response was verified in the range of 70–350 keV. The uncertainty in each data marker is ≪1%.
Extrinsic uniformity
The results of the extrinsic uniformity evaluation for several radioisotope-collimator pairs using flood-field sources are shown in Table TABLE II.. The maximum IU was <5%, and the maximum DU was <3% (both fall within the detector specifications of IU <6% and DU <4%).
TABLE II.
The IU and DU numbers for various radioisotope-collimator pairs. LEAP, low energy all purpose; LEHR, low energy high resolution.
| LEAP | LEHR | Diverging | ||||
|---|---|---|---|---|---|---|
| Nuclide | IU (%) | DU (%) | IU (%) | DU (%) | IU (%) | DU (%) |
| 99mTc | 2.82 | 2.11 | 3.22 | 2.38 | 1 | 0.81 |
| 201Tl | 4.72 | 2.26 | 3.66 | 2.31 | 1.25 | 0.87 |
| 57Co | 2.82 | 2.44 | 2.85 | 2.19 | — | — |
MWSR and pixel size
The pixel dimension was measured to be 3.29 × 3.21 mm2, using the method described in Sec. 2. The maximum discrepancy measured between two corresponding centroids in the 99mTc and 201Tl windows was 0.34 mm, i.e., within ∼10% of the pixel size.
DISCUSSION
Assessment of spatial resolution for a pixelated system offers unique challenges in near-field conditions where the FWHM of the detector is close to the pixel size. At a given distance from the collimator, the FWHM realized by a pixelated detector also depends on the relative position between the capillary tube and the detector elements. Under near field conditions, when the capillary tube is located directly above the center of a detector, the emission signal is shared by a smaller number of laterally adjacent pixels, hence leading to a narrower FWHM.On the other hand, when the tube is located directly above the edge of two pixels, the emission signal is shared by a larger number of adjacent pixels, hence leading to a wider FWHM. To minimize the dependency on the capillary tube and detector element alignment, NEMA (Ref. 9) recommends displacing the capillary tube laterally in 1-mm steps over a distance of 10 mm or two detector elements. In the near-field imaging condition, despite capillary tube displacement, this phenomenon still introduces a substantial variability in FWHMs when they are calculated using linear interpolation [NEMA (Ref. 9)] or Gaussian fitting. In this work, we calculated the FWHMs from the presampling LSFs, which minimized the variability due to undersampling.
In far field imaging condition, the capillary tubes’ line profiles get wider and spanned by more pixels; therefore, the dependency of measured FWHMs on capillary tube and detector element alignment decreases. Subsequently, the additional information gained from oversampling diminishes. Under this condition, it is expected that the results from the three FHWM calculation methods will agree with each other.
The system performance assessment suggests that Ergo has a good imaging performance capability. The count rate performance of the pixelated gamma camera is far superior compared to the traditional gamma camera. The pixelated gamma camera tested exhibits a linear count rate response up to 20 Mcts, at least. On the other hand, most traditional gamma camera cannot handle more than 1 Mcts.4 The traditional gamma cameras usually start to have 20% count loss at a count rate of few hundreds count per second.13 The sensitivity performance, however, cannot be compared directly since it depends heavily on the collimator designs, the energy window widths, and energy resolutions.
The pixelated gamma cameras also demonstrate superior energy resolution compared to the traditional monolithic gamma cameras, whose energy resolution at 140 keV is typically about 9%–10%.3, 13 Ergo having an indirect detection solid-state pixelated detector has an energy resolution at 140 keV of 7.4%, whereas GE Discovery NM750b (Ref. 14) and Gamma Medica LumaGem (Ref. 15) (Gamma Medica) having direct detection solid-state pixelated detector have 140-keV energy resolution of <6.5% and <5%, respectively.
In term of spatial resolution, Ergo also exhibits intrinsic spatial resolution of 3.3 mm that is comparable to other gamma camera designs. The intrinsic spatial resolution of Siemens Symbia (monolithic) gamma camera is 3.5 and 3.9 cm for 9.5 and 15.9-mm crystal.13 Philips FORTE and SKYlight with 9.5 - and 15.9-mm monolithic crystal have intrinsic resolutions of 2.7 and 3.2 mm, respectively.16 GE Discovery NM750b with pixel size ∼2.5 mm has an intrinsic resolution of 2.46 mm.14 Gamma Medica LumaGem with pixel size of 1.6 mm has an intrinsic resolution of 1.6 mm.15 Pixelated gamma cameras have the potential of having a higher spatial resolution compared to the traditional gamma camera.3
CONCLUSION
Herein, we describe detailed performance evaluation procedures of a new pixelated portable gamma camera system, which can also be applied to evaluate other pixelated gamma camera system. Spatial resolution assessment in near-field imaging condition offers a unique challenge where the measured FWHM is highly dependent on relative position between the capillary tube and the detector elements. By oversampling the capillary tubes’ line profiles, especially in near field, the relative position dependency can be minimized.
Although, the physics performance evaluations of the Digirad Ergo camera system suggest suitable imaging capabilities for a portable general-purpose gamma camera system, its clinical performance needs to be further evaluated by conducting reading study on both phantom studies and on actual imaging tasks. Table TABLE III. summarizes all the performance characteristics assessed for the Ergo portable gamma camera. This portable gamma camera has a high (LEAP) planar sensitivity, high energy and spatial resolutions that are comparable to other available gamma cameras. In addition Ergo also demonstrates superior count rate performance that is linear up to tens of millions count per second.
TABLE III.
Summary of measured Ergo performance characteristics.
| LEHR | LEAP | ||
|---|---|---|---|
| Native resolution (mm) at 10 cm | 7.5 (7.4) | 9.3 (10.6) | |
| Sensitivity (cps/MBq) | 63.1 (59.7) | 112.6 (113.8) | |
| (cpm/μCi) | 140.1 (132.5) | 249.9 (252.6) | |
| Pixel size (mm2) | 3.28 × 3.18 (3.31 × 3.24) | ||
| Uniformity | <5% IU, <3% DU | ||
| Count rate | verified to be linear up to 5 Mcps | ||
| Energy linearity | linear in the range of 50–350 keV | ||
Note: LEHR = low energy high resolution; LEAP = low energy all purpose; IU = integral uniformity, DU = differential uniformity. The numbers in parentheses are the manufacturer specifications.
ACKNOWLEDGMENTS
This work was supported in part by a grant from AAPM Clinical Residency Fellowship in Imaging. The authors would also like to thank the Imaging Physics Residency Program at The University of Texas MD Anderson Cancer Center and its director, Dr. Charles Willis. The authors declare that they have no conflict of interest.
References
- Peterson T. E. and Furenlid L. R., “SPECT detectors: The anger camera and beyond,” Phys. Med. Biol. 56, R145–R182 (2011). 10.1088/0031-9155/56/17/R01 [DOI] [PMC free article] [PubMed] [Google Scholar]
- Madsen M. T., “Recent advances in SPECT imaging,” J. Nucl. Med. 48, 661–673 (2007). 10.2967/jnumed.106.032680 [DOI] [PubMed] [Google Scholar]
- Kindem J., Bai C., and Conwell R., “CsI(Tl)/PIN solid state detector for combined high resolution SPECT and CT imaging,” Proceedings of IEEE Nuclear Science Symposium, NSS-2010, 1987–1990 (2010).
- Chambron J. et al. , “A pixelated γ-camera based on CdTe detectors clinical interests and performances,” Nucl. Instrum. Methods Phys. Res. A 448, 537–549 (2000). 10.1016/S0168-9002(00)00285-0 [DOI] [Google Scholar]
- Gruber G. J., Moses W. W., Drenzo S. E., Wang N. W., Beuville E., and Ho M. H., “A discrete scintillation camera module using silicon photodiode readout of CsI(Tl) crystals for breast cancer imaging,” IEEE Trans. Nucl. Sci. 45, 1063–1068 (1998). 10.1109/23.681979 [DOI] [Google Scholar]
- Hruska C. B. and O’Connor M. K., “Effect of collimator selection on tumor detection for dedicated nuclear breast imaging systems,” IEEE Trans. Nucl. Sci. 53, 2680–2689 (2006). 10.1109/TNS.2006.879824 [DOI] [Google Scholar]
- “Scintillation camera acceptance testing and performance evaluation,” AAPM Report No. 6 (American Association of Physicists in Medicine, New York, 1980).
- “Computer-aided scintillation camera acceptance testing,” AAPM Report No. 9 (American Association of Physicists in Medicine, New York, 1982).
- “Rotating scintillation camera SPECT acceptance testing and quality control,” AAPM Report No. 22 (American Association of Physicists in Medicine, New York, 1987).
- “Performance measurements of gamma cameras,” NEMA Standards Publication No. NU 1-2007 (National Electrical Manufacturers Association, Washington, DC, 2007).
- “Performance measurements of scintillation cameras,” NEMA Standards Publication No. NU 1-1986 (National Electrical Manufacturers Association, Washington, DC, 1986).
- Hubbell J. H. and Seltzer S. M., “Tables of x-ray mass attenuation coefficients and mass energy-absorption coefficients,” National Institute of Standards and Technology (available URL: http://www.nist.gov/pml/data/xraycoef/index.cfm). Last accessed December 2011.
- Kappadath S. C., Erwin W. D., and R. E.WendtIII, “Observed intercamera variability in clinically relevant performance characteristics for Siemens Symbia gamma cameras,” J. Appl. Clin. Med. Phys. 7(4), 74–78 (2006). [DOI] [PMC free article] [PubMed] [Google Scholar]
- Discovery NM 750b (General Electric) Molecular Breast Imaging Data Sheet (General Electric, 2011). [Google Scholar]
- LumaGem (Gamma Medica) site planning (available URL: http://www.gm-ideas.com/clinical_site_planning.html). Last accessed March 2012.
- Holstensson M., Partridge M., Buckley S. E., and Flux G. D., “The effect of energy and source location on gamma camera intrinsic and extrinsic spatial resolution: An experimental and Monte Carlo study,” Phys. Med. Biol. 55, 1735–1751 (2010). 10.1088/0031-9155/55/6/013 [DOI] [PubMed] [Google Scholar]