

Abstract
Much is anticipated from the development and deployment of nanomaterials in biological organisms, but concerns remain regarding their biocompatibility and target specificity. Here we report our study of the transport, biocompatibility and toxicity of purified and stable silver nanoparticles (Ag NPs, 13.1 ± 2.5 nm in diameter) upon the specific developmental stages of zebrafish embryos using single NP plasmonic spectroscopy. We find that single Ag NPs passively diffuse into five different developmental stages of embryos (cleavage, early-gastrula, early-segmentation, late-segmentation, and hatching stages), showing stage-independent diffusion modes and diffusion coefficients. Notably, the Ag NPs induce distinctive stage and dose-dependent phenotypes and nanotoxicity, upon their acute exposure to the Ag NPs (0–0.7 nM) for only 2 h. The late-segmentation embryos are most sensitive to the NPs with the lowest critical concentration (CNP,c ≪ 0.02 nM) and highest percentages of cardiac abnormalities, followed by early-segmentation embryos (CNP,c < 0.02 nM), suggesting that disruption of cell differentiation by the NPs causes the most toxic effects on embryonic development. The cleavage-stage embryos treated with the NPs develop to a wide variety of phenotypes (abnormal finfold, tail/spinal cord flexure, cardiac malformation, yolk sac edema, and acephaly). These organ structures are not yet developed in cleavage-stage embryos, suggesting that the earliest determinative events to create these structures are ongoing, and disrupted by NPs, which leads to the downstream effects. In contrast, the hatching embryos are most resistant to the Ag NPs, and majority of embryos (94%) develop normally, and none of them develops abnormality. Interestingly, early-gastrula embryos are less sensitive to the NPs than cleavage and segmentation stage embryos, and do not develop abnormally. These important findings suggest that the Ag NPs are not simple poisons, and they can target specific pathways in development, and potentially enable target specific study and therapy for early embryonic development.
Keywords: Biocompatibility, nanotoxicity, silver nanoparticle, single nanoparticle plasmonic spectroscopy, single nanoparticle tracking, zebrafish embryos
Introduction
Nanomaterials have similar sizes to biological structures and exceptional surface properties. These distinctive properties enable them to serve as unique probes to study developmental processes during embryogenesis with specific potential applications.1–3 If nanomaterials can induce developmental stage- and dose-dependent abnormalities, these nanomaterials can then be used as probes to study early embryonic development, as screening tools in developmental biology to control and regulate key developmental processes, or as target-specific regulators (therapeutic agents) for biomedical applications. In contrast to in vitro cell culture assays, whole animal studies enable one to study complex developmental processes that operate over time to form adult organisms.4–7
Noble metal nanoparticles (e.g., Ag NPs) possess distinctive optical properties with high Rayleigh scattering and superior photostability.2–3, 8–12 Their localized surface plasmon resonance (LSPR) spectra highly depend upon their physicochemical properties and surrounding environments,9–17 which enable us to use LSPR spectra of single Ag NPs to characterize their physicochemical properties (e.g., size, shape) in situ in real time.2–3, 16, 18–23 Unlike fluorescence molecules or quantum dots, single Ag NPs resist photobleaching and photoblinking.2–3, 8–9, 13, 21 These distinctive optical properties enable them to serve as photostable imaging probes for real-time study of nanoenvironments of living organisms and dynamic events of interest for any desired period of time.8, 13, 18, 21–23 We have demonstrated that Ag NP-based single-molecule nanoparticle optical biosensors (SMNOBS) can serve as photostable optical sensors and imaging probes to image single live cells and embryos in real time at nm spatial and millisecond (ms) temporal resolutions.2–3, 8, 13, 18, 21–24
Zebrafish have been widely used as a vertebrate model organism for study of embryological development because of their small size, short breeding cycle, and wealth information for molecular genetic manipulation.6, 25–31 Its transparency throughout development enables observation of internal organ development outside the chorion without disturbing the living embryo. Their embryonic development is so rapid that the early-development stages are nearly completed in the first 24 h after fertilization, and the normally developed embryo will hatch and swim by 72 h. Furthermore, the majority of the developmental mutations identified in zebrafish have close counterparts in other vertebrates,26, 32–34 suggesting that this organism can effectively be used as a model for understanding the developmental processes of higher organisms, including humans. Therefore, zebrafish embryos offer a unique opportunity to study developmental processes upon exposure to nanomaterials and to investigate the stage-dependent effects of nanomaterials on embryonic development.
Several studies have reported the observation of effects of nanomaterials on embryonic development.1–2, 19–20, 24, 35–38 However, systematic characterization of the effects of a library of well-design nanomaterials on embryonic development has not yet been carried out to validate the effectiveness of the embryos as in vivo assays. Many studies did not characterize physicochemical properties of individual NPs in vivo in situ in real time. Notably, physicochemical properties (e.g., sizes, shapes and surface properties) of individual NPs are not identical and they can alter as they are incubated with living organisms. Thus, it is crucial for ones to characterize sizes and doses of individual NPs in vivo in situ in real time, in order to quantitatively study dose and size dependent nanotoxicity.
In our previous studies, we exposed the cleavage-stage embryos to the Ag NPs chronically for 120 h and found that they died or developed to deformed zebrafish in a dose, size, surface-charge, and chemical dependent manners.1–2, 19–20, 24, 35 However, none of these previous studies permit us to investigate stage-specific abnormalities. In this study, we select vital and representative developmental-stage (cleavage, early-gastrulation, early-segmentation, late-segmentation, and hatching stages) embryos, acutely expose them to the purified and stable Ag NPs (13.1 ± 2.5 nm) for only 2 h, and then characterize their development in egg water over 120 h. This study aims to determine whether Ag NPs can incite stage-dependent abnormalities, understand their stage-dependent toxicity, and identify important embryonic developmental stages for further analysis. This study also aims to identify the most sensitive embryonic developmental stages, and use them as ultrasensitive in vivo assays to screen biocompatibility and toxicity of nanomaterials.
Experimental Section
Synthesis and Characterization of Ag NPs (13.1 ± 2.5 nm)
The Ag NPs were synthesized and characterized as we described previously.2–3, 22, 39 Briefly, silver perchlorate solution (0.1 mM in nanopure deionized (DI) water) was mixed with a freshly prepared ice-cold solution of sodium citrate (3 mM) and sodium borohydride (10 mM) under stirring overnight to produce Ag NPs. The NP solutions were filtered through a 0.22 μm filter, and washed three times with nanopure deionized (DI) water using centrifugation to remove the chemicals involved in NP synthesis. The NPs were resuspended in DI water before incubating with embryos. The washed Ag NPs were very stable (non-aggregated) in DI water for months and remained stable in egg water (1.0 mM NaCl in DI water) throughout the entire embryonic development (120 h). The supernatants of NP solutions after the third washing were collected for control experiments to study the effect of trace chemicals involved in NP synthesis on the embryonic development.
The concentrations, optical properties, and sizes of NPs were characterized using UV-vis spectroscopy, dark-field optical microscopy and spectroscopy (DFOMS), dynamic light scattering (DLS), and high-resolution transmission electron microscopy (HR-TEM) (FEI Tecnai G2 F30 FEG).2, 20, 22–24 Our DFOMS has been well described previously for real-time imaging and spectroscopic characterization of single NPs in solutions, single live cells and single embryos, and for single molecule detection.1–3, 8–9, 13–14, 18–23, 35, 40–42 In this study, EMCCD camera coupled with a SpectraPro-150 (Roper Scientific) was used to characterize LSPR spectra of single NPs. A high-resolution CCD camera (Micromax, 5 MHz, interline) was used to study the transport and diffusion of single NPs in solution and in embryos. All chemicals were purchased from Sigma and used without further purification or treatment. We used the nanopure DI water (18 MΩ, Barnstead) to prepare solutions and rinse glassware.
Breeding and Monitoring of Zebrafish Embryos
Wild type adult zebrafish (Aquatic Ecosystems) were maintained, bred, and collected, as described previously.1–3, 19–20, 24, 35, 43 Each given developmental stage embryos were collected, transferred into a petri dish containing egg water, and washed three times with egg water to remove the surrounding debris. The washed embryos were then used for real-time imaging of the stage-dependent diffusion and transport of single Ag NPs into/in embryos and for study of their dose and stage dependent effects on embryonic development. All experiments involving embryos and zebrafish were conducted in compliance with IACUC guidelines.
In Vivo Real-time Imaging of Diffusion and Transport of Single Ag NPs into/in Embryos
We incubated the given-stage embryos with 0.2 nM Ag NPs in a microchamber and immediately imaged the transport and diffusion of single NPs into/in embryos using our DFOMS. We also incubated the given-stage embryos with 0.2 nM Ag NPs for 2 h, thoroughly rinsed them with egg water to remove external NPs, and incubated them with egg water to study the transport and diffusion of single NPs in embryos using DFOMS. We acquired LSPR spectra and colors of single Ag NPs using DFOMS, and used their distinctive plasmonic colors to identify and distinguish them from embryonic debris and zebrafish tissues, which appear white under dark-field illumination.
Study of Dose and Stage-Dependent Toxicity of the Ag NPs
The given-stage embryos were incubated with a dilution series of the Ag NPs (0, 0.02, 0.04, 0.05, 0.06, 0.07, 0.2, 0.4, 0.5, 0.6, and 0.7 nM) or (0, 0.15, 0.30, 0.37, 0.45, 0.52, 1.34, 2.60, 3.94, 4.61, and 4.90 mg/L) for 2 h (acute treatment). Molar concentrations of NPs were calculated as we described previously.1–3, 19–20, 24, 35 The embryos were then thoroughly rinsed with egg water to remove external NPs, and placed in the wells of a 24 well-plate containing egg water with 4 embryos per well. As control experiments, the embryos that had been incubated with egg water (blank control) or supernatant (in the absence of NPs) for 2 h were rinsed and placed in two rows of the same well plates, aiming to determine the potential effects of trace chemicals from NP synthesis.
The embryos in the well plates were incubated at 28.5°C, and directly imaged at room temperature every 24 h using an inverted microscope (Zeiss Axiovert) equipped with a digital color camera, aiming to study the stage-dependent embryonic development. Each experiment was carried out at least 3 times and 48 embryos were studied for each given NP concentration and each stage of the embryos to gain representative statistics.
Results and Discussion
Synthesis and Characterization of Purified and Stable Ag NPs (13.1 ± 2.5 nm)
We have synthesized and purified spherical Ag NPs using the approaches described in Methods.2–3, 13–14, 40 We characterized sizes, shapes and plasmonic optical properties of the purified Ag NPs dispersed in egg water (embryonic medium) for 120 h using high resolution transmission electron microscopy (HRTEM), and dark-field optical microscopy and spectroscopy (DFOMS) (Figure 1). TEM image and histogram of size distribution of single Ag NPs show the spherical NPs with average diameters of 13.1 ± 2.5 nm, ranging from 10 to 20 nm (Figure 1A and B).
Figure 1. Characterization of sizes, shapes and plasmonic optical properties of single Ag NPs dispersed in egg water at 28.5 °C for 120 h.

(A) HRTEM images show the spherical shaped Ag NPs.
(B) Histogram of size distribution of single Ag NPs determined by HRTEM indicates their average sizes of 13.1 ± 2.5 nm.
(C) Dark-field optical images of single Ag NPs in egg water show that the majority of NPs are blue with some being green and red.
(D) Representative LSPR spectra of single Ag NPs in (C) show peak wavelengths (full-width-at-half-maximum), λmax (FWHM): (a) 468 (38), (b) 554 (47), and (c) 659 (47) nm, for the plasmonic blue, green and red NPs, respectively. The scale bars are 10 nm in (A) and 2 μm in (C). The scale bar in (C) shows the distances among NPs, but not their sizes due to optical diffraction limit. Concentration of Ag NPs is 0.7 nM.
A representative optical image of single Ag NPs shows that the majority of NPs are blue with some being green and a few red (Figure 1C). The LSPR spectra of single blue, green and red Ag NPs show peak wavelengths (full-width-at-half-maximum), λmax (FWHM), of 468 nm (38 nm), 554 nm (47 nm), and 659 nm (47 nm), respectively (Figure 1D). Notably, the LSPR spectra of single Ag NPs highly depend upon their size, shape, dielectric constant, and surrounding environment. The red shift of their LSPR spectra suggests that a very few NPs may have high aspect ratios, rough surfaces or larger sizes that have gone undetected by TEM. The results demonstrate the powerful detection capabilities of DFOMS to identify and characterize very few individual NPs in a mix population of NPs in solution.
We also determine the solubility and stability (non-aggregation) of the Ag NPs suspended in egg water (0.7 nM) over 120 h at 28.5 °C by characterizing their number, concentrations and sizes over time using DFOMS, UV-vis spectroscopy and dynamic light scattering (DLS) (Figure 2), respectively. We characterize the stability of various concentrations of the Ag NPs in egg water and determine the highest concentration of Ag NPs (0.7 nM) that are stable in egg water and use it in this study. The results show that the number of NPs suspended in egg water remains essentially unchanged over 120 h (Figure 2A), indicating that the Ag NPs are very stable (non-aggregated) in egg water over time. Furthermore, UV-vis absorption spectra of the NPs show that their peak absorbance of 0.49 at 393 nm (FWHM = 64 nm) remain unchanged, indicating that NP concentration in egg water remains unchanged (Figure 2B). The sizes of Ag NPs in egg water (13.2 ± 3.1 nm) also remain unchanged over their 120-h incubation in egg water, as determined by DLS (Figure 2C). Taken together, the results (Figure 2) show that the Ag NPs are very stable (non-aggregated) in egg water over 120 h. If NPs were aggregated, the number of NPs suspended in egg water and its concentration would have decreased, and their sizes would have increased over time. That is not what we observed. Thus, the Ag NPs are very stable and remain unchanged in egg water over 120 h.
Figure 2. Study of stability (non-aggregation) of Ag NPs dispersed in egg water at 28.5 °C for 120 h.

(A) The average number of NPs per image at 0, 12, 24, 48, 72, 96, and 120 h is (65 ± 0), (66 ± 2), (67 ± 3), (67 ± 4), (70 ± 5), (67 ± 3), and (67 ± 4), respectively, which remains essentially unchanged over 120 h. The 20 images similar to those in Figure 1C are acquired at each given time using DFOMS.
(B) UV-Vis absorption spectra of the NPs dispersed in egg water at 28.5 °C for (a) 0 and (b) 120 h show that the background-subtracted peak absorbance of 0.49 at 393 nm (FWHM = 64 nm) remains unchanged over their 120-h incubation with egg water.
(C) Histograms of size distributions of the NPs dispersed in egg water and measured by DLS show their average diameters of (13.2 ± 3.1) nm at: (a) 0 and (b) 120 h, which indicates that the sizes of NPs remain unchanged and the NPs are stable (non-aggregated) in egg water over their 120-h incubation.
It is essential for one to use purified and stable NPs to study their dose, size and stage-dependent effects on embryonic development. The unpurified Ag NPs contain undetermined amounts of a wide range of chemicals (e.g., AgNO3, sodium citrate, etc) involved in NP synthesis. These chemicals, instead of the NPs, can potentially cause different effects on embryonic development, and lead to inconclusive or irreproducible results. Furthermore, unstable Ag NPs in egg water could alter their sizes and concentrations over time, due to aggregation, and lead to various sizes and doses of NPs, which would make the study of dose and size dependent nanotoxicity unreliable. Thus, we strive to prepare and characterize the purified and stable Ag NPs first, and then study their dose, size and stage dependent effects on embryonic development.
In this study, we use molar concentrations of the NPs to describe their transport and dose dependent effects on embryonic development. Molar concentrations of single Ag NPs (but not atoms or ions) are determined by dividing moles of Ag NPs (number of NP/Avogadro constant) by total solution volume, as we described previously.1–3, 19–20, 35
It is worth noting that molar concentration of the NPs is the most appropriate unit to characterize and describe dose and stage dependent effects of the NPs on embryonic development because molar concentration is proportional to the number and surface properties of individual NPs, and it enables the study of dose (number) and surface dependent effects of the NPs. Furthermore, unlike conventional chemicals, individual NPs are independent entities and have its own NP weights and its own physicochemical properties (e.g., sizes, morphologies, surface areas, reactivity, and optical properties). Thus, weight of different sizes of the NPs cannot be described by the same atomic weight of Ag, and the w/v (weight/volume) of Ag NPs cannot be used to accurately describe NP concentration. Notably, the same w/v of different-sized NPs contains different number of the NPs, different surface areas and charges. Therefore, the w/v concentration does not represent number (doses) of NPs, and cannot accurately reflect dose (number) and surface dependent effects of NPs on embryonic development.
Early-Developing Embryos as In Vivo Model Organisms and Assays
Optical images (Figure 3) show normally developing zebrafish embryos at: (A) cleavage (0.75–2.25 hours-post-fertilization, hpf), (B) early-gastrula (6 hpf), (C) early-segmentation (12 hpf), (D) late-segmentation (21 hpf), and (E) hatching stage (48 hpf). We name them (A–E) as stage I–V embryos, respectively. We select the embryos at these five critical developmental stages, incubate them with given doses (0–0.7 nM) of the Ag NPs for only 2 h (acute treatment), thoroughly rinse them with egg water to remove external NPs, and then incubate them in egg water at 28.5 °C over 120 h until they fully develop.
Figure 3.
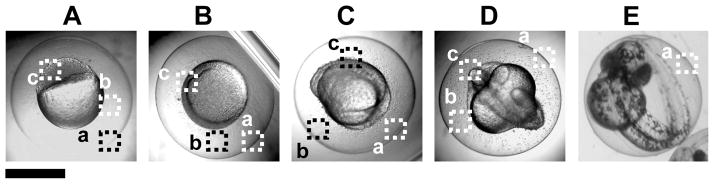
Optical images of specific developmental stages of zebrafish embryos: (A) cleavage (2 hour-post-fertilization, hpf), (B) early-gastrula (6 hpf), (C) early-segmentation (12 hpf), (D) late-segmentation (21 hpf), and (E) hatching stage (48 hpf), which are incubated with given doses of Ag NPs for 2 h (acute treatment). We name them (A–E) as stage I–V embryos, respectively. The representative areas of (a) chorion layer (CL), (b) chorion space (CS) and (c) interface of inner mass of the embryo (IME) and CS are highlighted by dash-lined squares.
These five developmental stages are vital checkpoints of embryonic development. Cleavage-stage embryos (stage-I: 2–4 hpf) undergo dramatic changes (e.g., rapid cellular division and embryonic pattern formation) to lay down the foundation for the development of different parts of organs.44–45 Gastrula-stage embryos (stage-II: 6–8 hpf) undergo cell movements and migrations to establish the early organ systems.46–47 Early segmentation stage embryos (stage-III: 12–14 hpf) begin morphological cell differentiation, morphological movements, somitogenesis and notochord formation, which is important for proper development of the axial skeleton, the vertebrate spinal column, and the skeletal muscle.46, 48 Late segmentation stage embryos (stage IV: 21–23 hpf) undergo development of the circulatory system and the formation of heart.46 The hatching-stage embryos (stage V: 48–50 hpf) are finishing up their embryonic development. At this stage, all related organs have been formed.43, 46
Notably, massive amount of embryos can be generated rapidly (over night) at very low cost. Furthermore, in vivo organisms (embryos) have numerous advantages over in vitro cultured cells for study of biocompatibility and toxicity of NPs. For instance, embryos enable one to simultaneously investigate the effects of NPs upon a wide variety of cells, and detect all related toxicity pathways, including reactive oxygen species formation, engagement of apoptotic pathways and disruption of regulatory signaling in the developing embryos. In contrast, an in vitro assay typically uses a single type of cultured cells and can miss vital cell-specific interactions. Thus, the given-stage embryos can potentially serve as ultrasensitive and high-throughput in vivo assays to screen biocompatibility, toxicity and therapeutic effects of nanomaterials.
Real-Time Study of Stage-Dependent Transport of Single Ag NPs into/in Embryos
To study the potential stage-dependent transport and diffusion of single Ag NPs into/in embryos, we incubate Ag NPs with the given-stage embryos (Figure 3A–E) and directly image their diffusion and transport into and inside the embryos in real time. We focus on three critical locations of embryos: chorion layers (CL), chorion space (CS) and interface of inner mass embryos (IME) and CS, as marked by squares of (a–c) in Figure 3A–E, aiming to determine whether and how single NPs transport into embryos from egg water. Note that the monomode (black/white) of the camera with the highest speed is used to track the diffusion of single NPs in real time (Figures 4–6). We acquire LSPR spectra and colors of single Ag NPs using DFOMS (Figure 1D), and use their distinctive plasmonic colors and spectra to identify and distinguish individual NPs from each other, and from embryonic debris and tissues, which appear white under dark-field illumination. Real-time sequential optical images coupled with distinguished LSPR spectra of single NPs enable us to track the same NPs as they diffuse into and through the embryos over time.
Figure 4.

Real-time imaging of transport and diffusion modes of single Ag NPs in chorion layers (CL) of stage I–V embryos. (a) Optical images show that single Ag NPs (as circled) diffuse from outside chorion (OC) through the pores (an array of white dots) of the CL (highlighted by two dashed lines) into the CS. Each pore has diameters of 0.5–0.7 μm and distances between neighboring pores are 1.5–2.5 μm. (b) Diffusion trajectories and (c) plots of real-time square displacement (RTSD) of single NPs versus diffusion time show stationary random Brownian motion of the NPs in the CL of stage I–V embryos with diffusion coefficients of: (A) (2.7 ± 2.4) × 10−10, (B) (2.8 ± 2.6) × 10−10, (C) (8.8 ± 11) × 10−10, (D) (1.6 ± 1.4) × 10−9, and (E) (8.3 ± 8.5) × 10−10 cm2 s−1, respectively. Scale bars are 10 μm in (a), and each pixel is 0.067 μm in (b).
Figure 6.

Real-time imaging of transport and diffusion modes of single Ag NPs from the CS into the inner mass of the embryo (IME) of stage I–IV embryos. (a) Optical images show that single Ag NPs (as circled) diffuse from CS into IME. The interface of CS and IME are highlighted by dashed lines. (b) Diffusion trajectories and (c) plots of RTSD of single NPs versus diffusion time show simple and constrained Brownian motion of the NPs at the interface of IME and CS of stage I–IV embryos, and their diffusion coefficients of: (A) (3.1 ± 0.2) × 10−10, (B) (1.4 ± 0.9) × 10−9, (C) (1.3 ± 1.1) × 10−9, and (D) (9.4 ± 5.1) × 10−10 cm2 s−1, respectively. Scale bars are 10 μm in (a), and each pixel is 0.067 μm in (b).
Optical images of the CL, the interface between egg water and CS of stage I–V embryos as marked by two dash-lines in Figure 4a, show an array of chorionic pore canals (CPCs, white dots as squared), and single Ag NPs diffuse through the pores into the embryos as those circled. Each pore has diameters of 0.5–0.7 μm and distances between neighboring pores are 1.5–2.5 μm, which are similar to those we reported previously for cleavage-stage embryos.1–3, 20 They show insignificant difference among the various stages of embryos. Diffusion trajectories of single Ag NPs (Figure 4b) show that single Ag NPs zigzag through the pores and enter the CS. The majority of single NPs pass through the pores and enter the CS of embryos, while a very few of NPs are trapped inside the pores from time to time.
To determine the diffusion modes of entry of single Ag NPs into/in the embryos, we use the concept of diffusion theories and models (e.g., direct, simple and stationary Brownian diffusion).49–51 In this study, we use real-time square-displacement (RTSD) (diffusion distance at a given time interval), instead of mean-square-displacement (MSD, average of diffusion distances over time), to study diffusion of single NPs in developing embryos in vivo in real time. This is because nanoenvironments of developing embryos change rapidly over time, and show high viscosity gradients. Therefore, their diffusion coefficients vary drastically as single NPs diffuse in developing embryos, and RTSD is more accurate to study diffusion modes of single Ag NPs in embryos than MSD.
Plots of RTSD versus time (Figure 4c) show step-wise linearity, which demonstrate that single NPs make several attempts to zigzag through the pores and enter the CS. The results show stationary Brownian diffusion of single NPs and suggest that random walk and passive diffusion of single NPs enable them to pass through the CL and enter the CS. We use the slopes of linear portions of the plots to determine the diffusion coefficient (D) of single NPs by dividing the slopes by 4 (Note: RTSD = 4Δ3t) using 2D random walk theory, because each microscopic image records the 2D diffusion of single NPs. The diffusion coefficients of single Ag NPs for the CL of the stage I–V embryos are (2.7 ± 2.4) × 10−10, (2.8 ± 2.6) × 10−10, (8.8 ± 11) × 10−10, (1.6 ± 1.4) × 10−9, and (8.3 ± 8.5) × 10−10 cm2 s−1, respectively. The results show large standard deviations of diffusion coefficients even for the CL of the same stage of embryos, suggesting high heterogeneity of embryonic nano-environments, which make the study of stage-dependent diffusion coefficients difficult.
Optical images and diffusion trajectories of single Ag NPs in the CS of stage I–IV embryos (Figure 5a and 5b) show that single Ag NPs diffuse in the CS. Plots of RTSD versus time (Figure 5c) show linearity and indicate simple random Brownian diffusion of single NPs in the CS. As described above, we use the slopes of linear portions of the plots to determine the diffusion coefficients of single NPs in the CS of stages I–IV embryos. They are (3.4 ± 1.2) × 10−9, (1.5 ± 0.4) × 10−9, (4.0 ± 1.9) × 10−10, and (1.0 ± 0.4) × 10−9, respectively.
Figure 5.

Real-time imaging of transport and diffusion modes of single Ag NPs in chorion space (CS) of the stage I–IV embryos. (a) Optical images show that single Ag NPs (as circled) diffuse in CS. The CL and the interface of IME and CS are highlighted by dashed lines. (b) Diffusion trajectories and (c) plots of RTSD of single NPs versus diffusion time show simple random Brownian motion of the NPs in the CS of stage I–IV embryos with diffusion coefficients of: (A) (3.4 ± 1.2) × 10−9, (B) (1.5 ± 0.4) × 10−9, (C) (4.0 ± 1.9) × 10−10, and (D) (1.0 ± 0.4) × 10−9 cm2 s−1, respectively. Scale bars are 10 μm in (a), and each pixel is 0.067 μm in (b).
Optical images and diffusion trajectories of single Ag NPs at the interface of CS and IME of stage I–IV embryos (Figure 6a and 6b) show that single Ag NPs diffuse into the IME from the CS. Plots of RTSD versus time (Figure 6c) show step-wise linearity. The results indicate that simple random Brownian diffusion of single NPs enables them to passively diffuse into the IME from the CS. The results also suggest that the NPs are halted from time to time as they diffuse through the interface between CS and IME. We use the slopes of linear portions of the plots to determine the diffusion coefficient of single NPs at the interface of CS with IME for stages I–IV embryos. They are (3.1 ± 0.2) × 10−10, (1.4 ± 1.0) × 10−9, (1.3 ± 1.1) × 10−9, and (9.4 ± 5.1) × 10−10, respectively. We can not determine diffusion and trajectories of the NPs both in CS and in the IME of the stage-V (hatching) embryos due to their movement.
Notably, diffusion coefficients of single NPs are inversely proportional to the sizes of NPs and viscosities of medium, as described by Stokes-Einstein equation, D = kT/(6πηa), where k is Boltzmann constant; T is temperature; a is radii of single NPs; and η is viscosity of medium where NPs diffuse in.52 Thus, the diffusion coefficients of the same-sized NPs (Figures 4–6) enable us to study the location-dependent viscosities of embryonic environments. The results (Figures 4–6) show the highest barrier (viscosity) at the CL, followed by the interface of CS and IME, and the lowest one in CS, for single NPs to diffuse into/in embryos, as those we reported previously.1–3, 20 Nonetheless, due to the high heterogeneity of embryonic nano-environments, we observe insignificant stage-dependent diffusion coefficients among various stages of embryos.
Dose- and Stage-Dependent Biocompatibility and Toxicity of Ag NPs
We expose stage I–V embryos with a dilution series of Ag NPs (0–0.7 nM) for 2 h and monitor their development in egg water over 120 h. The results show that the NPs induce stage and dose-dependent nanotoxicity toward the embryonic development (Figure 7). As the NP concentration increases from 0 to 0.7 nM, the percentages of embryos that develop normally decrease.
Figure 7.

Study of dose and stage-dependent toxic effects of Ag NPs on embryonic developments. Histograms show that the percentages of given-stage embryos (A–E: stages I–V) that have been incubated with given concentrations of Ag NPs or (F) supernatant for 2 h, develop to normal and deformed zebrafish or die in egg water over 120 hpf. Deformed zebrafish are not observed for (B) stage-II and (E) stage-V embryos treated with the NPs, or any stages of embryos treated with the supernatants. The 48 embryos are used for each NP concentration and each given stage embryos, and error bars represent standard deviations of 4 replicated experiments. Each experiment includes 4 replicates with 4 embryos for each replicate measurement.
For stage-I embryos (Figure 7A), (56 ± 5)% of the embryos develop normally, (31 ± 10)% of them die and (13 ± 4)% of them develop to deformed zebrafish over 120 h, upon their acute exposure to 0.02 nM NPs (the lowest dose) for 2 h. The percentages of dead embryos and deformed zebrafish increase sharply as the NP concentration increases, and only 48% (< 50%) of embryos develop normally as the NP concentration increases to 0.04 nM, which is around the critical concentration at which 50% of embryos develop normally (Table 1). At 0.2 nM NPs, only (3 ± 2)% of the embryos develop normally, (67 ± 14)% of them die and (31 ± 7)% develop to deformed zebrafish. At 0.5 nM NPs, none of embryos develop normally, (25 ± 14)% of them die and (75 ± 4)% develop to deformed zebrafish. At 0.7 nM NPs, the percentages of dead embryos increase to (75 ± 4)%, while the percentages of embryos that develop to deformed zebrafish decrease to (25 ± 4)%.
Table I.
Summary of Stage-Dependent Critical Concentrations of Ag NPs (13.1 ± 2.5 nm) toward Embryonic Development
Developmental stage of zebrafish embryos used to incubate with the Ag NPs for 2 h
Concentration of the Ag NPs that causes only 50% of embryos develop normally
Unlike stage-I embryos, majority of stage-II embryos (75%) develop normally, only 25% of them die, and none of embryos develop to deformed zebrafish, upon their acute exposure to 0.02 nM NPs for 2 h (Figure 7B). The percentages of embryos that develop normally decrease much more gradually than stage-I embryos as the NP concentration increases. The 46% of embryos (< 50%) develop normally as the NP concentration increases to 0.2 nM, which is around the critical concentration (Table 1). At 0.7 nM NPs, (29 ± 10)% of the embryos still develops normally, while (71 ± 10)% of them die.
For stage-III embryos (Figure 7C), only (41 ± 13)% of embryos develop normally, while (59 ± 13)% of them die and none of them develop to deformed zebrafish over 120 h, upon their acute exposure to 0.02 nM NPs for 2 h. The results indicate that the critical concentration of NPs to induce nanotoxicity is less than 0.02 nM. The percentages of stage-III embryos that develop normally decrease even more drastically, while dead embryos and deformed zebrafish increase even more sharply, than those of stage-I embryos, as the NP concentration increases. At 0.07 nM NPs, none of the embryos develop normally, (66 ± 5)% of them die and (34 ± 5)% of them develop to deformed zebrafish. At 0.7 nM, the percentages of dead embryos increase to 100%, while the percentages of embryos that develop to deformed zebrafish decrease to zero.
For stage-IV embryos (Figure 7D), only (19 ± 9)% of the embryos develop normally, while (38 ± 3)% of them die and (44 ± 4)% of them develop to deformed zebrafish, upon their acute exposure to 0.02 nM NPs for 2 h. Thus, the critical concentration of the NPs that cause only 50% of the embryos develop normally is far below 0.02 nM. The percentages of the embryos that develop normally then decrease gradually, and dead embryos and deformed zebrafish increase gradually, as the NP concentration increases. At 0.7 nM NPs, none of the embryos develop normally, (63 ± 18)% of them die and (38 ± 18)% of them develop to deformed zebrafish.
For stage-V embryos (Figure 7E), majority of the embryos (94%) develop normally, and only 6% of them die, upon their acute exposure to 0.02 nM NPs for 2 h. The percentages of embryos that develop normally decrease even much more gradually than those of stage-II embryos as the NP concentration increases from 0.02 to 0.2 nM. At 0.7 nM NPs, (44 ± 7)% of embryos (< 50%) still develop normally, and (56 ± 7)% of embryos die. Thus, the critical concentration of NPs that create nearly half of normal zebrafish is ~0.7 nM (Table 1). Similar to stage-II embryos, none of stage-V embryos develop to deformed zebrafish upon their acute exposure to the NPs (0–0.7 nM) for 2 h.
Two control experiments are carried out simultaneously by incubating stage I–V embryos with egg water alone (blank control) and supernatant collected from the last washing of the NPs for 2 h, and monitoring the embryonic development in egg water over 120 h. Similar to those of blank control, (80–100)% of embryos develop normally, and none of embryos develop to deformed zebrafish, which are independent upon the concentrations (doses) of supernatant (Figure 7F). The control experiments with the supernatants allow us to eliminate potential toxic effects of trace chemicals (e.g., Ag+) resulted from the Ag NP synthesis or their potential degradation over time, and to validate that the observed toxic effects of the NPs on embryonic development are attributed to the NPs, but not other chemicals.
Taken together, these interesting findings show unambiguous stage- and dose- dependent toxic effect of Ag NPs upon embryonic development. Unlike what we observed in the large Ag NPs (97 ± 13 nm),53 the results show that stage-IV embryos are most sensitive to the toxic effects of the NPs with the lowest critical concentration of NPs (≪ 0.02 nM), which is followed closely by stage-III (< 0.02 nM), stage-I (0.04 nM), and stage-II embryos (0.2 nM), while stage-V embryos are most resistant to the NPs with a critical concentration of 0.7 nM (Table I).
Notably, for stage-IV and III embryos, the first cells differentiate morphologically, and the first body movements appear. A wide variety of morphogenetic movements occur, the somite develops and rudiments of the primary organs (e.g., heart) become visible.54 Thus, the effects of the NPs on embryonic development are likely to be more direct, perhaps disrupting cell differentiation, which leads to the highest level of toxicity. Interestingly, the exposure of the stage-I embryos to the NPs creates lasting and severe effects on the embryonic development, which may be attributed to the disruption of the earliest determinative events. In contrast, stage-V (hatching) embryos have nearly completed their development of most of the key organs required for their survival.54 Thus, they are much more resistant to the effects of NPs, and their exposure to the Ag NPs generates least impacts on their development. Notably, the toxic effects of NPs on embryonic development increase with their concentration, suggesting an unclear threshold. These results indicate that Ag NPs may not be simple poisons and suggest that they may have specific targets during embryonic development. Our observations of stage-specific morphological defects (Figures 8 and 9) further support such hypothesis.
Figure 8.

Optical images of (A–C) deformed and (D) normally developed zebrafish. (A–C) Deformed zebrafish are observed as (A) stage-I, (B) stage-III, and (C) stage-IV embryos have been incubated with the Ag NPs for 2 h (acute treatment), and develop in egg water over 120 hpf, which show (a) finfold abnormality; (b) tail/spinal cord flexure; (c) cardiac malformation/edema; (d) yolk sac edema, and (e*) and (f*) acephaly (*the severest and rare deformation with no-head, but beating heart). Scale bar is 500 μm for all images
Figure 9.

Study of dose and stage-dependent embryonic developmental abnormalities: (A) stage-I, (B) stage-III, and (C) stage-IV embryos. Histograms of distribution of percentages of the given stage embryos, which have been incubated with given concentrations of the NPs for 2 h, and develop to deformed zebrafish in egg water at 120 hpf with: (a) finfold abnormality; (b) tail/spinal cord flexure; (c) cardiac malformation/edema; (d) yolk sac edema, and (e and f) acephaly for (A) stage-I embryos, and (a–d) for (B) stage-III and (C) stage-IV embryos. For each given stage embryos, the percentages of the embryos that develop to each given abnormality are calculated by the number of embryos that develop to the given abnormality by the total number of embryos that develop to all types of deformed zebrafish.
Stage-Specific Embryonic Phenotypes
After stage-I embryos are exposed to the Ag NPs for 2 h, some of the embryos develop to deformed zebrafish with all five types of abnormalities, including (a) abnormal finfold, (b) tail/spinal cord flexure, (c) cardiac malformation, (d) yolk sac edema, and (e–f) acephaly (no-head) (Figure 8A). Acephaly (a rarely observed severe phenotype) is only observed for stage-I embryos treated with the higher NP concentrations (0.06 and 0.6 nM) (Figure 8A: e and f). The deformed zebrafish has a small amount of tissue where the head would normally develop. The tissue is not a fully formed head but rather an irregular formed mass of tissue.
Interestingly, after stages III and IV embryos are treated with the Ag NPs for 2 h, we observe only four types of abnormalities (a–d) (Figure 8B and C), without acephaly. Notably, none of stages II and V embryos develop to any type of deformed zebrafish, upon their acute exposure to the NPs (0–0.7 nM). This is most likely due to the specific time of development because the cells in cleavage-stage embryos are in the process of cleaving to lay out the map to form the head and caudal regions of the developing organism. If the cells do not divide properly, then one region of the body axis will not be fully formed. Previous studies have showed that inhibiting p38 kinase activity led to undivided blastomeres on one side of the embryonic mass.55
Finfold abnormalities with the affected median finfold region (Figure 8a) are one type of shared abnormalities of deformed zebrafish developed from stages I, III, and IV embryos treated with the NPs. In normally developed zebrafish (Figure 8D), the median finfold is a clear, thin membrane around the entire trunk region containing un-segmented fin rays. In the deformed zebrafish, the tissue structures of the finfold are disorganized, and in the severest cases, the shapes of the finfold and fin rays are altered (Table S1 in supporting information and Figure 8a).
Abnormal tail/spinal cord flexures are the other shared defects of deformed zebrafish developed from stages I, III, and IV embryos treated with the NPs (Figure 8b). This defect is often accompanied by finfold abnormalities. In normally developed zebrafish (Figure 8D), the notochord and spinal cord develop straight to the posterior-most tip of the tail. However, in the deformed zebrafish, the tail regions are flexed to some extent. The severity of tail flexures increases with NP concentration. In the severest cases, the flexure is extreme and the overall length of the tail is reduced (Table S1 in supporting information and Figure 8b).
Cardiac malformation and edema are another type of the shared abnormalities of the deformed zebrafish developed from stages I, III, and IV embryos treated with the NPs (Figure 8c). In contrast to normally developed zebrafish (Figure 8D), the pericardial sac region of deformed zebrafish developed from the treated embryos is swollen and enlarged (Figure 8c). In the severest cases, the pericardial sac is extremely large and the size of cardiac ventricle is reduced (Table S1 in supporting information and Figure 8c).
Yolk sac edema is another type of the shared abnormalities of deformed zebrafish developed from stages I, III and IV embryos treated with the NPs (Figure 8d). In normally developed zebrafish (Figure 8D), the yolk sac region is a bulbous area containing yolk that provides nutrients to the developing embryos and it shrinks during the later developmental stages. In contrast, the deformed zebrafish show swollen and enlarged yolk sac region (Figure 8d). In some cases, they also display edema of the pericardial sac region (Table S1 in supporting information and Figure 8d).
Finfold abnormalities account for the majority of defects of deformed zebrafish developed from the stages I and III embryos treated with the NPs with accumulation percentages of 35% and 36% (sum of percentages of the finfold abnormalities observed in all NPs concentrations), respectively (Figure 9A, B). The percentages of finfold abnormalities increase as the NP concentration increases. For stage-I embryos, cardiac malformation/edema (23%), the tail flexure (20%), and yolk sac edema (20%) are the secondary defects with nearly equal amount, and acephaly (2%) is the rarely observed defect. For stage-III embryos, the cardiac malformation (25.5%) and yolk sac edema (25.5%) is the secondary defects with the equal percentages, and the tail flexure (13%) is the tertiary abnormality. In contrast, cardiac malformation/edema is the primary abnormality of deformed zebrafish developed from the stage IV embryos treated with the NPs with accumulation percentages of 44% (Figure 9C). The yolk sac edema (26%) is the secondary defect. Finfold abnormality (18%) is the tertiary, and the tail flexure (12%) is the quaternary.
For stage-I embryos, organ structures (e.g., finfold, tail, cardiac, and head) are not yet present; presumably the earliest determinative events that will generate these structures are ongoing. Thus, the defects we observed 4 days later (at 120 hpf) must have been downstream effects of disruptions occurring at the level of determination, and/or the effects of retention of NPs following earlier exposures. Specific determinative processes disrupted by the NPs may include their effects on gene transcription, cell signaling and cell-cell communication. Treatment of stage-I embryos uniquely produces acephalic abnormality (Figure 8e and f). The occurrence of this defect is notable given that the formation of head structures will not occur until many hours following the exposure, suggesting that Ag NPs target regulatory molecules during this determinative stage of development. The acephalic phenotype bears a resemblance to that seen in dickkopf (ddk) zebrafish mutants.56 This cysteine-rich protein is thought to be a key inducer required for head formation in zebrafish.
For stage-III embryos, the differentiation of organ structures and formation of somites and notochord are underway. These structures are important for proper development of the axial skeleton, the vertebrate spinal column, and the skeletal muscle.48 Thus, the effects of the NPs upon the developmental abnormalities are likely to be more direct, perhaps disrupting the synthesis of key proteins (e. g., actin) and/or the formation of cytoskeletal structures required to support finfold and somite formation and their proper organization.57
For stage-IV embryos, the formation of last somites, circulatory system and heart occurs.46, 54 The heart is preparing for its first contraction.46 Like stage-III embryos, the effects of the NPs upon the developmental abnormalities are likely to be more direct, perhaps disrupting the formation of circulatory system and heart, which leads to the primary cardiac malformation/edema with extremely large pericardial sac and small cardiac ventricles.
Supplementary Material
Summary of normal and deformed zebrafish developed from given-stage embryos treated with the Ag NPs
Summary.
In summary, we have synthesized, purified and characterized nearly spherical shaped Ag NPs with average diameters of (13.1 ± 2.5) nm. We found that the Ag NPs passively diffuse through the CL into various developmental stages of embryos via choronic pores, in CS and into IME, showing insignificant stage-dependent diffusion modes and diffusion coefficients due to the high heterogeneity of embryonic nano-environments. The CL creates the highest barrier (viscosity) for single Ag NPs to diffuse across, while CS offers the lowest viscosity for the NPs to diffuse around. Notably, the Ag NPs incite distinctive stage-dependent toxicity and create stage-specific phenotypes upon their exposure to the NPs (0.02–0.7 nM) for only 2 h, instead of 120 h. The results show unambiguous stage- and dose-dependent toxic effect of Ag NPs upon embryonic development. Unlike what we observed in the large Ag NPs (97 ± 13 nm),53 late-segmentation stage embryos are most sensitive to the toxic effects of the NPs with the lowest critical concentration of NPs (≪ 0.02 nM), which is followed by early-segmentation stage (0.02 nM), cleavage-stage (0.04 nM), and gastrula-stage embryos (0.2 nM), while hatching embryos are most resistant to the NPs (0.7 nM). Cleavage-stage embryos develop to five types of abnormalities, including rarely observed acephaly (no-head), while early and late-segmentation stage embryos develop to only four types of abnormalities without acephaly. None of gastrula and hatching embryos develops abnormally. Interestingly, the observed defects of treated cleavage-stage embryos suggest that NPs create downstream effects of disruptions of early determinative events. The late-segmentation stage embryos develop to deformed zebrafish with primary cardiac malformation/edema, suggesting that the NPs may create direct effects upon embryonic development. Notably, the toxic effects of NPs on embryonic development increase with their concentration, showing an unclear threshold, and suggesting that Ag NPs can create specific targets during embryonic development. Molecular experiments are in progress to identify possible regulatory targets for Ag NPs, and their related mechanisms.
Acknowledgments
This work is supported in part by NSF (NIRT: CBET 0507036) and NIH (R01 GM0764401). Lee, Browning, and Nallathamby are grateful for the support of NSF-GRAS (CBET 0541661), NIH-GRAS (R01 GM076440-01S1), and Dominion Scholar Fellowship, respectively.
References
- 1.Browning LM, Lee KJ, Huang T, Nallathamby PD, Lowman J, Xu XHN. Nanoscale. 2009;1:138–152. doi: 10.1039/b9nr00053d. [DOI] [PMC free article] [PubMed] [Google Scholar]
- 2.Lee KJ, Nallathamby PD, Browning LM, Osgood CJ, Xu XHN. ACS Nano. 2007;1:133–143. doi: 10.1021/nn700048y. [DOI] [PMC free article] [PubMed] [Google Scholar]
- 3.Nallathamby PD, Lee KJ, Xu XHN. ACS Nano. 2008;2:1371–1380. doi: 10.1021/nn800048x. [DOI] [PMC free article] [PubMed] [Google Scholar]
- 4.Fischer HC, Chan WC. Curr Opin Biotechnol. 2007;18:565–571. doi: 10.1016/j.copbio.2007.11.008. [DOI] [PubMed] [Google Scholar]
- 5.Khlebtsov N, Dykman L. Chem Soc Rev. 2011;40:1647–1671. doi: 10.1039/c0cs00018c. [DOI] [PubMed] [Google Scholar]
- 6.Peterson RT, Macrae CA. Annu Rev Pharmacol Toxicol. 2012;52:433–453. doi: 10.1146/annurev-pharmtox-010611-134751. [DOI] [PubMed] [Google Scholar]
- 7.Sayes CM, Reed KL, Warheit DB. Toxicol Sci. 2007;97:163–180. doi: 10.1093/toxsci/kfm018. [DOI] [PubMed] [Google Scholar]
- 8.Huang T, Browning LM, Xu XHN. Nanoscale. 2012;4:2797–2812. doi: 10.1039/c2nr11739h. [DOI] [PubMed] [Google Scholar]
- 9.Huang T, Nallathamby PD, Xu XHN. J Am Chem Soc. 2008;130:17095–17105. doi: 10.1021/ja8068853. [DOI] [PMC free article] [PubMed] [Google Scholar]
- 10.Kelly KL, Coronado E, Zhao LL, Schatz GC. J Phys Chem B. 2003;107:668–677. [Google Scholar]
- 11.Kreibig U, Vollmer M. Optical Properties of Metal Clusters. Springer; Berlin: 1995. pp. 14–123. [Google Scholar]
- 12.Mie G. Annu Phys. 1908;25:377–445. [Google Scholar]
- 13.Huang T, Nallathamby PD, Gillet D, Xu XHN. Anal Chem. 2007;79:7708–7718. doi: 10.1021/ac0709706. [DOI] [PMC free article] [PubMed] [Google Scholar]
- 14.Nallathamby PD, Huang T, Xu XHN. Nanoscale. 2010;2:1715–1722. doi: 10.1039/c0nr00303d. [DOI] [PMC free article] [PubMed] [Google Scholar]
- 15.Mulvaney P. Langmuir. 1996;12:788–800. [Google Scholar]
- 16.Huang T, Xu XHN. J Mater Chem. 2010;20:9867–9876. doi: 10.1039/C0JM01990A. [DOI] [PMC free article] [PubMed] [Google Scholar]
- 17.Pastoriza-Santos I, Liz-Marzan LM. J Mat Chem. 2008;18:1724–1737. [Google Scholar]
- 18.Lee KJ, Browning LM, Huang T, Ding F, Nallathamby PD, Xu XHN. Anal Bioanal Chem. 2010;397:3317–3328. doi: 10.1007/s00216-010-3864-8. [DOI] [PMC free article] [PubMed] [Google Scholar]
- 19.Lee KJ, Browning LM, Nallathamby PD, Desai T, Cherukui P, Xu XHN. Chem Res Toxico. 2012;25:1029–1046. doi: 10.1021/tx300021u. [DOI] [PMC free article] [PubMed] [Google Scholar]
- 20.Lee KJ, Nallathamby PD, Browning LM, Desai T, Cherukui P, Xu X-HN. Analyst. 2012;137:2973–2986. doi: 10.1039/c2an35293a. [DOI] [PubMed] [Google Scholar]
- 21.Nallathamby PD, Lee KJ, Desai T, Xu X-HN. Biochemistry. 2010;49:5942–5953. doi: 10.1021/bi100268k. [DOI] [PMC free article] [PubMed] [Google Scholar]
- 22.Xu XHN, Brownlow WJ, Kyriacou SV, Wan Q, Viola JJ. Biochemistry. 2004;43:10400–10413. doi: 10.1021/bi036231a. [DOI] [PubMed] [Google Scholar]
- 23.Xu XHN, Chen J, Jeffers RB, Kyriacou SV. Nano Lett. 2002;2:175–182. [Google Scholar]
- 24.Lee KJ, Browning LM, Nallathamby PD, Xu XHN. Chem Res Toxicol. 2013;26:904–917. doi: 10.1021/tx400087d. [DOI] [PMC free article] [PubMed] [Google Scholar]
- 25.den Hertog J. Biosci Rep. 2005;25:289–297. doi: 10.1007/s10540-005-2891-8. [DOI] [PubMed] [Google Scholar]
- 26.Hill AJ, Teraoka H, Heideman W, Peterson RE. Toxicol Sci. 2005;86:6–19. doi: 10.1093/toxsci/kfi110. [DOI] [PubMed] [Google Scholar]
- 27.Kahn P. Science. 1994;264:904–905. doi: 10.1126/science.8178149. [DOI] [PubMed] [Google Scholar]
- 28.Langheinrich U. Bioessays. 2003;25:904–912. doi: 10.1002/bies.10326. [DOI] [PubMed] [Google Scholar]
- 29.Lieschke GJ, Currie PD. Nat Rev Genet. 2007;8:353–367. doi: 10.1038/nrg2091. [DOI] [PubMed] [Google Scholar]
- 30.Pichler FB, Laurenson S, Williams LC, Dodd A, Copp BR, Love DR. Nat Biotechnol. 2003;21:879–883. doi: 10.1038/nbt852. [DOI] [PubMed] [Google Scholar]
- 31.Ali S, Champagne DL, Spaink HP, Richardson MK. Birth Defects Res C Embryo Today. 2011;93:115–133. doi: 10.1002/bdrc.20206. [DOI] [PubMed] [Google Scholar]
- 32.Howe K, et al. Nature. 2013;496:498–503. doi: 10.1038/nature12111. [DOI] [PMC free article] [PubMed] [Google Scholar]
- 33.Woods IG, Kelly PD, Chu F, Ngo-Hazelett P, Yan YL, Huang H, Postlethwait JH, Talbot WS. Genome Res. 2000;10:1903–1914. doi: 10.1101/gr.10.12.1903. [DOI] [PMC free article] [PubMed] [Google Scholar]
- 34.Woods IG, Wilson C, Friedlander B, Chang P, Reyes DK, Nix R, Kelly PD, Chu F, Postlethwait JH, Talbot WS. Genome Res. 2005;15:1307–1314. doi: 10.1101/gr.4134305. [DOI] [PMC free article] [PubMed] [Google Scholar]
- 35.Browning LM, Huang T, Xu X-HN. Interface Focus. 2013;3:20120098. doi: 10.1098/rsfs.2012.0098. [DOI] [PMC free article] [PubMed] [Google Scholar]
- 36.Bar-Ilan O, Albrecht RM, Fako VE, Furgeson DY. Small. 2009;5:1897–1910. doi: 10.1002/smll.200801716. [DOI] [PubMed] [Google Scholar]
- 37.Shaw BJ, Handy RD. Environ Int. 2011;37:1083–1097. doi: 10.1016/j.envint.2011.03.009. [DOI] [PubMed] [Google Scholar]
- 38.Lin S, Zhao Y, Ji Z, Ear J, Chang CH, Zhang H, Low-Kam C, Yamada K, Meng H, Wang X, Liu R, Pokhrel S, Mädler L, Damoiseaux R, Xia, Godwin HA, Lin S, Nel AE. Small. 2013;9:1775. doi: 10.1002/smll.201202128. [DOI] [PMC free article] [PubMed] [Google Scholar]
- 39.Lee PC, Meisel D. J Phys Chem. 1982;86:3391–3395. [Google Scholar]
- 40.Nallathamby PD, Xu XHN. Nanoscale. 2010;2:942–952. doi: 10.1039/c0nr00080a. [DOI] [PMC free article] [PubMed] [Google Scholar]
- 41.Kyriacou SV, Brownlow WJ, Xu XHN. Biochemistry. 2004;43:140–147. doi: 10.1021/bi0351110. [DOI] [PubMed] [Google Scholar]
- 42.Huang T, Xu XHN. Nanoscale. 2011;3:3567–3572. doi: 10.1039/c1nr10182j. [DOI] [PubMed] [Google Scholar]
- 43.Westerfield M. The zebrafish book: A Guide for the Laboratory Use of Zebrafish (Danio Rerio*) University of Oregon Press; Eugene, OR: 1993. pp. 1–4. ( http://zfin.org/zf_info/zfbook/zfbk.html) [Google Scholar]
- 44.Luckenbilledds L. Amer Zool. 1997;37:213–219. [Google Scholar]
- 45.Strehlow D, Heinrich G, Gilbert W. Development. 1994;120:1791–1798. doi: 10.1242/dev.120.7.1791. [DOI] [PubMed] [Google Scholar]
- 46.Kunz YW. Fish and Fisheries Series. Springer; Netherlands: 2004. pp. 267–428. [Google Scholar]
- 47.Helde KA, Wilson ET, Cretekos CJ, Grunwald DJ. Science. 1994;265:517–520. doi: 10.1126/science.8036493. [DOI] [PubMed] [Google Scholar]
- 48.Stickney HL, Barresi MJF, Devoto SH. Developmental Dynamics. 2000;219:287–303. doi: 10.1002/1097-0177(2000)9999:9999<::AID-DVDY1065>3.0.CO;2-A. [DOI] [PubMed] [Google Scholar]
- 49.Kusumi A, Sako Y. J Cell Biology. 1994;125:1251–1264. doi: 10.1083/jcb.125.6.1251. [DOI] [PMC free article] [PubMed] [Google Scholar]
- 50.Kusumi A, Sako Y, Yamamoto M. Biophys J. 1993;65:2021–2040. doi: 10.1016/S0006-3495(93)81253-0. [DOI] [PMC free article] [PubMed] [Google Scholar]
- 51.Qian H, Sheetz MP, Elson EL. Biophys J. 1991;60:910–921. doi: 10.1016/S0006-3495(91)82125-7. [DOI] [PMC free article] [PubMed] [Google Scholar]
- 52.Tinoco I, Sauer K, Wang J, Puglisi JD. Physical Chemistry-Principles and Applications in Biological Sciences. Prentice Hall; New Jersey: 2002. pp. 274–290. [Google Scholar]
- 53.Browning LM, Lee KJ, Nallathamby PD, Xu X-HN. Chem Res Toxico. 2013 doi: 10.1021/tx400228p. in press. [DOI] [PMC free article] [PubMed] [Google Scholar]
- 54.Kimmel CB, Miller CT, Moens CB. Developmental Biology. 1995;203:253–310. [Google Scholar]
- 55.Fujii R, Yamashita S, Hibi M, Hirano T. J Cell Biol. 2000;150:1335–1348. doi: 10.1083/jcb.150.6.1335. [DOI] [PMC free article] [PubMed] [Google Scholar]
- 56.Hashimoto H, Itoh M, Yamanaka Y, Yamashita S, Shimizu T, Solnica-Krezel L, Hibi M, Hirano T. Dev Biol. 2000;217:138–152. doi: 10.1006/dbio.1999.9537. [DOI] [PubMed] [Google Scholar]
- 57.Giudicelli F, Ozbudak EM, Wright GJ, Lewis J. PLoS Biol. 2007;5:e150. doi: 10.1371/journal.pbio.0050150. [DOI] [PMC free article] [PubMed] [Google Scholar]
Associated Data
This section collects any data citations, data availability statements, or supplementary materials included in this article.
Supplementary Materials
Summary of normal and deformed zebrafish developed from given-stage embryos treated with the Ag NPs