

Abstract
Organisms can often adapt surprisingly quickly to evolutionary challenges, such as the application of pesticides or antibiotics, suggesting an abundant supply of adaptive genetic variation. In these situations, adaptation should commonly produce “soft” selective sweeps, where multiple adaptive alleles sweep through the population at the same time, either because the alleles were already present as standing genetic variation or arose independently by recurrent de novo mutations. Most well-known examples of rapid molecular adaptation indeed show signatures of such soft selective sweeps. Here we review our current understanding of the mechanisms that produce soft sweeps and the approaches used for their identification in population genomic data. We argue that soft sweeps might be the dominant mode of adaptation in many species.
Hard and soft selective sweeps
Rapid adaptation has long been associated primarily with situations where selection is acting on quantitative traits that are highly polygenic, for example during breeding experiments. Such traits can respond quickly to changing selective pressures via small adjustments in the population frequencies of a large number of already present polymorphisms [1]. Under this, so-called, infinitesimal model [2], adaptation is expected to leave very subtle signatures in population genomic data since the underlying polymorphisms may have existed long enough in the population to become unlinked from their surrounding genetic variation.
However, recent studies show that rapid adaptation can often involve only few alleles of large individual effect that were previously rare or even absent in the population. Prominent examples include the evolution of pesticide resistance in insects [3], color patterns in beach mice [4], freshwater adaptation in sticklebacks [5], and lactose persistence in humans [6]. Our standard model for describing the population genetics of adaptation in these cases is the so-called selective sweep [7,8]. In contrast to the infinitesimal model, in a selective sweep the adaptive alleles were previously rare, are still in linkage disequilibrium (LD) with surrounding genetic variation, and change their population frequencies substantially due to positive selection.
Selective sweeps can be “hard”, where a single adaptive allele sweeps through the population, or “soft”, where multiple adaptive alleles at the same locus sweep through the population at the same time [9]. By definition, whether a sweep is hard or soft in a given population sample is determined by the genealogy of adaptive alleles at the selected site: In a hard sweep, the lineages in the sample that carry the adaptive allele coalesce more recently than the onset of positive selection, that is, the point in time when it first became advantageous to carry the allele (Figure 1A). In a soft sweep, on the other hand, they coalesce prior to the onset of positive selection. Sweeps in which several adaptive mutations of independent origin are present in a sample should thus be soft in most cases, regardless of whether the mutations arose de novo after the onset of positive selection (Figure 1B) or were already present previously as standing genetic variation (Figure 1C, top row). Yet also a situation where the adaptive allele arose only once but reached some frequency prior to the onset of positive selection, and several copies then swept through the population, is still considered a soft sweep if the lineages coalesce prior to the onset of positive selection (Figure 1C, bottom row).
Figure 1.

Definition of hard and soft sweeps. (A) In a hard sweep, all adaptive alleles in the sample arise from a single mutation (depicted by x) and coalesce after the onset of positive selection (dotted line). Note that even if the mutation had arisen prior to the onset of positive selection and was present as standing genetic variation, this would still be considered a hard sweep as long as only a single lineage is ultimately present in the sample. (B) In a soft sweep from recurrent de novo mutations, the adaptive alleles in the sample arose from at least two independent mutation events after the onset of positive selection and the lineages coalescence prior to the onset of positive selection. (C) In a soft sweep from the standing genetic variation, adaptive alleles were already present at the onset of positive selection. The different lineages in a population sample can originate from independent mutation events (i) or from a single mutation that reached some frequency prior to the onset of positive selection, such that several copies present at that time then swept through the population (ii). In this latter case, the population genetic signatures of the sweep will depend on the time τ between coalescence and onset of positive selection. If τ is short, the sweep will appear similar to a hard sweep, whereas when τ is large, it will be similar to a soft sweep from several de novo mutations.
Note that the above definition of hard and soft sweeps is based on a population sample. It is thus possible that the same adaptive event can yield a soft sweep in one sample but remain hard in another, depending on which alleles were sampled. For instance, if one had chosen only the six blue individuals from Figure 1B, the sweep in this subsample would have been hard. We also want to emphasize that the notion of a selective sweep we adopt in this review refers solely to the population dynamics of adaptive alleles at the particular locus and the resulting signatures in population genomic data. This definition does not consider the actual molecular nature of the involved mutations, which may often be unknown. One consequence of this definition is that, in principle, the different adaptive mutations that contribute to a sweep at a given locus do not necessarily have to result from the same selective pressures. We will explain this in more detail below when we discuss the definition of the relevant genetic locus for a selective sweep.
Whether adaptation produces hard or soft sweeps depends primarily on the availability of adaptive mutations [9, 10]. Hard sweeps are expected when adaptive alleles are not present in the population at the onset of selective pressure and when the waiting time for adaptive mutations is long. In contrast, soft sweeps are expected when the waiting time until an adaptive mutation arises is shorter than the time it takes for this mutation to spread through the population. This is the case (i) in very large populations, (ii) when adaptation has a large mutational target (for example, when every loss-of-function mutation in a gene is adaptive) [11], or (iii) when adaptation utilizes alleles present as standing genetic variation, either in mutation-selection-drift balance or maintained by balancing selection [12,13]. Soft sweeps are also possible as a result of parallel adaptation in geographically structured populations when several mutations emerge independently in distant locations before one has spread over the entire range [14–17]. In this case, “local” samples from a subpopulation might always yield hard sweeps, whereas “global” samples across subpopulations can yield soft sweeps.
In a hard selective sweep, all lineages collapse into a single cluster, generating characteristic signatures in population genomic data such as a reduction in genetic diversity around the adaptive site [7, 8, 18], an excess of high frequency derived alleles and singletons [19–22], and the presence of a single, long haplotype [23]. These hallmark signatures underlie most commonly used approaches for identifying sweeps [18, 19, 24–31]. In a soft sweep, on the other hand, lineages collapse into more than one cluster and several haplotypes can be frequent in the population at the adaptive locus. Diversity is thus not necessarily reduced and deviations in the frequency distributions of neighboring neutral polymorphisms are typically very weak compared to hard sweeps [13, 32–34]. As a result, it is difficult to identify soft sweeps from polymorphism summary statistics such as Tajima’s D [25], Fay and Wu’s H [19], and the CLR test [35].
Scans for positive selection in population genomic data have typically focused on identifying hard sweeps and have only very limited power for soft sweeps [13,32,33]. Hence, if soft sweeps are pervasive, then most of them should have evaded detection and we might be missing an entire class of important adaptive events.
Signatures and examples of soft sweeps
There is mounting evidence, both from individual case studies and genome-wide scans, that soft sweeps are indeed common in a broad range of organisms, from viruses to insects and even mammals. Below we briefly review this evidence and discuss the diversity of approaches used to identify soft sweeps in molecular population genetic data.
Soft sweeps are abundant in case-studies of adaptation
In some cases, it is possible to detect soft sweeps directly through the presence of adaptive mutations of independent origin. Figure 2A shows an example from the evolution of resistance to HIV treatment that involves a single amino acid change of the viral reverse transcriptase [36]. Pennings et al. [37] analyzed viral samples obtained from the same patient before and after resistance had evolved. Prior to treatment, all viral samples were monomorphic for the lysine codon AAA at the resistance locus. After resistance had evolved, two different synonymous codons (AAT and AAC), both encoding for asparagine, were frequent in the sample. This is a clear example of a soft sweep that could have originated either because both alleles were already present at the onset of treatment or from independent de novo mutations afterwards.
Figure 2.

Soft sweep examples in population genomic data. (a) Haplotypes of the HIV reverse transcriptase observed in two samples taken from the same patient prior to treatment (day 0; samples S1–S7) and after resistance had evolved (day 28; samples S8–S14) from [37]. Treatment resistance involves a single amino acid change from lysine to asparagine in the codon spanning positions 307–309 (grey columns). The original AAA codon was replaced by a mixture of AAC and AAT codons that both encode for asparagine. (b) Soft sweep in humans in the lactase gene from [38]. The top panel shows homozygosity tracts in African individuals that carry the persistent C-14010 allele (red) versus those that carry the non-persistent G-14010 allele (blue). The bottom panel shows tracts for Eurasian individuals that cary the persistent T-13910 allele (green) versus those that carry the non-persistent C-13910 allele (orange). (c) Soft sweep during the evolution of pesticide resistance in D. melanogaster from [41]. The table shows the observed haplotypes in a region of the Ace gene from flies sampled in North America and Australia. D. melanogaster evolved in Africa and then spread worldwide via Europe (lower panel). The A to G mutation at position 14870 of Ace increases resistance to several commonly used pesticides. NA1 and NA2 are commonly observed sensitive haplotypes in North America and samples S1–S9 show the haplotypes of nine resistant flies collected in North America. AUS is a commonly observed sensitive haplotype in Australia and sequences S10–S16 show the haplotypes of seven resistant flies collected in Australia. In both locations, resistance seems to have evolved on the locally prevailing sensitive haplotypes. (d) Haplotype homozygosity statistics. The top row depicts a hard sweep with a single common haplotype and several low-frequency variants; the bottom row depicts a soft sweep with two common haplotypes. The total grey area in the left panel specifies haplotype homozygosity . The middle panel shows extended haplotype homozygosity H12, obtained after combining the frequencies of the two most common haplotypes. The right panel shows haplotype homozygosity calculated after removing the most frequent haplotype. H1 is larger (and H2 smaller) for the hard sweep than for the soft sweep. H12 is similar in both scenarios. (e) H12 scan for chromosomes 2R and 3R of D. melanogaster from [64]. The three most prominent peaks coincide with three well-known cases of adaptation at the loci Cyp6g1, Ace, and CHKov1.
In a geographically structured population, sweeps that are hard in local samples can become soft in global samples that comprise individuals from geographically distant locations. This signature can then be used to infer cases of parallel adaptation [15,17]. The classic example for this scenario is lactase persistence in humans that evolved in parallel in Eurasia and Africa through independent mutations in the lactase gene [6, 38, 39]. Figure 2B shows the length of homozygosity tracts flanking lactase persistence-associated SNPs in Eurasia and Africa from [38]. Within each region, lactase persistent individuals show extensive haplotype homozygosity, sometimes extending over more than 2 Mb, whereas haplotype homozygosity in non-persistent haplotypes is not elevated, suggesting hard sweeps in both regions with some ancestral variation remaining. However, the persistent haplotypes in the two regions are highly divergent from each other, indicating independent origins of the adaptive mutations and a global soft sweep on the scale of the entire population [38].
Another clear example of parallel adaptation is the evolution of pesticide resistance in D. melanogaster through mutations in the gene Ace, which encodes Acetylcholinesterase, a major target of commonly used pesticides [40]. Karasov et al. [41] found that the same adaptive mutation, a mutation from A to G at position 14870, resides on distinct haplotypes depending on the geographic locations from which the flies were sampled (Figure 2C). Specifically, in flies from North America, the resistance mutation is located on a haplotypic background that is also common among the sensitive flies in North America, whereas in flies from Australia, the resistance mutation resides on a background that is common among sensitive flies in Australia, but rare in North America. It thus appears that the resistance mutation arose independently on the haplotypic backgrounds that are common on each continent. Moreover, multiple resistant haplotypes at Ace are present within continents as well, including haplotypes with resistant mutations at two other sites within the gene [41]. The evolution of pesticide resistance at Ace provides a clear example of soft sweeps being associated with rapid, multi-step adaptation under strong selection, given that organophosphate pesticides have only been used since the 1950’s.
Soft sweeps have recently been observed in various other case-studies of adaptation. For example, in Malaria parasites, multiple de novo amplification events of the pfmdr1 gene confer resistance to mefloquine [42], while multiple independent mutations in the genes dhfr and dhps confer resistance to sulfadoxine-pyrimethamine [43]. Several studies have observed soft sweeps during the evolution of drug resistance in HIV [44, 45]. Fungicide resistance of the plant pathogen Plasmopara viticola arose via four independent de novo mutations in the gene cytochrome b [46]. The evolution of resistance to benzimidazole in Teladorsagia circumcincta, a parasitic nematode of sheep, displays signatures of soft sweeps due to multiple independent mutations in the β-tubulin gene [47]. The three best understood cases of recent adaptation in D. melanogaster all produced soft sweeps: viral and organophosphate resistance at the CHKov1 locus evolved from standing variation [48, 49], whereas pesticide resistance at the Ace locus (as discussed above) as well as DDT resistance at the Cyp6g1 locus, evolved via multiple independent de novo mutations [3, 41, 50, 51]. In D. santomea, soft sweeps have been observed from multiple de novo loss-of-function mutations in the gene tan [52]. In the mosquito Culex pipiens, multiple independent duplications of the ace-1 locus provide insecticide resistance [53]. The parallel evolution of the fresh-water-specific reduction of armor plates in sticklebacks produced soft sweeps [5,54,55], as did adaptation at the Mc1r locus in mice [4,56]. A clear example of a soft sweep in the brown rat are the several different allelic variants of the gene VKORC1 that rapidly evolved in response to the rodenticide warfarin [57,58]. Additional prominent examples in humans are the different variants of the sickle cell allele in β-globin [59,60], the several mutations in the gene G6PD that evolved independently in response to malaria [61], and adaptation from standing genetic variation in the genes ASPM and PSCA [62].
Soft sweeps are abundant in systematic genomewide scans for adaptation
Even though soft sweeps are expected to leave more subtle signatures in population genomic data than hard sweeps, it is still possible to distinguish them from patterns expected under neutral evolution. Depending on the degree of the “softness” of the sweep, that is, the number of independently originated adaptive alleles in the sweep, only a few haplotypes may be frequent in a population sample. The two illustrations of soft sweeps in Figure 1, for instance, only have two components each (red and blue). Within each component, the coalescent resembles that of a hard sweep. As a result, LD is still much higher than under neutrality [33, 63], and methods that detect perturbations in the haplotype structure, such as iHS [27, 30] and XP-EHH [31], should therefore retain some power to systematically detect soft sweeps in population genomic data as long as sweeps were not too soft [33].
Messer and Neher [45] showed that it is indeed possible to detect soft sweeps from haplotype data. Their approach is based on the observation that in a hard sweep, and thus within each component of a soft sweep, the new variants of the adaptive haplotype that arise from mutation or recombination events during the sweep should be at low population frequencies (Box 1). In addition, these variants should typically differ from the original haplotype by only a single mutation or recombination event. Two adaptive haplotypes from distinct components of a soft sweep, however, can both be frequent and should also be more diverged from each other.
Box 1. Hard sweeps just looking soft?
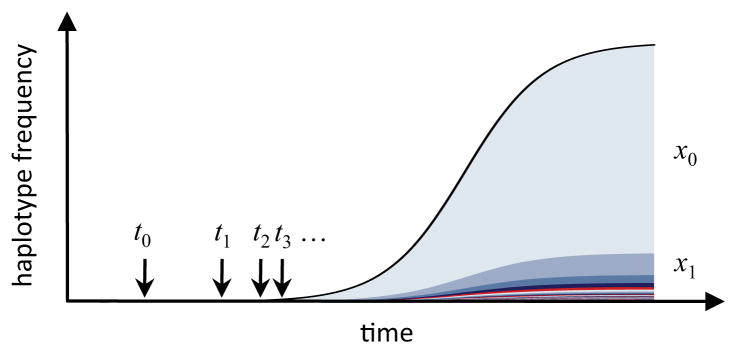
How can one decide whether a sweep with several frequent haplotypes is truly a soft sweep, rather than just a hard sweep where recombination or mutation during the sweep has broken up the original haplotype into different variants? Assume that at timet0 an adaptive mutation establishes. Early during its sweep, mutation or recombination events on the sweeping haplotype can create new variants that also increase in frequency. Their expected frequencies, x1, x2, ···, are determined by their seeding times, t1, t2, ···, which gives rise to a characteristic frequency spectrum of haplotype variants in a hard sweep, as illustrated below:
Figure Box 1.
Messer and Neher [45] used branching process calculations to show that for a hard sweep with selection coefficient s the expected ratio between the frequency xi of variant i and the frequency x0 of the original haplotype is
| (5) |
where u is the combined rate of mutation and recombination estimated over the whole locus. The approximation assumes that u ≪ s. Frequency distributions of haplotype variants in hard sweeps are thus described by a simple power-law: the most abundant adaptive haplotype, on average, is s/u times more frequent than the first variant, 2s/u times more frequent than the second variant, and so forth. For example, when recombination and mutation rate are both 10−8 per site per generation, then u= 2 × 10⁻⁴ for a locus of length 10 kb. In a hard sweep with s= 0.01, we then expect the original haplotype to be ≈50 times more frequent than its first variant.
Hence, even though the variance in x1/x0 can be quite large, the new variants in a hard sweep will, on average, be at low frequencies as long as loci are not too large [21, 45]. In a soft sweep, on the other hand, the frequencies of the most common and second most common haplotype can be similar, and x1/x0 therefore much larger.
Garud et al. [64] proposed a related approach to systematically detect both hard and soft sweeps in population genomic data and to distinguish them from each other. They developed a test statistic (H12) that estimates haplotype homozygosity after combining the frequencies of the two most frequent haplotypes in a given genomic region (Figure 2D). A soft sweep with two frequent components is thus treated effectively as a hard sweep with one big component. H12 has high power to detect cases of recent and strong adaptation and, importantly, has similar sensitivity for both hard and soft sweeps, as long as the latter are not too soft and still comprise only a few frequent components. A genome-wide H12 scan in 192 sequenced D. melanogaster strains from North Carolina [65] revealed abundant signatures of recent adaptation with haplotype structure often extending over hundreds of kilobases (Figure 2E).
Garud et al. [64] also developed a second statistic (H2/H1) that compares haplotype homozygosities with and without the most common haplotype (Figure 2D). High values of this statistic are expected only for soft sweeps. When they applied this test to the 50 most prominent peaks in their H12 scan, all showed signatures of soft sweeps.
Likelihood of soft sweeps
The many examples reviewed above show that soft sweeps are common in a range of organisms. What are the circumstances under which this should be the case? In principle, soft sweeps can arise from recurrent de novo adaptive mutations, adaptation from the standing genetic variation, and parallel adaptation in geographically structured populations. In the following we discuss the key evolutionary parameters that determine the probabilities of soft and hard sweeps in each of these scenarios:
Recurrent de novo mutations
Consider a haploid population of size N in a Wright-Fisher model (constant population size, random mating, discrete generations). Assume that a mutant allele confers a fitness advantage s > 0 over the wildtype and arises at rate μ per individual per generation at the locus of interest. We define Θ = 2Nμ as twice the average number of new mutants that enter the population per generation. Since only an approximate fraction 2s of new mutations will escape stochastic loss and successfully establish in the population [66], the rate of successfully establishing mutations is 2Nμs ≈ Θs. The average waiting time for a successfully establishing mutation is thus Te ≈ 1/(Θs). Once established, a mutant lineage grows roughly logistically, requiring Tf ≈ (1/s) ln (Ns) generations until fixation (assuming that there is no interference with other mutations) [7].
By comparing the timescales of establishment and fixation we can estimate whether adaptation should primarily proceed from a single de novo adaptive mutation or involve multiple recurrent de novo mutations (Figure 3A): Multiple origins should prevail whenever adaptive mutations enter the population frequently enough such that a second independent mutation can establish in the population before the first one has reached fixation, and thus when Te < Tf, yielding:
| (1) |
Figure 3.

Likelihood of hard and soft sweeps and relevant timescales. (A) The red curve shows the frequency trajectory of an adaptive mutation. The blue curve shows the trajectory of another de novo adaptive mutation that successfully established before the first one became fixed in the population. This scenario is likely when establishment time Te is shorter than fixation time Tf. (B) Adaptation in a subdivided population with two demes and migration. An adaptive mutation arises and sweeps through the first deme (red trajectory). The allele can subsequently migrate and also sweep in the second deme (dashed red trajectory), resulting in a global hard sweep. Alternatively, an independent de novo adaptive mutation can arise first and sweep in the second deme (dashed blue trajectory), resulting in a global soft sweep. (C) Adaptation in a spatially continuous population with limited dispersal. An adaptive mutation arises at one geographic location (red area) and then spreads through the population in a radial wave with speed ν (red circles). While this mutation is still spreading, another de novo adaptive mutation arises at a different location that has not yet been covered by the first mutation (blue area). The characteristic length χ specifies the average distance traveled by an adaptive mutation until another successful mutation is expected to have arise within its already covered area.
This simple timescale argument already provides a key insight: Whether adaptation is more likely to involve a single or multiple de novo mutations depends primarily on Θ, the rate at which adaptive mutations enter the population, whereas it depends only logarithmically on the strength of selection, because establishment and fixation time both scale inversely with s. Note that scenarios where Θ ≥ 1 should generally involve multiple de novo mutations unless positive selection is extremely weak.
Adaptation by multiple de novo mutations does not automatically produce soft sweeps in a finite population sample since one of the mutations might be at a particularly high population frequency and thus the only mutation present in the sample. Pennings and Hermisson [11] used coalescent theory to approximate the probability of observing multiple adaptive de novo mutations of independent origin in a random population sample of size n. To leading order, they obtained: . Thus, even in small samples adaptation should primarily lead to soft sweeps whenever Θ ≥ 1. For example, when Θ = 1, we expect soft sweeps in samples of size n = 10 in 90% of the cases and for Θ = 0.1 we still expect soft sweeps in 25% of the cases.
Adaptation from standing genetic variation
In sufficiently large populations, neutral and even deleterious mutations are present most of the time under mutation-selection-drift balance. When such mutations suddenly become advantageous, adaptation can proceed from alleles that are already present as standing genetic variation. We can estimate the probability of a selective sweep from standing genetic variation by integrating , where ρ(x) is the probability density that the mutation previously segregated at frequency x in the population, and Π(x) is the probability that a mutation with selection coefficient s, which is present at frequency x, eventually fixes in the population. For a previously neutral mutation under mutation-drift balance, this yields Psgv ≈ 1 − exp [−Θ ln(2Ns)] [9]. A selective sweep from a preexisisting neutral mutation is thus likely when-ever Θ > 1/ln(2Ns), which is essentially the same condition we obtained for adaptation involving recurrent de novo mutations in Equation (1). Note that Psgv is only marginally lower than the probability that the mutation is segregating in the population at all, Θ ln(N) for a neutral mutation [67].
For a mutation that was previously deleterious, Psgv will always be smaller than for the neutral case since deleterious mutations, on average, segregate at lower frequencies and are present in the population less of the time than neutral mutations. Specifically, if the mutation was previously deleterious with selection coefficient s′, one obtains Psgv ≈ 1 − exp[−Θ ln(1 + Rα)], where Rα = 2Ns/(2Ns′ + 1) is the relative selective advantage of the mutation [9]. In this case, adaptation from the standing genetic variation is likely only when Θ > 1/ln(1 + Rα).
The results from this and the previous section demonstrate that in a panmictic population selective sweeps involving previously neutral or deleterious standing genetic variation, as well as multiple de novo adaptive mutations, should be unlikely when Θ ≪ 1 and most selective sweeps should therefore be hard in this regime. When Θ ≥ 1, however, soft sweeps become common. In this regime, adaptive mutations are present in the population most of the time and the distinction between adaptation from standing genetic variation and recurrent de novo mutation becomes blurred.
It is also possible that adaptation commonly involves alleles from the standing genetic variation that are maintained by some form of balancing selection, for instance frequency dependent selection, heterozygote advantage, or selection that varies systematically across time or space. If adaptation proceeds from such alleles, then its signatures will depend primarily on the number of initially present alleles at the locus that ultimately contribute to adaptation and their ages (Figure 1C): Balanced alleles that have existed in the population for a long time will be present on diverse haplotypic backgrounds and may no longer be in LD with surrounding genetic diversity. When adaptation involves such alleles, it may only be visible in longitudinal data of polymorphism frequencies over time [68–71]. However, if the balanced alleles are still young and only present on very few haplotypes, as has been proposed for adaptive walks in diploids [72], we can still expect to observe soft sweep signatures.
Parallel adaptation in structured populations
In a panmictic population, the speed at which an adaptive mutation spreads through the population is primarily determined by the strength of positive selection. In a spatially structured population, however, the spread of the adaptive mutation can be impeded by the time it takes until individuals with the mutation migrate into distant areas of the population. If this takes much longer than the establishment time of a new adaptive mutation in the population as a whole, then another adaptive mutation of independent origin can arise elsewhere in the population before the first adaptive mutation has covered the entire range. An example of such a scenario is the parallel evolution of lactase persistence in humans in Eurasia and Africa [6,38,39].
We can estimate the conditions under which parallel adaptation should be likely in structured populations by comparing the timescales of establishment and fixation. Here, the fixation time specifies the expected waiting time until an established adaptive mutation has covered the entire range of the population.
Let us first consider a simple scenario of a subdivided population with two panmictic demes consisting of N individuals each with migration rate m between them (Figure 3B). We further assume Θ ≪ 1 within each deme, otherwise we already know that soft sweeps should be common even within demes, and thus certainly in global samples comprising individuals across demes. In this regime, an adaptive mutation that establishes in the first deme will locally sweep to fixation in a much shorter time than the waiting time Te = 1/(Θs) until an independent adaptive mutation is expected to establish in the second deme.
Migrants carrying the adaptive mutation from the first deme will establish in the second deme at an approximate rate 2s × Nm, and the waiting time for this to happen is therefore Tm ≈ 1/(2Nms). Parallel adaptation capable of producing soft sweeps in global samples should be likely when Tm > Te, and hence when
| (2) |
Migration thus has to be extremely weak, i.e., lower than the mutation rate. Consider, for instance, a scenario with Θ = 0.01, assuring that soft sweeps are not expected within demes. For parallel adaptation to become likely, migration would then need to be weaker than 2Nm = 0.01. This means that, on average, only one individual would migrate between demes per 100 generations, corresponding essentially to two non-interbreeding populations.
The above model considered only two discrete demes. Ralph and Coop [16] investigated the other extreme case, that of a spatially continuous populations in which adaptive mutations arise locally and then spread through the population in a wavelike manner (Figure 3C). We can once again assess the conditions under which parallel adaptation becomes likely in this model from a simple comparison of timescales: Consider an idealized population with N individuals distributed evenly over a circular area of radius r. An adaptive mutation establishes at some location and then spreads in a radially expanding wave with constant speed ν. The average time until this mutation covers the entire area is on the order of Tm ≈ r/ν. Parallel adaptation should then be likely if again Tm > Te, or equivalently
| (3) |
As expected, in a spatial population of constant size N the likelihood of parallel adaptation increases with the range r of the population and decreases with the speed ν at which an adaptive mutation spreads. In the classical Fisher-KPP model for traveling waves [73, 74], this speed is given by , where σ is the average dispersal distance of an individual per generation [75]. The probability of soft sweeps thus depends on the square-root of the selection coefficient in this model.
Ralph and Coop [16] extended this approach to populations in arbitrary dimensional spaces by defining a characteristic length χ = (ν/λω(d))1/(d+1), where ω(d) is the area of a sphere of radius one in d dimensions and λ is the intensity per unit area per generation at which adaptive mutations establish in the population. This characteristic length can be interpreted as the average distance travelled by an unobstructed wave until another successful mutation is expected to have arisen within its already covered area (Figure 3C). Consequently, parallel adaptation will be likely if the maximum species range r is larger than χ, whereas hard sweeps should dominate otherwise. In two dimensions, ω(2) = π and λ = Θs/(πr2), which recovers the condition from Equation (3).
Using estimates for human population density and dispersal rates, Ralph and Coop [16] showed that parallel adaptation could be likely over ranges like Eurasia once the mutational target size is sufficiently large, for example 1000 bp, roughly the number of coding bases in a human gene.
Note that in the above scenarios we only considered situations in which selection acts homogeneously in space. If selection is highly heterogeneous in a patchy environment, migration of the selected allele could be substantially slower than that of unlinked neutral variation. Consider, for example, the evolution of pesticide resistance: If the resistant mutation is strongly deleterious in the absence of pesticides, then the migration of a resistant allele from one patch to another could be very slow, as long as it requires survival and reproduction in the habitats where the resistant allele is very deleterious.
Understanding Θ = 2Nμ
The theoretical arguments we presented above demonstrate that the key parameter determining the likelihood of soft sweeps is the rate at which adaptive mutations enter the population at a locus. In the Wright-Fisher model, this is given by Θ = 2Nμ, twice the product of population size and the mutation rate towards the adaptive alleles at the locus of interest. This raises two questions: What is a relevant locus and what is the relevant population size in a realistic population?
Definition of a locus
The definition of the relevant genetic locus for a selective sweep is somewhat vague and can range from a single nucleotide to the whole genome in the case of asexual organisms without recombination (although in this latter situation soft sweeps are usually interpreted under the notion of “clonal interference” [2,76,77]).
In sexual organisms, a selective sweep generates an effectively linked region around the sweeping mutation. The characteristic size of this region is roughly s/[r ln (Ns)], and thus increases with the strength of positive selection and decreases with the recombination rate [8]. Consider the example of lactase persistence, where positive selection was apparently so strong that a genomic segment on the scale of one Mb in length has swept through the population without being broken up by recombination during the sweep. In this situation, a second adaptive mutation, even when located hundreds of kb away from the first adaptive mutation, could still have led to the observation of a soft sweep at this locus. Note that this second mutation could even have resulted from adaptation to an entirely unrelated selective pressure, although this should only be common when the rate of sweeps is so high that multiple unrelated sweeps can overlap in time and genomic location. Even in Drosophila, where sweeps are extremely frequent, we still do not expect this to be common [78].
As a consequence of linkage, stronger positive selection leads to longer loci relevant for selective sweeps. And such longer loci should typically have higher mutation rates towards adaptive alleles, increasing the likelihood of soft sweeps. This brings to light an important difference between the one locus Wright-Fisher model and a sexual population with recombination: In the Wright-Fisher model, the likelihood of soft sweeps does not strongly depend on the strength of selection. In a sexual population, however, the stronger the positive selection during adaptation, the more likely it should produce soft sweeps.
Note that the relationship between strength of selection and likelihood of soft sweeps can be much more complex for such loci than under the simple Wright-Fisher model. A longer locus has a larger mutational target size and thus potentially a higher rate at which adaptive mutations can occur. However, not all such mutations will necessarily have the same selection coefficients. In addition, we ignore the linkage of adaptive alleles to other fitness-affecting alleles elsewhere in the genome [79]. The analytical arguments from the Wright-Fisher model thus no longer hold and understanding of soft sweeps in such realistic situations remains an open topic of investigation.
Population size
The departure from a Wright-Fisher model with constant population size also has profound implications on the other parameter that enters our definition of Θ = 2Nμ: the population size. One can relax many assumptions of the Wright-Fisher model by simply exchanging N with the variance effective population size Ne = p(1 − p)/Vδp, where Vδp is the expected variance in population frequency per generation of a neutral allele at frequency p due to drift [80]. However, the strength of drift can vary across time when population size changes, for example during a population bottleneck. Which value of variance Ne is then to be used for estimating the likelihood of soft sweeps in a species?
The answer lies again in the timescales relevant for adaptation. The values of Θ relevant for adaptation are those during the period when the adaptive mutation establishes in the population. Say we were interested in recent adaptation in a non-Africa human population during the last 500 generations, then only the values of Θ over this time matter. Demographic events that occurred in the more distant past, such as severe bottlenecks occurring during the spread of humans around the globe more than 10 kya [81,82], are not relevant for recent adaptation, even though they could still have profound effects on patterns of neutral variation.
In some species, population size can fluctuate on timescales that are actually shorter than the time it takes for an adaptive mutation to sweep through the population. In D. melanogaster, for instance, population sizes fluctuate by many orders of magnitude between summer and winter [83], and such seasonally-driven boom-bust cycles are likely to be the case for many other insects too. To understand the parameters that determine the likelihood of soft sweeps in such cases, let us consider a highly idealized model of a population of size N1 that undergoes recurrent severe bottlenecks every ΔT generations, during which its size instantaneously plummets to N2 ≪ N1 (Figure 4A). An adaptive mutation is only likely to survive the next bottleneck if it manages to reach a frequency x = 1/N2 before the next bottleneck occurs so that, on average, at least one copy of the allele is present during the bottleneck. After establishment in the large population, this will take approximately Tx = (1/s) ln(sN1/N2) generations of exponential growth. Soft sweeps that emerge during the boom phase are then likely to remain soft throughout the bottleneck only if the second most frequent component of the sweep also had enough time to reach frequency x = 1/N2. This requires that the time between successive bottlenecks, ΔT, is larger than Test + Tx, yielding
Figure 4.

Soft sweeps and demography. (A) Probability of soft sweeps under recurrent population bottlenecks. Every ΔT generations the population size drops from N1 to N2 ≪ N1. During the boom phase, Θ1 > 1, but Θ2 ≪ 1 during the bottleneck. Soft sweeps that emerge during a boom phase remain soft throughout the next bottleneck only if at least two mutations reached a frequency x = 1/N2 such that they are likely to survive this bottleneck. (B) Difference in variance and coalescence Ne in the presence of a population bottleneck. The timescale of neutral coalescence (Tc) is primarily determined by the time since the bottleneck. The value of coalescence Ne inferred from the levels of neutral variation can thus be much smaller than the value of the present-day variance Ne, estimated over the much shorter timescale (Ta) relevant for recent adaptation.
| (4) |
Intriguingly, the departure from the simple constant size scenario once again introduces a strong dependence of the likelihood of soft sweeps on the strength of selection. In particular, when population size plummets recurrently on a timescale ΔT, soft sweeps should be the norm for strong mutations with s > 1/(ΘΔT), while weaker mutations with s ≪ 1/(ΘΔT) should primarily produce hard sweeps.
Thus, other things being equal, the stronger the selection the more common soft sweeps should be, both because the relevant locus becomes effectively larger, increasing the mutation rate toward adaptive alleles, and also because adaptation that starts during a boom phase in a population has time to run its course before the next bust.
Soft sweeps may be the dominant mode of rapid adaptation in many species
Contemporary evolutionary biology is afficted by an odd dichotomy: Experimental evidence suggests that adaptation via selective sweeps is often rapid, involving multiple adaptive mutations that rise in parallel at the same locus, yet population genetic models typically assume mutation-limited scenarios and hard selective sweeps. We argue that this discrepancy reflects the confusion of two different definitions of the effective population size and that adaptation is actually not limited by mutation in many species.
As we have discussed above, the key parameter determining whether adaptation is mutation-limited is Θ= 2Neμ, twice the product of mutation rate towards the adaptive allele at the relevant locus and the variance effective population size estimated over the timescale relevant for adaptation. Mutation-limitation, and consequently hard sweeps, correspond to scenarios where Θ ≪ 1, whereas when Θ is on the order of one or larger, adaptation is not limited by mutation and sweeps become soft. This holds true regardless of whether adaptation involves recurrent de novo mutations or multiple alleles from the standing genetic variation.
Since variance Ne is generally difficult to measure over the short timescales relevant for adaptation, one often uses other estimates of Ne based on the relation between the expected level of neutral diversity and expected pairwise coalescence times [84,85]. When population sizes fluctuate fast compared to the timescale of pairwise coalescence, diversity at neutral sites can be used to estimate the harmonic mean of variance Ne over the (generally long) time period until coalescence [86,87]. Importantly, this harmonic mean is dominated by phases where variance Ne is small, even if those phases were short and happened long ago (Figure 4B). In species with large census sizes, this “diversity” Ne can thus be determined primarily by ancient and rare bottlenecks, recurrent selective sweeps, and background selection, even though variance Ne has been large most of the time [10,41,88].
However, whether adaptation is generally mutation-limited in the evolution of a species does not depend on the harmonic mean of variance Ne estimated over long timescales. Adaptation, especially when driven by strong selection, happens fast and adaptive mutations are more likely to arise when the population size is large. The dynamics of adaptation should therefore be determined by how large variance Ne has been during its evolutionary history on average, which is described by the arithmetic mean. The arithmetic mean of variance Ne will always be larger than the harmonic mean and closer to census population sizes.
This difference can explain the observation that soft sweeps are ubiquitous even in species where Ne values inferred from the levels of neutral diversity are low. If the average variance Ne is on the order of the inverse of the mutation rate in these species, then adaptation is not actually limited by mutation at single sites. Given that many organisms have mutation rates per site between 10−8 and 10−10 [89], the relevant average variance Ne for adaptation needs to be on the order of 108 to 1010 for soft sweeps to dominate in these species. This lower bound is in fact conservative as it assumes that all adaptation happens by mutations at a single site in a locus. Larger mutational targets would make soft sweeps more likely and bounds on average variance Ne less stringent. Such values are entirely reasonable for species with large census sizes, especially given that soft sweeps are still common when Θ ≈ 0.1 [11] and average variance Ne thus ten times smaller.
If variance effective population sizes are indeed often this large, then soft sweeps should be the dominant mode of adaptation much of the time. Hard sweeps, on the other hand, should only be common (i) in consistently small populations, (ii) when adaptation is driven by weak selection in populations of sharply fluctuating size, or (iii) when the mutation rate towards the adaptive allele is extremely low, such as when only a specific combination of mutations is adaptive while individual mutations are not [90,91].
The possible prevalence of soft selective sweeps puts pressure on the field of population genetics to develop a more sophisticated understanding of the non-mutation limited regime. In this regime, the distinction between de novo mutations and standing variation becomes blurred since every mutation at every site exists in the population most of the time. Populations should thus be able to explore the genotype space very effciently and not remain stranded on local fitness peaks for long periods of time [90,92]. Complex, multi-step adaptations can arise quickly, with intermediate steps not necessarily reaching high population frequencies [90,93]. Finally, since genetic drift will be weak most of the time, the patterns and levels of neutral polymorphisms should be primarily determined by the stochastic effects generated by recurrent selective sweeps at closely linked sites, the so-called genetic draft [94–98].
Clearly, in order to arrive at a more comprehensive understanding of the adaptive process, we need to develop better methods for quantifying soft sweeps in population genomic data, determining their rate and strength, and ultimately identifying the causal adaptive mutations. This task is challenging but holds much promise, given the vast amount of genomic data becoming available, and given that many, if not most, cases of adaptation are yet to be discovered.
Highlights.
There is mounting evidence that rapid adaptation often produces soft rather than hard selective sweeps.
Yet population genetic models typically assume mutation-limited scenarios and hard selective sweeps.
We argue that this discrepancy reflects the confusion of two different definitions of the effective population size.
Acknowledgments
We thank Nick Barton, Ben Callahan, Graham Coop, Justin Fay, Nandita Garud, Joachim Hermisson, Rajiv McCoy, Richard Neher, Pleuni Pennings, Peter Ralph, Noah Rosenberg, Fabian Staubach, Ben Wilson, members of the Petrov lab, and three anonymous reviewers for helpful discussions and comments on the manuscript. This work was supported by the NIH under grants GM089926 and HG002568 to DAP.
Footnotes
Publisher's Disclaimer: This is a PDF file of an unedited manuscript that has been accepted for publication. As a service to our customers we are providing this early version of the manuscript. The manuscript will undergo copyediting, typesetting, and review of the resulting proof before it is published in its final citable form. Please note that during the production process errors may be discovered which could affect the content, and all legal disclaimers that apply to the journal pertain.
References
- 1.Barton NH, Keightley PD. Understanding quantitative genetic variation. Nat Rev Genet. 2002;3:11–21. doi: 10.1038/nrg700. [DOI] [PubMed] [Google Scholar]
- 2.Fisher R. The genetical theory of natural selection. Clarendon Press; Oxford: 1930. [Google Scholar]
- 3.Daborn P, et al. DDT resistance in Drosophila correlates with Cyp6g1 over-expression and confers cross-resistance to the neonicotinoid imidacloprid. Mol Genet Genomics. 2001;266:556–563. doi: 10.1007/s004380100531. [DOI] [PubMed] [Google Scholar]
- 4.Hoekstra HE, et al. A single amino acid mutation contributes to adaptive beach mouse color pattern. Science. 2006;313:101–104. doi: 10.1126/science.1126121. [DOI] [PubMed] [Google Scholar]
- 5.Colosimo PF, et al. Widespread parallel evolution in sticklebacks by repeated fixation of Ectodysplasin alleles. Science. 2005;307:1928–1933. doi: 10.1126/science.1107239. [DOI] [PubMed] [Google Scholar]
- 6.Bersaglieri T, et al. Genetic signatures of strong recent positive selection at the lactase gene. Am J Hum Genet. 2004;74:1111–1120. doi: 10.1086/421051. [DOI] [PMC free article] [PubMed] [Google Scholar]
- 7.Maynard Smith J, Haigh J. The hitch-hiking effect of a favourable gene. Genetical Research. 1974;23:23–35. [PubMed] [Google Scholar]
- 8.Kaplan NL, et al. The “hitchhiking effect” revisited. Genetics. 1989;123:887–899. doi: 10.1093/genetics/123.4.887. [DOI] [PMC free article] [PubMed] [Google Scholar]
- 9.Hermisson J, Pennings PS. Soft sweeps: molecular population genetics of adaptation from standing genetic variation. Genetics. 2005;169:2335–2352. doi: 10.1534/genetics.104.036947. [DOI] [PMC free article] [PubMed] [Google Scholar]
- 10.Barton N. Understanding adaptation in large populations. PLoS Genet. 2010;6:e1000987. doi: 10.1371/journal.pgen.1000987. [DOI] [PMC free article] [PubMed] [Google Scholar]
- 11.Pennings PS, Hermisson J. Soft sweeps II–molecular population genetics of adaptation from recurrent mutation or migration. Mol Biol Evol. 2006;23:1076–1084. doi: 10.1093/molbev/msj117. [DOI] [PubMed] [Google Scholar]
- 12.Orr HA, Betancourt AJ. Haldane’s sieve and adaptation from the standing genetic variation. Genetics. 2001;157:875–884. doi: 10.1093/genetics/157.2.875. [DOI] [PMC free article] [PubMed] [Google Scholar]
- 13.Innan H, Kim Y. Pattern of polymorphism after strong artificial selection in a domestication event. Proc Natl Acad Sci USA. 2004;101:10667–10672. doi: 10.1073/pnas.0401720101. [DOI] [PMC free article] [PubMed] [Google Scholar]
- 14.Arendt J, Reznick D. Convergence and parallelism reconsidered: what have we learned about the genetics of adaptation? Trends Ecol Evol (Amst) 2008;23:26–32. doi: 10.1016/j.tree.2007.09.011. [DOI] [PubMed] [Google Scholar]
- 15.Coop G, et al. The role of geography in human adaptation. PLoS Genet. 2009;5:e1000500. doi: 10.1371/journal.pgen.1000500. [DOI] [PMC free article] [PubMed] [Google Scholar]
- 16.Ralph P, Coop G. Parallel adaptation: one or many waves of advance of an advantageous allele? Genetics. 2010;186:647–668. doi: 10.1534/genetics.110.119594. [DOI] [PMC free article] [PubMed] [Google Scholar]
- 17.Novembre J, Han E. Human population structure and the adaptive response to pathogen-induced selection pressures. Philos Trans R Soc Lond, B, Biol Sci. 2012;367:878–886. doi: 10.1098/rstb.2011.0305. [DOI] [PMC free article] [PubMed] [Google Scholar]
- 18.Kim Y, Stephan W. Detecting a local signature of genetic hitchhiking along a recombining chromosome. Genetics. 2002;160:765–777. doi: 10.1093/genetics/160.2.765. [DOI] [PMC free article] [PubMed] [Google Scholar]
- 19.Fay JC, Wu CI. Hitchhiking under positive Darwinian selection. Genetics. 2000;155:1405–1413. doi: 10.1093/genetics/155.3.1405. [DOI] [PMC free article] [PubMed] [Google Scholar]
- 20.Slatkin M, Hudson RR. Pairwise comparisons of mitochondrial DNA sequences in stable and exponentially growing populations. Genetics. 1991;129:555–562. doi: 10.1093/genetics/129.2.555. [DOI] [PMC free article] [PubMed] [Google Scholar]
- 21.Barton NH. The effect of hitch-hiking on neutral genealogies. Genetics Research. 1998;72:123–133. [Google Scholar]
- 22.Durrett R, Schweinsberg J. Approximating selective sweeps. Theor Popul Biol. 2004;66:129–138. doi: 10.1016/j.tpb.2004.04.002. [DOI] [PubMed] [Google Scholar]
- 23.Hudson RR, et al. Evidence for positive selection in the superoxide dismutase (Sod) region of Drosophila melanogaster. Genetics. 1994;136:1329–1340. doi: 10.1093/genetics/136.4.1329. [DOI] [PMC free article] [PubMed] [Google Scholar]
- 24.Hudson RR, et al. A test of neutral molecular evolution based on nucleotide data. Genetics. 1987;116:153–159. doi: 10.1093/genetics/116.1.153. [DOI] [PMC free article] [PubMed] [Google Scholar]
- 25.Tajima F. Statistical method for testing the neutral mutation hypothesis by DNA polymorphism. Genetics. 1989;123:585–595. doi: 10.1093/genetics/123.3.585. [DOI] [PMC free article] [PubMed] [Google Scholar]
- 26.Wiehe TH, Stephan W. Analysis of a genetic hitchhiking model, and its application to DNA polymorphism data from Drosophila melanogaster. Mol Biol Evol. 1993;10:842–854. doi: 10.1093/oxfordjournals.molbev.a040046. [DOI] [PubMed] [Google Scholar]
- 27.Sabeti PC, et al. Detecting recent positive selection in the human genome from haplotype structure. Nature. 2002;419:832–837. doi: 10.1038/nature01140. [DOI] [PubMed] [Google Scholar]
- 28.Przeworski M. Estimating the time since the fixation of a beneficial allele. Genetics. 2003;164:1667– 1676. doi: 10.1093/genetics/164.4.1667. [DOI] [PMC free article] [PubMed] [Google Scholar]
- 29.Nielsen R, et al. Genomic scans for selective sweeps using SNP data. Genome Res. 2005;15:1566–1575. doi: 10.1101/gr.4252305. [DOI] [PMC free article] [PubMed] [Google Scholar]
- 30.Voight BF, et al. A map of recent positive selection in the human genome. PLoS Biol. 2006;4:e72. doi: 10.1371/journal.pbio.0040072. [DOI] [PMC free article] [PubMed] [Google Scholar]
- 31.Sabeti PC, et al. Genome-wide detection and characterization of positive selection in human populations. Nature. 2007;449:913–918. doi: 10.1038/nature06250. [DOI] [PMC free article] [PubMed] [Google Scholar]
- 32.Przeworski M, et al. The signature of positive selection on standing genetic variation. Evolution. 2005;59:2312–2323. [PubMed] [Google Scholar]
- 33.Pennings PS, Hermisson J. Soft sweeps III: the signature of positive selection from recurrent mutation. PLoS Genet. 2006;2:e186. doi: 10.1371/journal.pgen.0020186. [DOI] [PMC free article] [PubMed] [Google Scholar]
- 34.Cutter AD, Payseur BA. Genomic signatures of selection at linked sites: unifying the disparity among species. Nat Rev Genet. 2013;14:262–274. doi: 10.1038/nrg3425. [DOI] [PMC free article] [PubMed] [Google Scholar]
- 35.Williamson SH, et al. Localizing recent adaptive evolution in the human genome. PLoS Genet. 2007;3:e90. doi: 10.1371/journal.pgen.0030090. [DOI] [PMC free article] [PubMed] [Google Scholar]
- 36.Bacheler LT, et al. Human immunodeficiency virus type 1 mutations selected in patients failing efavirenz combination therapy. Antimicrob Agents Chemother. 2000;44:2475–2484. doi: 10.1128/aac.44.9.2475-2484.2000. [DOI] [PMC free article] [PubMed] [Google Scholar]
- 37.Pennings PS, et al. Loss and recovery of genetic diversity in adapting populations of HIV. ArXiv. 2013 doi: 10.1371/journal.pgen.1004000. [DOI] [PMC free article] [PubMed] [Google Scholar]
- 38.Tishkoff SA, et al. Convergent adaptation of human lactase persistence in Africa and Europe. Nat Genet. 2007;39:31–40. doi: 10.1038/ng1946. [DOI] [PMC free article] [PubMed] [Google Scholar]
- 39.Enattah NS, et al. Independent introduction of two lactase-persistence alleles into human populations reflects different history of adaptation to milk culture. Am J Hum Genet. 2008;82:57–72. doi: 10.1016/j.ajhg.2007.09.012. [DOI] [PMC free article] [PubMed] [Google Scholar]
- 40.Menozzi P, et al. Mutations of acetylcholinesterase which confer insecticide resistance in Drosophila melanogaster populations. BMC Evol Biol. 2004;4:4. doi: 10.1186/1471-2148-4-4. [DOI] [PMC free article] [PubMed] [Google Scholar]
- 41.Karasov T, et al. Evidence that adaptation in Drosophila is not limited by mutation at single sites. PLoS Genet. 2010;6:e1000924. doi: 10.1371/journal.pgen.1000924. [DOI] [PMC free article] [PubMed] [Google Scholar]
- 42.Nair S, et al. Recurrent gene amplification and soft selective sweeps during evolution of multidrug resistance in malaria parasites. Mol Biol Evol. 2007;24:562–573. doi: 10.1093/molbev/msl185. [DOI] [PubMed] [Google Scholar]
- 43.Salgueiro P, et al. Tracing the origins and signatures of selection of antifolate resistance in island populations of Plasmodium falciparum. BMC Infect Dis. 2010;10:163. doi: 10.1186/1471-2334-10-163. [DOI] [PMC free article] [PubMed] [Google Scholar]
- 44.Fischer W, et al. Transmission of single HIV-1 genomes and dynamics of early immune escape revealed by ultra-deep sequencing. PLoS ONE. 2010;5:e12303. doi: 10.1371/journal.pone.0012303. [DOI] [PMC free article] [PubMed] [Google Scholar]
- 45.Messer PW, Neher RA. Estimating the strength of selective sweeps from deep population diversity data. Genetics. 2012;191:593–605. doi: 10.1534/genetics.112.138461. [DOI] [PMC free article] [PubMed] [Google Scholar]
- 46.Chen WJ, et al. At least two origins of fungicide resistance in grapevine downy mildew populations. Appl Environ Microbiol. 2007;73:5162–5172. doi: 10.1128/AEM.00507-07. [DOI] [PMC free article] [PubMed] [Google Scholar]
- 47.Skuce P, et al. Benzimidazole resistance allele haplotype diversity in United Kingdom isolates of Teladorsagia circumcincta supports a hypothesis of multiple origins of resistance by recurrent mutation. Int J Parasitol. 2010;40:1247–1255. doi: 10.1016/j.ijpara.2010.03.016. [DOI] [PubMed] [Google Scholar]
- 48.Aminetzach YT, et al. Pesticide resistance via transposition-mediated adaptive gene truncation in Drosophila. Science. 2005;309:764–767. doi: 10.1126/science.1112699. [DOI] [PubMed] [Google Scholar]
- 49.Magwire MM, et al. Successive increases in the resistance of Drosophila to viral infection through a transposon insertion followed by a Duplication. PLoS Genet. 2011;7:e1002337. doi: 10.1371/journal.pgen.1002337. [DOI] [PMC free article] [PubMed] [Google Scholar]
- 50.Chung H, et al. Cis-regulatory elements in the Accord retrotransposon result in tissue-specific expression of the Drosophila melanogaster insecticide resistance gene Cyp6g1. Genetics. 2007;175:1071–1077. doi: 10.1534/genetics.106.066597. [DOI] [PMC free article] [PubMed] [Google Scholar]
- 51.Schmidt JM, et al. Copy number variation and transposable elements feature in recent, ongoing adaptation at the Cyp6g1 locus. PLoS Genet. 2010;6:e1000998. doi: 10.1371/journal.pgen.1000998. [DOI] [PMC free article] [PubMed] [Google Scholar]
- 52.Jeong S, et al. The evolution of gene regulation underlies a morphological difference between two Drosophila sister species. Cell. 2008;132:783–793. doi: 10.1016/j.cell.2008.01.014. [DOI] [PubMed] [Google Scholar]
- 53.Labbe P, et al. Independent duplications of the acetylcholinesterase gene conferring insecticide resistance in the mosquito Culex pipiens. Mol Biol Evol. 2007;24:1056–1067. doi: 10.1093/molbev/msm025. [DOI] [PubMed] [Google Scholar]
- 54.Chan YF, et al. Adaptive evolution of pelvic reduction in sticklebacks by recurrent deletion of a Pitx1 enhancer. Science. 2010;327:302–305. doi: 10.1126/science.1182213. [DOI] [PMC free article] [PubMed] [Google Scholar]
- 55.Jones FC, et al. The genomic basis of adaptive evolution in threespine sticklebacks. Nature. 2012;484:55–61. doi: 10.1038/nature10944. [DOI] [PMC free article] [PubMed] [Google Scholar]
- 56.Domingues VS, et al. Evidence of adaptation from ancestral variation in young populations of beach mice. Evolution. 2012;66:3209–3223. doi: 10.1111/j.1558-5646.2012.01669.x. [DOI] [PubMed] [Google Scholar]
- 57.Drummond D. Rats resistant to warfarin. New Sci. 1966;30:771–772. [Google Scholar]
- 58.Pelz HJ, et al. The genetic basis of resistance to anticoagulants in rodents. Genetics. 2005;170:1839–1847. doi: 10.1534/genetics.104.040360. [DOI] [PMC free article] [PubMed] [Google Scholar]
- 59.Oner C, et al. Beta S haplotypes in various world populations. Hum Genet. 1992;89:99–104. doi: 10.1007/BF00207052. [DOI] [PubMed] [Google Scholar]
- 60.Kwiatkowski DP. How malaria has affected the human genome and what human genetics can teach us about malaria. Am J Hum Genet. 2005;77:171–192. doi: 10.1086/432519. [DOI] [PMC free article] [PubMed] [Google Scholar]
- 61.Louicharoen C, et al. Positively selected G6PD-Mahidol mutation reduces Plasmodium vivax density in Southeast Asians. Science. 2009;326:1546–1549. doi: 10.1126/science.1178849. [DOI] [PubMed] [Google Scholar]
- 62.Peter BM, et al. Distinguishing between selective sweeps from standing variation and from a de novo mutation. PLoS Genet. 2012;8:e1003011. doi: 10.1371/journal.pgen.1003011. [DOI] [PMC free article] [PubMed] [Google Scholar]
- 63.Pokalyuk C. The effect of recurrent mutation on the linkage disequilibrium under a selective sweep. J Math Biol. 2012;64:291–317. doi: 10.1007/s00285-011-0411-y. [DOI] [PubMed] [Google Scholar]
- 64.Garud NR, et al. Soft selective sweeps are the primary mode of recent adaptation in Drosophila melanogaster. ArXiv. 2013 1303.0906. [Google Scholar]
- 65.Mackay TF, et al. The Drosophila melanogaster Genetic Reference Panel. Nature. 2012;482:173–178. doi: 10.1038/nature10811. [DOI] [PMC free article] [PubMed] [Google Scholar]
- 66.Kimura M. On the probability of fixation of mutant genes in a population. Genetics. 1962;47:713–719. doi: 10.1093/genetics/47.6.713. [DOI] [PMC free article] [PubMed] [Google Scholar]
- 67.Ewens WJ. Mathematical Population Genetics. 2 Springer; New York: 2004. [Google Scholar]
- 68.Barrick JE, et al. Genome evolution and adaptation in a long-term experiment with Escherichia coli. Nature. 2009;461:1243–1247. doi: 10.1038/nature08480. [DOI] [PubMed] [Google Scholar]
- 69.Johansson AM, et al. Genome-wide effects of long-term divergent selection. PLoS Genet. 2010;6:e1001188. doi: 10.1371/journal.pgen.1001188. [DOI] [PMC free article] [PubMed] [Google Scholar]
- 70.Burke MK, et al. Genome-wide analysis of a long-term evolution experiment with Drosophila. Nature. 2010;467:587–590. doi: 10.1038/nature09352. [DOI] [PubMed] [Google Scholar]
- 71.Bergland AO, et al. Genomic evidence of rapid and stable adaptive oscillations over seasonal time scales in Drosophila. ArXiv. 2013 doi: 10.1371/journal.pgen.1004775. 1303.5044. [DOI] [PMC free article] [PubMed] [Google Scholar]
- 72.Sellis D, et al. Heterozygote advantage as a natural consequence of adaptation in diploids. Proc Natl Acad Sci USA. 2011;108:20666–20671. doi: 10.1073/pnas.1114573108. [DOI] [PMC free article] [PubMed] [Google Scholar]
- 73.Fisher R. The wave of advance of advantageous genes. Ann Eugen. 1937;7:355–369. [Google Scholar]
- 74.Kolmogorov A, et al. A study of the equation of diffusion with increase in the quantity of matter, and its application to a biological problem. Byul Moskovskogo Gos Univ. 1937;1:1–25. [Google Scholar]
- 75.Volpert V, Petrovskii S. Reaction-diffusion waves in biology. Phys Life Rev. 2009;6:267–310. doi: 10.1016/j.plrev.2009.10.002. [DOI] [PubMed] [Google Scholar]
- 76.Muller HJ. Some genetic aspects of sex. The American Naturalist. 1932;66:118–138. [Google Scholar]
- 77.Desai MM, Fisher DS. Beneficial mutation selection balance and the effect of linkage on positive selection. Genetics. 2007;176:1759–1798. doi: 10.1534/genetics.106.067678. [DOI] [PMC free article] [PubMed] [Google Scholar]
- 78.Weissman DB, Barton NH. Limits to the rate of adaptive substitution in sexual populations. PLoS Genet. 2012;8:e1002740. doi: 10.1371/journal.pgen.1002740. [DOI] [PMC free article] [PubMed] [Google Scholar]
- 79.Good BH, Desai MM. Fluctuations in fitness distributions and the effects of weak linked selection on sequence evolution. Theor Popul Biol. 2013;85:86–102. doi: 10.1016/j.tpb.2013.01.005. [DOI] [PubMed] [Google Scholar]
- 80.Charlesworth B. Fundamental concepts in genetics: effective population size and patterns of molecular evolution and variation. Nat Rev Genet. 2009;10:195–205. doi: 10.1038/nrg2526. [DOI] [PubMed] [Google Scholar]
- 81.Gronau I, et al. Bayesian inference of ancient human demography from individual genome sequences. Nat Genet. 2011;43:1031–1034. doi: 10.1038/ng.937. [DOI] [PMC free article] [PubMed] [Google Scholar]
- 82.Li H, Durbin R. Inference of human population history from individual whole-genome sequences. Nature. 2011;475:493–496. doi: 10.1038/nature10231. [DOI] [PMC free article] [PubMed] [Google Scholar]
- 83.Ives PT. Further genetic studies of the south amherst population of drosophila melanogaster. Evolution. 1970;24:507–518. doi: 10.1111/j.1558-5646.1970.tb01785.x. [DOI] [PubMed] [Google Scholar]
- 84.Kingman J. The coalescent. Stochastic Processes and their Applications. 1982;13:235– 248. [Google Scholar]
- 85.Leffler EM, et al. Revisiting an old riddle: what determines genetic diversity levels within species? PLoS Biol. 2012;10:e1001388. doi: 10.1371/journal.pbio.1001388. [DOI] [PMC free article] [PubMed] [Google Scholar]
- 86.Sjodin P, et al. On the meaning and existence of an effective population size. Genetics. 2005;169:1061–1070. doi: 10.1534/genetics.104.026799. [DOI] [PMC free article] [PubMed] [Google Scholar]
- 87.Wakeley J, Sargsyan O. Extensions of the coalescent effective population size. Genetics. 2009;181:341–345. doi: 10.1534/genetics.108.092460. [DOI] [PMC free article] [PubMed] [Google Scholar]
- 88.Gillespie JH. Is the population size of a species relevant to its evolution? Evolution. 2001;55:2161–2169. doi: 10.1111/j.0014-3820.2001.tb00732.x. [DOI] [PubMed] [Google Scholar]
- 89.Kondrashov FA, Kondrashov AS. Measurements of spontaneous rates of mutations in the recent past and the near future. Philos Trans R Soc Lond, B, Biol Sci. 2010;365:1169–1176. doi: 10.1098/rstb.2009.0286. [DOI] [PMC free article] [PubMed] [Google Scholar]
- 90.Weissman DB, et al. The rate of fitness-valley crossing in sexual populations. Genetics. 2010;186:1389–1410. doi: 10.1534/genetics.110.123240. [DOI] [PMC free article] [PubMed] [Google Scholar]
- 91.Lynch M. The evolution of multimeric protein assemblages. Mol Biol Evol. 2012;29:1353–1366. doi: 10.1093/molbev/msr300. [DOI] [PMC free article] [PubMed] [Google Scholar]
- 92.Lynch M. Scaling expectations for the time to establishment of complex adaptations. Proc Natl Acad Sci USA. 2010;107:16577–16582. doi: 10.1073/pnas.1010836107. [DOI] [PMC free article] [PubMed] [Google Scholar]
- 93.Neher RA, et al. Rate of adaptation in large sexual populations. Genetics. 2010;184:467–481. doi: 10.1534/genetics.109.109009. [DOI] [PMC free article] [PubMed] [Google Scholar]
- 94.Gillespie JH. Genetic drift in an infinite population. The pseudohitchhiking model. Genetics. 2000;155:909–919. doi: 10.1093/genetics/155.2.909. [DOI] [PMC free article] [PubMed] [Google Scholar]
- 95.Neher RA, Shraiman BI. Genetic draft and quasi-neutrality in large facultatively sexual populations. Genetics. 2011;188:975–996. doi: 10.1534/genetics.111.128876. [DOI] [PMC free article] [PubMed] [Google Scholar]
- 96.Messer PW, Petrov DA. Frequent adaptation and the McDonald-Kreitman test. Proc Natl Acad Sci USA. 2013;110:8615–8620. doi: 10.1073/pnas.1220835110. [DOI] [PMC free article] [PubMed] [Google Scholar]
- 97.Neher RA, Hallatschek O. Genealogies of rapidly adapting populations. Proc Natl Acad Sci USA. 2013;110:437–442. doi: 10.1073/pnas.1213113110. [DOI] [PMC free article] [PubMed] [Google Scholar]
- 98.Desai MM, et al. Genetic diversity and the structure of genealogies in rapidly adapting populations. Genetics. 2013;193:565–585. doi: 10.1534/genetics.112.147157. [DOI] [PMC free article] [PubMed] [Google Scholar]