

Abstract
Summary: We introduce a web-based tool, Peak Annotation and Visualization (PAVIS), for annotating and visualizing ChIP-seq peak data. PAVIS is designed with non-bioinformaticians in mind and presents a straightforward user interface to facilitate biological interpretation of ChIP-seq peak or other genomic enrichment data. PAVIS, through association with annotation, provides relevant genomic context for each peak, such as peak location relative to genomic features including transcription start site, intron, exon or 5′/3′-untranslated region. PAVIS reports the relative enrichment P-values of peaks in these functionally distinct categories, and provides a summary plot of the relative proportion of peaks in each category. PAVIS, unlike many other resources, provides a peak-oriented annotation and visualization system, allowing dynamic visualization of tens to hundreds of loci from one or more ChIP-seq experiments, simultaneously. PAVIS enables rapid, and easy examination and cross-comparison of the genomic context and potential functions of the underlying genomic elements, thus supporting downstream hypothesis generation.
Availability and Implementation: PAVIS is publicly accessed at http://manticore.niehs.nih.gov/pavis.
Contact: li3@niehs.nih.gov
Supplementary information: Supplementary data are available at Bioinformatics online
1 INTRODUCTION
The advance of sequencing technology and its exponential declining cost have made it possible to conduct many genome-wide studies to understand complex biological processes such as gene regulation, epigenomic changes and chromatin remodeling. These studies have generated a large number of ChIP-seq datasets that are subsequently parsed by peak calling programs (Salmon-Divon et al., 2010) to report statistically significant peaks. For a genome-wide study, the number of significant peaks can be tens to hundreds of thousands. The biological relevance of a ChIP-seq peak and the functions of its underlying DNA element are often dependent on its position relative to nearby genes or other functional elements. It can be a challenging and time-consuming task to examine all peaks, and to develop meaningful biological interpretations of their functional relevance. Motivated by this challenge, we developed the PAVIS tool to facilitate data comparison, interpretation and hypothesis generation from ChIP-seq peak data.
There are several existing software tools that can be used for annotation and visualization of ChIP-seq peaks, e.g. CisGenome (Ji et al., 2008) and PeakAnalyzer/PeakAnnotator (Salmon-Divon et al., 2010). All of these tools are useful for ChIP-seq peak data analysis and interpretation, but they each have limitations. PeakAnalyzer/PeakAnnotator is a highly efficient tool with utilities not only for functional annotation of peaks, but also for sequence extraction supporting motif analysis. However, it does not provide peak visualization capability. CisGenome provides capabilities similar to PeakAnalyzer. CisGenome, however, does not support the annotation of many existing ChIP-seq peak files including many of those from the ENCODE project (Thomas et al., 2007). Both the UCSC genome browser (Kent et al., 2002) and the Integrative Genomics Viewer (Thorvaldsdottir et al., 2012) are powerful tools and have more capabilities, displaying multiple relevant data in different tracks. Their visualization capabilities, however, are designed to display maximal information for a single genomic region one at a time. As a complimentary tool, PAVIS is designed to display multiple loci simultaneously with each locus linked to the UCSC browser for additional information. Furthermore, PAVIS can be used to annotate ChIP-seq peaks in the context of nearby gene features.
2 FEATURES AND METHODS
PAVIS is designed and developed for ease of use for biologists or bench scientists. PAVIS’ back-end engine was written in Python for ease of maintenance and its web-based interface and visualization explorer were implemented with HTML5 and Ajax JavaScript codes. PAVIS currently supports genomic annotation of several species including human, mouse, rat, worm and yeast. All genomic annotation data and alignment data were from the UCSC genome browser. PAVIS offers two primary functions: peak data annotation and peak visualization within relevant genomic context.
PAVIS takes as the input the peak location data generated by peak-calling tools, e.g. MACS (Zhang et al., 2008), or other more general ChIP-seq data analysis tool, e.g. EpiCenter (Huang et al., 2011). The default format of input peak data files is the UCSC BED format. PAVIS also supports the GFF3 format, and can use peak data files from most ChIP-seq data analysis tools. PAVIS offers two user interfaces for query data: clear and intuitive. The clear interface is the default interface, and is more concise and clear but offers fewer options. The intuitive interface affords a more detailed explanation of each query field, and provides additional query options such as sequence conservation annotation and the output data file format (e.g. MS Excel format). A query peak file, the file to be annotated in genetic feature context, is loaded through either the clear or intuitive interface. As an option, this query peak file can be compared with up to five other peak files.
2.2 Peak annotation
Annotation of query peaks includes identification of the closest gene to each peak and its relative location: upstream of transcription start site (TSS), intron, exon, 5′/3′-untranslated region or downstream of transcription termination site (TTS). When there are multiple nearby genes for a peak, the peak is associated with the genes whose TSS is the closest to the peak if the peak is within the gene region, if not, the peak is associated with the genes with the closest TSS unless the peak is closer to the TTS of another gene. As a part of the annotation, PAVIS can also compute the sequence conservation score of each peak region. PAVIS annotation report provides summary statistics such as the number of annotated peaks and relative enrichment level in each genomic feature category (see Supplementary Material for the enrichment test). The report also provides download links of annotated data and displays the relative proportion of peaks in each category (Fig. 1).
Fig. 1.
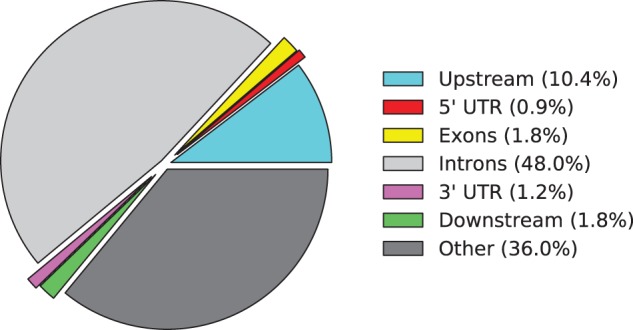
A pie chart example from PAVIS annotation report
2.3 Peak visualization
PAVIS’ visualization interface ‘Visual Locus Explorer’ is launched directly from the PAVIS annotation report. The interface consists of three components: the control panel, the peak density view panel and the peak visualization panel consisting of multiple display windows (Fig. 2, Supplementary Figs. 2–4). Using peak-oriented visualization, PAVIS can simultaneously display multiple peaks with their relevant genomic context in their respective windows. The query peak is automatically centered in its respective display window, which can be zoomed in or out independent of other display windows.
Fig. 2.
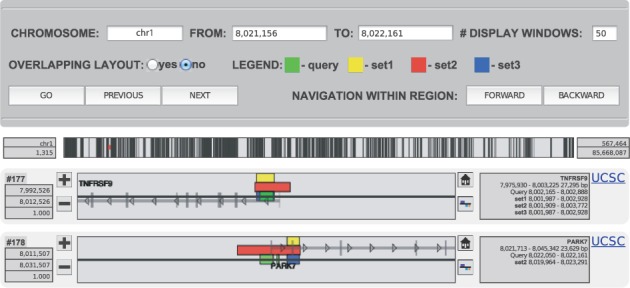
Illustration of PAVIS visualization explorer. On the top is the navigation control panel with the legend indicating colors for query and comparison peaks. In the middle is the density overview bar of all query peaks on the chromosome, where the red line segment indicates the displayed peaks location. At the bottom are two display windows showing query peaks #177 and #178 and their comparison peaks, respectively
PAVIS graphically displays peak-relevant genomic context including genes, exons, intron, TSS, TTS and transcription direction of genes in flanking genomic regions. The zooming function enables users to get a compact view of genomic context in the large surrounding region or to take a detailed close look at the nearby region of a peak. Each display window has its own reset button that can quickly bring back the display region to the default 20 kb region after zooming in/out operation. PAVIS also supports the mouseover function to display relevant information such as gene names, peak ID and peak width. Furthermore, PAVIS supports the integration of the UCSC browser, allowing viewing the genomic region of the current window in the UCSC browser.
By default, PAVIS shows the first 50 peaks (all peaks if <50) in the selected chromosome, and displays peaks in overlapping style by assigning a unique color to each peak dataset. The query peak is always assigned green and other color assignment shown by the legend on the control panel. PAVIS offers options in the control panel to change the chromosome and the range interactively, to use non-overlapping style view of peaks and to navigate peaks in either the chromosome-wide or within-region mode.
Supplementary Material
ACKNOWLEDGEMENTS
The authors thank Xiaojiang Xu at NIEHS Integrative Bioinformatics for helping with software testing, and Shuangshuang Dai and the NIEHS computational biology facility for their help with the setup of the PAVIS Web site and support for computational infrastructure.
Funding: Intramural Research Program of the NIH, the National Institute of Environmental Health Sciences (ES101765).
Conflict of Interest: none declared.
References
- Huang W, et al. Efficiently identifying genome-wide changes with next-generation sequencing data. Nucleic Acids Res. 2011;39:e130. doi: 10.1093/nar/gkr592. [DOI] [PMC free article] [PubMed] [Google Scholar]
- Ji H, et al. An integrated software system for analyzing ChIP-chip and ChIP-seq data. Nat. Biotechnol. 2008;26:1293–1300. doi: 10.1038/nbt.1505. [DOI] [PMC free article] [PubMed] [Google Scholar]
- Kent WJ, et al. The human genome browser at UCSC. Genome Res. 2002;12:996–1006. doi: 10.1101/gr.229102. [DOI] [PMC free article] [PubMed] [Google Scholar]
- Salmon-Divon M, et al. PeakAnalyzer: genome-wide annotation of chromatin binding and modification loci. BMC Bioinformatics. 2010;11:415. doi: 10.1186/1471-2105-11-415. [DOI] [PMC free article] [PubMed] [Google Scholar]
- Thomas DJ, et al. The ENCODE Project at UC Santa Cruz. Nucleic Acids Res. 2007;35:D663–D667. doi: 10.1093/nar/gkl1017. [DOI] [PMC free article] [PubMed] [Google Scholar]
- Thorvaldsdottir H, et al. Integrative Genomics Viewer (IGV): high-performance genomics data visualization and exploration. Brief. Bioinform. 2012;14:178–192. doi: 10.1093/bib/bbs017. [DOI] [PMC free article] [PubMed] [Google Scholar]
- Zhang Y, et al. Model-based analysis of ChIP-Seq (MACS) Genome Biol. 2008;9:R137. doi: 10.1186/gb-2008-9-9-r137. [DOI] [PMC free article] [PubMed] [Google Scholar]
Associated Data
This section collects any data citations, data availability statements, or supplementary materials included in this article.