


Abstract
Modern high-throughput methods allow the investigation of biological functions across multiple ‘omics’ levels. Levels include mRNA and protein expression profiling as well as additional knowledge on, for example, DNA methylation and microRNA regulation. The reason for this interest in multi-omics is that actual cellular responses to different conditions are best explained mechanistically when taking all omics levels into account. To map gene products to their biological functions, public ontologies like Gene Ontology are commonly used. Many methods have been developed to identify terms in an ontology, overrepresented within a set of genes. However, these methods are not able to appropriately deal with any combination of several data types. Here, we propose a new method to analyse integrated data across multiple omics-levels to simultaneously assess their biological meaning. We developed a model-based Bayesian method for inferring interpretable term probabilities in a modular framework. Our Multi-level ONtology Analysis (MONA) algorithm performed significantly better than conventional analyses of individual levels and yields best results even for sophisticated models including mRNA fine-tuning by microRNAs. The MONA framework is flexible enough to allow for different underlying regulatory motifs or ontologies. It is ready-to-use for applied researchers and is available as a standalone application from http://icb.helmholtz-muenchen.de/mona.
INTRODUCTION
The ability of cells to adjust to given environmental or disease conditions is a result of their ability to perform specific biological functions and processes. These are in turn orchestrated by a tight regulation of gene responses across many molecular levels (Figure 1). The gene product carrying out the biological function is a result of not only protein expression and activity but also of gene expression on mRNA level, gene promotor methylation states and existing single nucleotide polymorphisms within the genome. Fine-tuning mechanisms of, for example, microRNA (miRNA) post-transcriptional modification of mRNAs also contribute to the joint gene responses of cells. Finally, protein phosphorylation controls the enzymatic activity of a gene product for example in signaling cascades (1).
Figure 1.
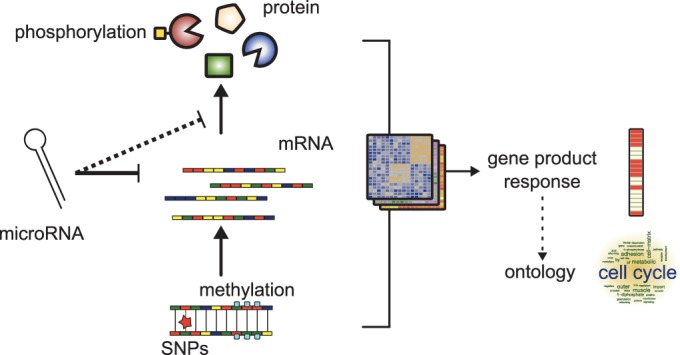
Multilevel gene responses. The signature of condition-specific changes in biological functions is captured in gene responses, which are measurable on many omics levels. When integrated across levels, organism-wide profiling provides a comprehensive and multilevel picture that most reliably describes active biological processes.
Methods for large-scale profiling assess entire molecular species all at once. For example, microarrays allow to profile mRNA expression levels. Typically experiments are conducted to analyse gene responses to different environmental or disease states. Nowadays, it gets more and more common to make use of multiple omics techniques at once (2–4). Statistical analyses then yield a list of responders to the condition across the different species. Consequently, this allows for the identification of biological features that are over-represented among these lists of gene responses. Owing to the decreasing costs, this multi-omics approach becomes even more popular. Therefore, the integration of multiple data types is one of the key challenges in bioinformatics. Examples include custom clustering algorithms (5) and the joint modelling of multiple species such as DNA methylation and gene expression data (6) or miRNA and gene expression data (7).
A common approach to find altered biological functions in a long list of genes is to use statistical methods to identify significantly over-represented pre-defined gene sets (8,9). Most commonly, these gene sets represent biological terms in an ontology like Gene Ontology (GO) (10) or others such as pathways [e.g. from the Kyoto Encyclopedia of Genes and Genomes (KEGG) (11)]. Many methods deal with the analysis of GO term enrichments. The most common methods are based on Fisher’s exact test (12,13) or gene set enrichment (14) typically used on either mRNA or protein level. Other methods were developed to enrich on, for example, miRNA level using in silico target site predictions (15,16). Several issues arise when applying these standard approaches: first, the hierarchical structure of GO is not taken into account, which results in many redundant terms; second, corrections for multiple testing have to be performed, but because of the hierarchy of GO terms, they are not independent from each other. To overcome these issues, model-based approaches were introduced, which were initially based on the combination of the model likelihood and a penalization (17) and were further optimized by using a Bayesian modelling approach (18). However, most existing methods are suited for the analysis of one individual expression layer only. Thomas et al. (19) have addressed this issue by introducing an ontology jointly representing disease risk factors and causal mechanisms based on genome typing and epidemiology studies. The proposed ontology is disease-specific (nicotine addiction and treatment) and only applicable to very specific research questions. Recently, an algorithm was introduced for the combined analysis of the protein and mRNA level (20). To the best of our knowledge, no method was yet introduced to handle integrated data from any omics level, while in parallel coping with term redundancies and related multiple testing problems.
Here, we propose a model-based method to reliably calculate interpretable probabilities for term activity by integrating multi-level gene response data. We perform a multi-level ontology analysis (MONA) using a Bayesian approach with a computationally efficient method to approximate the marginal posteriors of ontology terms, given lists of genes responding to experimental conditions. MONA is designed to easily handle any combination of molecular levels in a modular fashion. This is illustrated by a cooperative and an inhibitory model. We demonstrate that MONA outperforms existing methods by integrating multi-omics levels with appropriate biological models not only on synthetic data but also on three integrative studies covering mRNA, protein, methylation states as well as post-transcriptional modifications by miRNA. The framework and inference method is flexible enough to easily allow for other data, underlying regulatory motifs or ontologies.
MATERIALS AND METHODS
Our novel integrative approach MONA couples multi-level omics data in a flexible manner to a common base model (Figure 2). The base model is defined as described previously (17,18) and includes the ontology structure in form of a Bayesian network. Therefore, ontology terms are mapped to hidden nodes representing a gene product, which cannot be fully observed (Figure 2a). In the modular part of the model, MONA couples ‘observed’ layers to the respective hidden gene response node (Figure 2b and c). The design of the observed layer is determined by the experimental setup and depends on the molecular species measured in the experiment. This allows for the flexible integration of arbitrary data types.
Figure 2.
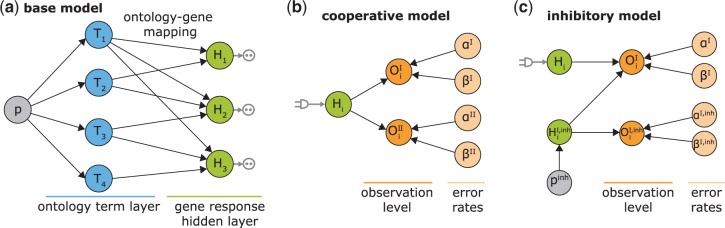
A modular approach for gene set enrichment analysis with multiple observed species. (a) In the base model terms T are connected to hidden gene products H. Each hidden gene product is observed in form of noisy measurements of one or several species. (b and c) Two examples for modules coupled to one hidden gene product depending on the biological relationship of the molecular levels analysed. Each molecular species in the observation layer O has separate error rates. Noise of the measurements is represented by FP and FN rates α and β. Only the hidden gene products Hi are attached directly to an ontology term. The hidden inhibitor activity  is specific for a respective gene.
Base model
The base model can be represented by a Bayesian network with two layers (Figure 2a) as described previously (17,18): the (ontology) term layer consists of boolean nodes indicating whether a term is active. Each term (T) is connected to a set of hidden gene products (H) as defined by, for example, GO. This hidden (unobserved) layer of gene responses has to be introduced between the ontology and the layer of observed variables, for two reasons: First, measurement errors result in false positives (FP) and false negatives (FN) that have to be handled adequately. Second, incorrect or imprecise term-gene assignments may occur, e.g. due to links inferred automatically by GO. Altogether, the hidden gene response layer also allows for a coherent integration of biological observations across multiple layers.
More formally, we define our base model (Figure 2a) in form of conditional probability densities. These conditional densities are defined as follows:
Terms Ti are Bernoulli-distributed boolean random variables modelled with a prior probability p of being on. As we do not know p in advance, we place a Beta prior over p so that we can learn it from the data:
| (1) |
with a and b being the shape parameters of the Beta-Distribution. When a and b are set to 1, we have a uniform prior (i.e. before having seen the data, we consider all possible values for p as equally likely). Prior knowledge on the distribution of p (e.g. if p is known to be small) can be included in form of different choices of a and b (e.g. a = 1 and b = 5 places most of the probability mass on values <0.5).
It is worth noting that the previously defined base model (18) slightly differs form our model: although we place a continuous prior on the probability for a term being on, they chose a restrictive, discrete prior which is defined by default as 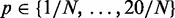 with N being the number of terms.
Hidden nodes
The nodes Hi represent the underlying hidden response of each individual gene. They are modelled as boolean variables, which are deterministically defined such that  if at least one term to which Hi is annotated is on; otherwise
  . If we define
  to denote the set of terms to which gene Hi is annotated, then we can write:
| (2) |
Modular framework to integrate multilevel observations
Depending on the number of observed species (e.g. mRNA, protein and methylation) and their relation to each other, the observed nodes Oi are connected to hidden gene responses Hi. With MONA, we present a general framework allowing for an easy integration of arbitrary molecular species. We illustrate our novel approach by describing three different models in detail.
Single-species model
In this scenario, measurements are only avavilable for one species (e.g. mRNA expression). Consequently, each observation is connected to exactly one hidden node representing its respective gene product (this can be interpreted as a special case of Figure 2b with only one observed species  ).
).
Observations  are observed with FP and FN rates
  and
and  ; similar to p, we place (usually uniform) Beta priors on
  and
and  , as we usually do not know these rates in advance and want to infer them from the data.
| (3) |
| (4) |
Cooperative model
The cooperative model accounts for studies where measurements of two (or more) different species are available, which may be regarded as independent noisy observations (e.g. mRNA and protein) of an underlying common gene response. In contrast to the single-species model, an additional species is observed, which is modelled as independent observation  of gene product with separate FP and FN rates
  and
and  (Figure 2b). Again, we place Beta priors on
  and
and  . For each additional species, error rates are defined accordingly.
| (5) |
| (6) |
Inhibitory model
The inhibitory model is applicable when two species are measured, but they could not be interpreted as independent measurements of the hidden gene function (Figure 2c). A prominent example is the post-transcriptional modulation of mRNA expression by miRNAs. We introduce an additional hidden variable  to the model for each respective gene response H.
  is a boolean random variable, which represents the true underlying state of the inhibitor: If the inhibitor is active,
  , otherwise
  .
.  is modelled to be active with prior probability pinh (
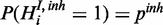 ).
).  is observed in form of
  with own FP and FN rates
  and
and  :
:
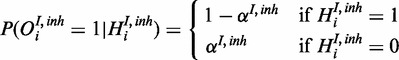 |
(7) |
 |
(8) |
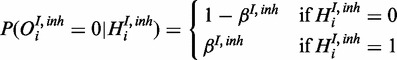
The second observable in the model is the inhibited species ( ). As opposed to the cooperative model, the conditional probability density does not only depend on Hi but also on
  :
:
 |
(9) |
 |
(10) |
This reflects the interaction between the two species: true gene response can either be explained by uninhibited first species or if the inhibitor is active without the first species being active.
Bayesian inference using expectation propagation
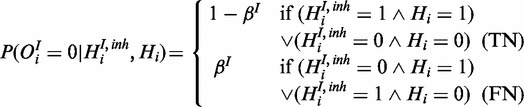
For inference a variety of techniques exist. Lu et al. (17) proposed a maximum-likelihood approach (analysing only a single level), where the likelihood  is maximized with respect to the set of active GO terms
  , given the observed data D and a set of parameters θ. A drawback of the maximum likelihood method is that no distribution is inferred and only one local maximum is found, ignoring alternative solutions. A more robust approach then used Markov Chain Monte Carlo (MCMC) methods to estimate the marginal posterior probabilities
  of being active (18). The marginal posterior is calculated by using a Metropolis–Hastings algorithm to sample from the joint posterior distribution
  . This approach was termed “model-based gene set analysis (MGSA)”. Such MCMC approaches asymptotically provide a random sampler of a target distribution when being run long enough. Consequently, they are a family of algorithms commonly used for inferring posterior distributions of Bayesian networks, which cannot be analysed analytically. However, major drawbacks are comparatively long run times, and for every model definition (e.g. if another species is measured), a new custom sampler has to be implemented that can be very time-consuming and requires expert knowledge.
To overcome the drawbacks of existing methods, we use computationally efficient approximate methods (21) to approximate the marginal posterior.
The marginal posteriors of interest were approximated using the expectation propagation (EP) algorithm (22). These marginal posterior probabilities  (simply referred to as term probability after the methods section) can be interpreted as the outcome of the MONA algorithm in form of the probabilities for each term to be active as best explained by the data. EP makes use of the factorized structure of the posterior and iteratively minimizes the local Kullback–Leibler (KL) divergence from the posterior to a Gaussian approximation of the posterior.
The posterior of the model factorizes as 
 , where θ are all parameters of the model and fi functions as defined in the model specifications while depending on the specific generative model definition. For example, for the cooperative model
 such that
with the individual factors as defined in Equations (1–6). In EP, the exact posterior  is approximated by a Gaussian distribution
  , which minimizes the KL-divergence
  by matching the first two moments. As
  factorizes in potentially complicated factors
  , matching the moments of these factors can be challenging. Minka (22) proposed an algorithm, which iteratively minimizes the local divergence between the factors
  and Gaussian approximations
  . As the Gaussian distribution is closed under multiplication, the resulting approximation q is also Gaussian. This is summarized in Algorithm 1.
Algorithm 1.

EP for approximating the posterior (22)
Implementation using probabilistic programming in infer.NET
We use probabilistic programming to perform the inference within the Infer.NET framework (http://research.microsoft.com/infernet) (23). Infer.NET is a framework allowing for Bayesian inference in graphical models, which has been used successfully in the bioinformatics community in recent years (24,25). The approximation of the marginal posterior is performed by the infer.NET inference engine. The main advantage is that it is straightforward to specify different models of gene responses, given a common base model. Thus, changing model specification and adding additional species only requires few lines of code resulting in a fast and flexible framework for Bayesian gene set analysis.
Evaluation of performance using synthetic data
Realistic synthetic data generated for the single species and the cooperative model were sampled from genome-wide yeast genes mapped to GO (10) (retrieved October 2012). We used the Bioconductor package org.Sc.sgd.db (http://www.bioconductor.org/packages/release/data/annotation/html/org.Sc.sgd.db.html), which annotated 3890 terms to 6396 genes. Realistic data for the inhibitory model were generated by sampling from hgu133plus2.db (http://www.bioconductor.org/packages/release/data/annotation/html/hgu133plus2.db.html) for Affymetrix human genome annotations where 14 740 genes are annotated with 10 944 terms. We randomly selected 3–6 independent terms to be active in each data set. We sampled the corresponding observed species according to the single species, cooperative and the inhibitory model, respectively. This was done for a range of different parameter values of  ,
,  and pinh. For the single/cooperative and the inhibitory model, we generated 600 and 400 synthetic data sets with different levels of observation noise, respectively. More specifically, for the single-species model and the cooperative model, we chose three different settings:
  and
and  ;
;  and
and  ;
;  and
and  . The inhibitory model was evaluated for four different levels of observation noise and miRNA activation:
  ,
,  and
and  ;
;  ,
, 
 and
and  ;
;  ,
,  and
and  ;
;  ,
,  and
and  .
.
We compared results of MONA to the related approaches for GO enrichment analysis, all suited for analysing single-species data. We quantified the statistical significance of differences in predictive power between the following approaches: inferring active GO terms based on (i) one species only with MGSA, (ii) one species-model of MONA and (iii) multi-level integrative method MONA. Therefore, we performed an receiver-operating-characteristic (ROC) analysis of each synthetic data set and quantified the statistical significance between two different approaches by performing a paired t-test (Bonferroni corrected) between the respective area-under-the-curve (AUC) values. In addition, we show precision-recall curves for selected models because the number of true positives is usually orders of magnitude smaller than the number of true negatives.
Although, most similar to MONA, MGSA (18) can only be applied to individual molecular levels. As MGSA is an MCMC sampling scheme for inferring marginal posteriors for the single-species model and converges to the exact solution when run long enough, we used the solutions provided by the MCMC sampling as gold standard for the single-species model. To illustrate benefits over the commonly used Fisher’s exact test for GO enrichment, where each term is tested independently, we also tested the null-hypothesis of a term being off for all terms and calculated ROC curves based on the P-values for all data sets.
For the single-species model as well as the cooperative model, we used uninformative priors for α, β and p to introduce as little bias as possible. However, when the marginals yielded an unrealistic value for P (i.e. >30% of terms being on), we repeated the inference with a weakly informative prior for p and set the shape parameters of the Beta distribution a and b to one and five, respectively, placing most of the probability mass on values <0.5 (this was necessary in ∼5% of the synthetic data sets). As we found that parameters p in the inhibitory model converged to unrealistic values more often, we always performed inference with weakly informative priors in this case.
RESULTS AND DISCUSSION
We extensively evaluated MONA on synthetic data and three integrative studies. The three biological studies encompass several molecular levels, demonstrating the applicability of MONA to any multi-omics studies.
We compare MONA to MGSA and Fisher’s exact test, where individual levels were analysed separately. For simplified comparisons, we considered a GO term to be active, if its probability exceeded 0.5. MONA ran with 30 iterations, which was sufficient to reach convergence.
Performance on synthetic data
We found that approximate inference with MONA in a single-species model yielded equally good results as the MCMC-based inference with MGSA (Figure 3) for three different noise levels. AUC values for MGSA and the single-species model of MONA were 0.932, 0.878, 0.946 and 0.922, 0.87, 0.943, respectively. We used paired t-tests to test the null-hypothesis that both inference methods result in equal performance for a given observation error rate. Resulting P-values of 0.007, 0.14 and 1 indicate that only for error rate  and
and  , the difference in AUC was significant. However, in this case, the mean difference in AUC of only 0.01 was rather small. This corresponds to an overall good quality of the EP approximation used by MONA compared with the exact inference method of the MGSA implementation.
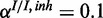
Figure 3.
Performance of the cooperative model on synthetic data for three different levels of noise: (a) medium noise ( ,
,  ), (b) high noise (
 ,
,  ) and (c) mixed noise (
 ,
,  ). AUC values are listed in the respective figure legends. With MONA, the inference is based on two species, and all other algorithms are based on one species only.
AUC curves generated by MGSA do seem to differ systematically from the ROC curves generated using single-species MONA (Figure 3): for all error rates, MGSA achieved higher true-positive rates for low FP rates. This is a consequence of systematic differences between the MCMC sampling approach and EP. For MGSA, the probability of a term being ‘on’ is restricted to 20 discrete values between 0.0002 and 0.0051 so that all models with a higher value for P have a probability of 0. In contrast, for the EP algorithm a continuous Beta prior  is used.
Furthermore, the EP approximation is designed such that it prefers broad approximations and due to this zero-avoidance can assign non-zero probabilities to models that actually have a zero probability (this is the opposite behaviour of the MCMC sampling approach, which assigns zero probability to all models with  , some of which actually may have a non-zero probability). Consequently, MGSA should be used instead of using the approximate EP inference for a single species if only one level of observations is available. The differences in performance of the models are also illustrated via precision-recall curves (Supplementary Figures S1–S6).
When comparing the benefits of using integrated data information over individual data levels, the cooperative model yielded AUCs, which were significantly better than the performance of MGSA (P
 in all settings). Similarly, in the inhibitory setting, MONA performed significantly better than MGSA (P
 ) for low (10%), medium (25%) and high (40%) influence of miRNA activation (Figure 4). As expected, the benefit of including knowledge on the second species was greatest for the setting with high miRNA influence. In this setting also, the benefit of the model-based single-species approach over the Fisher test was smallest.
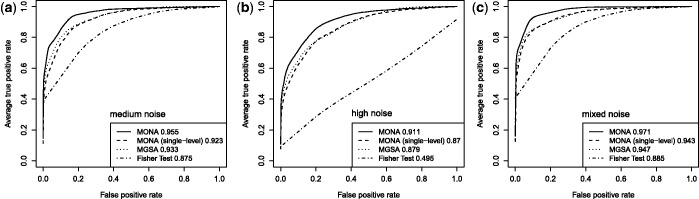
Figure 4.
Performance of the inhibitory model on synthetic data for three different levels of miRNA activation and two different noise levels: (a) medium noise levels, medium miRNA influence ( ,
,  ,
,  ), (b) medium noise levels, high miRNA influence (
 ,
,  ,
,  ), (c) mixed noise levels, medium miRNA influence (
 ,
,  ,
,  ) and (d) mixed noise levels, low miRNA influence (
 ,
,  ,
,  ). AUC values are listed in the respective figure legends. With MONA, the inference is based on two species, and all other algorithms are based on one species only.
Run time
For evaluating run times, we applied MONA (here, the cooperative model), MONA on single-species level and MGSA on the synthetic data described earlier in the text and repeated this procedure 10 times. MGSA took 192.59 s on average ( ) to compute the results, whereas MONA and single-level MONA took 8.45 and 6.96 s on average, respectively (
 ;
;  ). MONA has a considerable gain of run time performance. MONA had only a slight increase in run time when a second species was introduced in the model.
Combining mRNA and protein expression
The induction of environmental stress to an organism leads to changes on all molecular levels to cope with the new condition. An integrative study in yeast investigated changes in the proteome and transcriptome in response to an osmotic shock by NaCl (3). The regulatory response was measured at different time points after NaCl treatment. We adopted the testing procedures for differential expression from the original study to calculate P-values of mRNAs and proteins (3). We then considered mRNA and protein as responsive to osmotic stress if their calculated P < 0.05. In addition, we applied a threshold of the absolute median fold change over time of  and
and  for mRNA and protein, respectively. Of 5916 genes and 2207 proteins annotated to a GO term, 1274 genes and 214 proteins were responding to osmotic shock.
The cooperative model is applicable to the present two-level study of gene and protein expressions (Figure 5a). Here, we assume that differential expression of a specific gene can be observed on both, mRNA and protein level. This was shown to hold especially for upregulated genes (3). However, in practice, it is possible that differential expression can only be observed in one of these species due to measurement limitations or also biological reasons [imperfect correlation between mRNA and protein expression (26)]. This is accounted for in the generative model by introducing FP and FN rates (Figure 2).
Figure 5.

Analysis of mRNAs and proteins on salt stress in yeast. (a) The cooperative model for mRNA (magenta) and protein (yellow) was used to specify the hidden gene response (green). (b) For each GO term, P-values of Fisher’s exact test on mRNA and protein level are plotted against each other. Active terms resulting from MONA are marked as dots and are colour- and size-coded by its respective MONA term probability. (c) Probabilities of terms derived from MONA and MGSA on mRNA and protein level. (d) Term probabilities plotted against the P-values of Fisher’s exact test for MGSA on mRNA and protein level. (c and d) Blue and red lines indicate probability of 0.5 and significance level of 0.05, respectively.
MONA yields probabilities for GO term for yeast response to osmotic shock, whereof we considered 19 GO terms to be active as their marginal posterior P > 0.5 (Figure 5c). Amongst those terms, five terms had a probability of one to be active.
To investigate to what extent the probability of active terms depends on the cooperative influence of mRNA and protein activity, we first calculated P-values resulting from Fisher’s exact test on mRNA and protein level separately (Figure 5b). Most of the terms that were determined as active by MONA were also significantly enriched among results of Fisher’s exact test on both mRNA and protein level. Expectedly, some terms were active with a high probability, although they were only significant on mRNA level. This indicates that MONA uses the protein information to enhance the probability of certain terms but not necessarily dependent on it.
We next examine the biological relevance of active biological functions identified by MONA (Figure 5c, green bars) starting with the most likely terms. The term ‘cellular response to oxidative stress’ (P = 1) is consistent with the original study (3), which reported the general induction of stress response genes on both, mRNA and protein, levels. Typically, there is a high overlap of genes for osmotic and oxidative stress (27), whereas the oxidative stress response is activated following the osmotic stress condition. A key gene known to be activated during this process is the oxidoreductase GRE2 (27), which is also responding in the present study on both mRNA and protein level.
Another result of the original study was the induction of genes involved in trehalose metabolism (3), which was shown to be directly linked to the yeast stress response (28). MONA identified the term ‘trehalose metabolic process’ (P = 1) in good agreement with these findings. In the same context, MONA identified the following terms: ‘energy reserve metabolic process’ ( ), ‘hexose catabolic process’ (
 ), ‘monosaccharide catabolic process’ (
 ), ‘glucose catabolic process’ (
 ), ‘alcohol catabolic process’ (
 ) and ‘glucose transport’ (
 ). In addition, the ‘respiratory electron transport chain’ term (P = 1) is active under osmotic stress conditions arising also due to the oxidative stress response. The activation of proteins involved in mitochondrial electron transport chain is crucial to counteract the production of reactive oxygen species upon salt stress (29). The activity of ‘arginine biosynthetic process’ (
 ) is also in agreement with the literature, as it has been reported to be induced during oxidative stress (30). Accordingly, the original study reported ‘amino acid biosynthesis’ as being enriched in their analyses. Interestingly, MONA identified arginine as a more a specific amino acid to be active, which offers a more detailed insight to yeast stress response to an osmotic shock.
We finally compare MONA results with MGSA on mRNA and protein level, where only four and two terms were active, respectively. Terms identified on mRNA level alone were also considered as active by MONA, but had always lower probabilities  (Figure 5c, purple bars) and were also significantly enriched among the results of Fisher’s exact test (Figure 5d).
One of the two terms identified on protein level by MGSA (Figure 5c, yellow bars) is ‘oxidation reduction process’, which was also identified by mRNA MGSA ( ) and MONA. The other active term is ‘small molecule catabolic process’ (
 ). Interestingly MONA is able to identify the more specific child-term ‘respiratory electron transport chain’, which we have shown to be in agreement with literature. Both terms were also highly enriched at Fisher’s exact test on protein level (Figure 5d).
Combined DNA methylation and mRNA expression
Although resistance of tumour cells to certain chemotherapeutic substances has been intensively investigated, the underlying mechanisms are still poorly understood. To that end, regulatory changes to cisplatin resistance in ovarian cancer cells were studied on DNA methylation and mRNA expression levels (4). As major differential effects were reported for upregulated genes, we selected over-expressed mRNA [extracted from the list of differentially regulated genes published by Li et al. (4)] and hypomethylated promoters. Hypomethylated gene promoters are considered responsive to cisplatin treatment if the log fold change after the third round of cisplatin treatment is below −0.5. GO analysis was then performed for observations of gene products comprising 776 upregulated mRNAs and 1453 hypomethylations of respective gene promoters of total 13 635 genes assigned to a GO term. This study was also analysed with MONA using the cooperative model (Figure 6a).
Figure 6.

Analysis of mRNAs and gene promoter methylation of cisplatin resistant versus parental ovarian cancer cells. (a) The cooperative model for mRNA (magenta) and methylation (orange) was used to specify the hidden gene response (green). (b) For each GO term, P-values of Fisher’s exact test on mRNA and methylation level are plotted against each other. Active terms resulting from MONA are marked as dots and are colour- and size-coded by its respective MONA term probability. (c) Probabilities of terms derived from MONA and MGSA on mRNA and methylation level. (d) Term probabilities plotted against the P-values of Fisher’s exact test for MGSA on mRNA and methylation level. (c and d) Blue and red lines indicate probability of 0.5 and significance level of 0.05, respectively.
All active terms identified by the integrative analysis of MONA (Figure 6c) were also significantly enriched by Fisher’s exact test on mRNA level (Figure 6b). In contrast, none were significantly enriched by Fisher’s exact test on methylation level only.
The original study reported that upregulated and hypomethylated genes play a role in cell cycle progression (4). The underlying general process was not identified by MONA; however, we find more specific subprocesses to be active on cisplatin treatment. Cell cycle checkpoints play the most important role in survival of cisplatin-treated cells (31). In particular, induction of cell cycle arrest at G1 or G2/M phases in response to DNA damage is affected in cisplatin-resistant cells (31). Our results reflect exactly this finding (Figure 6c), as MONA identifies not only ‘M/G1 transition of mitotic cell cycle’ (P = 1) but also ‘G2/M transition of mitotic cell cycle’ ( ). In addition, ‘regulation of exit from mitosis’ (
 ) and ‘regulation of chromosome segregation’ (P = 1) relate to the process of cell cycle arrest.
Furthermore, MONA specifically determined two GO terms ‘mismatch repair’ ( ) and ‘double-strand break repair’ (
 ) to be active that were shown to be related to cisplatin resistance (31). In the same study, DNA recombination processes, such as resolving Holliday junctions, were shown to contribute to cisplatin resistance as well (31). In agreement with that, the respective GO term DNA ‘recombination’ (
 ) was found to be active by MONA.
Also, the next term with a high probability—glycolysis (P = 1)—was previously reported to be upregulated in cisplatin resistance (32). In addition, we observe the following terms with a direct link to glycolysis: ‘monosaccharide catabolic process’ ( ), ‘hexose catabolic process’ (
 ), ‘glucose catabolic process’ (
 ) and ‘acetyl-CoA metabolic process’ (P = 1). As the latter has highest probability, we can conclude, only by applying MONA, that it plays a more important role than other glycolysis-related terms.
Furthermore, another two processes shown to be involved in cisplatin resistance were also revealed by integrative MONA: the mitochondrial respiratory chain was shown to be inhibited when cell undergo apoptosis on cisplatin treatment (33) (‘respiratory electron transport chain’,  ). Finally, cholesterol levels were shown to be increased in cisplatin-resistant cells (34) (‘cholesterol biosynthetic process’, P = 1).
Among the results of MGSA on mRNA level, only four GO terms were considered active. Two of them were not active when analysed with MONA (‘sterol biosynthetic process’,  and ‘cellular respiration’,
  ). However, MONA identified the more specific terms ‘cholesterol biosynthetic process and ‘respiratory electron transport chain’. In the literature, only the more specific terms identified by MONA are reported (33,34).
MGSA on methylation level did not yield any active term. Terms with high MONA probabilities had MGSA probabilities on methylation level close to 0 (Figure 6c). At the same time, MONA results differed considerably from mRNA MGSA results. The same trend was observed by also comparing P-values of Fisher’s exact test of mRNA and methylation level (Figure 6b). Only a small number of terms had a low P-value on both levels and closer inspection of these terms showed that these are general GO terms. Strikingly, only integration of both levels and simultaneous analysis with MONA alone yielded most relevant results.
As it is not clear from Figure 6b, how much the results generated by MONA are influenced by the combination of both, methylation and mRNA data, we illustrate these combinatorial influences in Supplementary Figure S7. We observe that there are a number of terms, which could only be identified by integrating both species simultaneously using MONA (rather than using single species MONA or MGSA). These include previously discussed terms such as ‘M/G1 transition of mitotic cell cycle’, ‘G2/M transition of mitotic cell cycle’, ‘mitotic sister chromatid segregation’, ‘mismatch repair’, ‘double-strand break repair’ and ‘regulation of exit from mitosis’.
Combined miRNA/mRNA data with inhibitory model
In contrast to the previous example, where the observed species were independent observations of the underlying gene response, we now treat the case where the observed species interact in form of inhibition. It was previously reported (35) that different cancer classes can be classified by their gene expression signatures and also by miRNA expression profiles (36). We selected class-specific markers on mRNA and miRNA level by performing a one-way ANOVA on respective expression profiles with subsequent FDR correction and considered those with adjusted P
 as differentially expressed. We considered a gene to be miRNA-regulated if one putative miRNA regulator [predictions from TargetScan (37)] was also cancer class-specific and significantly anti-correlated with its target mRNA expression. Among 8535 measured mRNAs assigned to a GO term, 3783 were specific for a certain cancer class and 917 were miRNA regulated.
Now, we use the inhibitory model for MONA to identify processes distinguishing different cancer classes on mRNA and miRNA level (Figure 7a). The inhibitory model can be interpreted such that a non-observed gene response may be compensated in the model by being currently regulated by miRNAs.
Figure 7.

Analysis of post-transcriptional fine-tuning of mRNA expression by miRNA activity across various cancer cell types. (a) The inhibitory model for mRNA (magenta) and methylation (blue) was used to specify the hidden gene response (green). Lack of observations on mRNA may be explained by miRNA activity. (b) For each GO term, P-values of Fisher’s exact test on mRNA and miRNA level are plotted against each other. Active terms resulting from MONA are marked as dots and are colour- and size-coded by its respective MONA term probability. (c) Probabilities of terms derived from MONA and MGSA on mRNA and miRNA level. (d) Term probabilities plotted against the P-values of Fisher’s exact test for MGSA on mRNA and miRNA level. (c and d) Blue and red lines indicate probability of 0.5 and significance level of 0.05, respectively.
The integrated analysis with MONA identified five terms to be active (Figure 7c). By comparing the unadjusted P-values of active terms on mRNA and miRNA level, we observed that three active term are significantly enriched on both, mRNA and miRNA level (Figure 7b and c, ‘actin cytoskeleton organization’,  , ‘actin filament-based process’,
  and ‘regulation of signal transduction’,
  ). The top ranked terms ‘cell adhesion’ (P = 1) and ‘biological adhesion’ (
 ) were significantly enriched on mRNA level and at least higher enriched on miRNA level than expected by chance, although just above 0.05. Both terms mostly consist of the same set of genes; therefore, algorithms identify both terms with comparable probabilities to be active. Interestingly, all active processes identified by MONA were shown to contribute to invasive cell migration, which is a key mechanism in dissemination of cancer cells during metastasis (38). We can therefore conclude that only MONA was able to identify facets of invasive tumour migration as a distinctive feature of different tumour classes on mRNA and miRNA level.
MGSA at mRNA level resulted in only the term ‘response to steroid hormone stimulus’ to be active (Figure 7c). This process can discriminate different tumour classes. However, it is too unspecific to describe the affected mechanisms well. Only few terms had non-zero probabilities in MGSA, although they were significantly enriched by Fisher’s exact test (Figure 7d). This indicates that no process was consistently affected on mRNA level only.
Standard enrichment methods at miRNA level only consider all target genes of miRNAs. MGSA on miRNA (targets) yielded two active terms ‘nervous system development’ ( ) and ‘protein modification process’ (
 ). For both, Fisher’s exact test P-values were only borderline significant (Figure 7d), whereas many terms had lower P-values. A larger number of specific processes seemed to be affected by miRNA regulation. Terms identified by MGSA on miRNA level were again general and a literature search suggested them to be unrelated to cancer-specific processes. Our integrated approach, in contrast, revealed processes that are known to be specifically related to the behavior of different tumour classes.
CONCLUSION AND OUTLOOK
It is well known that a set of cellular processes is differently active among cells in different conditions. These conditions can be induced by an external stimulus but can also arise from different cell types or tissues. The activation of a certain cellular process in turn implies the induction of a specific set of genes. We therefore expect that if a cellular process is active, the corresponding genes also respond to the condition. However, ‘gene response’ is an abstract term, and we may observe it differently on different levels (e.g. mRNA, protein, methylation). Hence, we integrate gene response as latent variable in multi-omics observations. This concept is represented as a Bayesian network in MONA (Figure 2).
The models introduced here plugged to the base model are only a subset of possible models. Although we have introduced a cooperative and inhibitory model separately plugged to the hidden gene response, MONA allows us to easily couple both models or even add more observation levels. For example, available miRNA-mRNA data can be used in parallel to, for example, protein data. Likewise, methylation, mRNA and protein levels can be inferred simultaneously with a cooperative model with three observations. This simply corresponds to an additional node in the observation layer (Figure 2b). In addition, the design allows us to implement additional models to simultaneously capture different molecular levels (Figure 1). For example, when measuring proteins and the metabolome of cells, we may introduce third ‘activating’ model, where, for example, an existing metabolite may have an activating (unlike an inhibiting) effect on a proteins activity. Protein phosphorylation levels may also serve as activating evidence of a proteins function. Even complex gene interactions may be a basis for a model that could be plugged to the hidden gene response. The development of more and more powerful techniques for the inference of gene interactions (39) leads to a comprehensive and reliable knowledge of gene regulation and may improve the outcome of the MONA algorithm. Another improvement could also be achieved by introducing a weighted variant of MONA. Here, the magnitude of the fold change between different conditions could be considered to infer the hidden gene response.
The ontology used in MONA is not exclusively tailored to GO but may also be applied to ontologies like KEGG pathways (11) or even disease phenotypes (40). In summary, our novel framework for gene set analysis provides three major features: First, it can handle an arbitrary number of different molecular species. Second, MONA is able to overcome typical problems with redundancies in standard GO analysis, which is a major problem in functional analysis. Finally, MONA is flexible in defining the underlying model describing the gene response to different conditions.
SUPPLEMENTARY DATA
Supplementary Data are available at NAR Online, including [41,42].
FUNDING
The European Research Council [Latent Causes: 259294]; the Deutsche Forschungsgemeinschaft [InKoMBio: SPP 1395]; and the Federal Ministry of Education and Research [GerontoSys: FKZ 0315576C; Virtual Liver: FKZ 0315752]. Funding for open access charge: Helmholtz Zentrum München, Deutsches Forschungszentrum für Gesundheit und Umwelt (GmbH).
Conflict of interest statement. None declared.
Supplementary Material
REFERENCES
- 1.Hunter T. Signaling–2000 and beyond. Cell. 2000;100:113–127. doi: 10.1016/s0092-8674(00)81688-8. [DOI] [PubMed] [Google Scholar]
- 2.Gilman SR, Chang J, Xu B, Bawa TS, Gogos JA, Karayiorgou M, Vitkup D. Diverse types of genetic variation converge on functional gene networks involved in schizophrenia. Nat. Neurosci. 2012;15:1723–1728. doi: 10.1038/nn.3261. [DOI] [PMC free article] [PubMed] [Google Scholar]
- 3.Lee MV, Topper SE, Hubler SL, Hose J, Wenger CD, Coon JJ, Gasch AP. A dynamic model of proteome changes reveals new roles for transcript alteration in yeast. Mol. Syst. Biol. 2011;7:1–12. doi: 10.1038/msb.2011.48. [DOI] [PMC free article] [PubMed] [Google Scholar]
- 4.Li M, Balch C, Montgomery JS, Jeong M, Chung JH, Yan P, Huang TH, Kim S, Nephew KP. Integrated analysis of DNA methylation and gene expression reveals specific signaling pathways associated with platinum resistance in ovarian cancer. BMC Med. Genomics. 2009;2:34. doi: 10.1186/1755-8794-2-34. [DOI] [PMC free article] [PubMed] [Google Scholar]
- 5.Hartsperger ML, Blöchl F, Stümpflen V, Theis FJ. Structuring heterogeneous biological information using fuzzy clustering of k-partite graphs. BMC Bioinformatics. 2010;11:522. doi: 10.1186/1471-2105-11-522. [DOI] [PMC free article] [PubMed] [Google Scholar]
- 6.Jeong J, Li L, Liu Y, Nephew KP, Huang THM, Shen C. An empirical Bayes model for gene expression and methylation profiles in antiestrogen resistant breast cancer. BMC Med. Genomics. 2010;3:55. doi: 10.1186/1755-8794-3-55. [DOI] [PMC free article] [PubMed] [Google Scholar]
- 7.Zacher B, Abnaof K, Gade S, Younesi E, Tresch A, Fröhlich H. Joint Bayesian inference of condition-specific miRNA and transcription factor activities from combined gene and microRNA expression data. Bioinformatics. 2012;28:1714–1720. doi: 10.1093/bioinformatics/bts257. [DOI] [PubMed] [Google Scholar]
- 8.Clark AG, Glanowski S, Nielsen R, Thomas PD, Kejariwal A, Todd MA, Tanenbaum DM, Civello D, Lu F, Murphy B, et al. Inferring nonneutral evolution from human-chimp-mouse orthologous gene trios. Science. 2003;302:1960–1963. doi: 10.1126/science.1088821. [DOI] [PubMed] [Google Scholar]
- 9.Mootha VK, Lepage P, Miller K, Bunkenborg J, Reich M, Hjerrild M, Delmonte T, Villeneuve A, Sladek R, Xu F, et al. Identification of a gene causing human cytochrome c oxidase deficiency by integrative genomics. Proc. Natl Acad. Sci. USA. 2003;100:605–610. doi: 10.1073/pnas.242716699. [DOI] [PMC free article] [PubMed] [Google Scholar]
- 10.Ashburner M, Ball CA, Blake JA, Botstein D, Butler H, Cherry JM, Davis AP, Dolinski K, Dwight SS, Eppig JT, et al. Gene ontology: tool for the unification of biology. Nat. Genet. 2000;25:25–29. doi: 10.1038/75556. [DOI] [PMC free article] [PubMed] [Google Scholar]
- 11.Kanehisa M, Goto S, Sato Y, Furumichi M, Tanabe M. KEGG for integration and interpretation of large-scale molecular data sets. Nucleic Acids Res. 2011;40:D109–D114. doi: 10.1093/nar/gkr988. [DOI] [PMC free article] [PubMed] [Google Scholar]
- 12.Boyle EI, Weng S, Gollub J, Jin H, Botstein D, Cherry JM, Sherlock G. GO::TermFinder–open source software for accessing Gene Ontology information and finding significantly enriched Gene Ontology terms associated with a list of genes. Bioinformatics. 2004;20:3710–3715. doi: 10.1093/bioinformatics/bth456. [DOI] [PMC free article] [PubMed] [Google Scholar]
- 13.Grossmann S, Bauer S, Robinson PN, Vingron M. Improved detection of overrepresentation of Gene-Ontology annotations with parent child analysis. Bioinformatics. 2007;23:3024–3031. doi: 10.1093/bioinformatics/btm440. [DOI] [PubMed] [Google Scholar]
- 14.Subramanian A, Tamayo P, Mootha VK, Mukherjee S, Ebert BL, Gillette MA, Paulovich A, Pomeroy SL, Golub TR, Lander ES, et al. Gene set enrichment analysis: A knowledge-based approach for interpreting genome-wide expression profiles. Proc. Natl Acad. Sci. USA. 2005;102:15545–15550. doi: 10.1073/pnas.0506580102. [DOI] [PMC free article] [PubMed] [Google Scholar]
- 15.Sass S, Dietmann S, Burk UC, Brabletz S, Lutter D, Kowarsch A, Mayer KF, Brabletz T, Ruepp A, Theis FJ, et al. MicroRNAs coordinately regulate protein complexes. BMC Syst. Biol. 2011;5:136. doi: 10.1186/1752-0509-5-136. [DOI] [PMC free article] [PubMed] [Google Scholar]
- 16.Kowarsch A, Preusse M, Marr C, Theis FJ. miTALOS: Analyzing the tissue-specific regulation of signaling pathways by human and mouse microRNAs. RNA. 2011;17:809–819. doi: 10.1261/rna.2474511. [DOI] [PMC free article] [PubMed] [Google Scholar]
- 17.Lu Y, Rosenfeld R, Simon I, Nau GJ, Bar-Joseph Z. A probabilistic generative model for GO enrichment analysis. Nucleic Acids Res. 2008;36:e109. doi: 10.1093/nar/gkn434. [DOI] [PMC free article] [PubMed] [Google Scholar]
- 18.Bauer S, Gagneur J, Robinson PN. GOing bayesian: model-based gene set analysis of genome-scale data. Nucleic Acids Res. 2010;38:3523–3532. doi: 10.1093/nar/gkq045. [DOI] [PMC free article] [PubMed] [Google Scholar]
- 19.Thomas PD, Mi H, Swan GE, Lerman C, Benowitz N, Tyndale RF, Bergen AW, Conti DV Pharmacogenetics of Nicotine Addiction and Treatment Consortium. A systems biology network model for genetic association studies of nicotine addiction and treatment. Pharmacogenet. Genomics. 2009;19:538–551. doi: 10.1097/FPC.0b013e32832e2ced. [DOI] [PMC free article] [PubMed] [Google Scholar]
- 20.Cox J, Mann M. 1D and 2D annotation enrichment: a statistical method integrating quantitative proteomics with complementary high-throughput data. BMC Bioinformatics. 2012;13(Suppl. 16):S12. doi: 10.1186/1471-2105-13-S16-S12. [DOI] [PMC free article] [PubMed] [Google Scholar]
- 21.Bishop CM. Pattern Recognition and Machine Learning (Information Science and Statistics) New York, USA: Springer; 2006. [Google Scholar]
- 22.Minka TP. Proceedings of the 17th Conference in Uncertainty in Artificial Intelligence. Morgan Kaufmann Publishers Inc; 2001. Expectation Propagation for approximate Bayesian inference. UAI’01, San Francisco, CA, pp. 362–369. [Google Scholar]
- 23.Minka T, Winn J, Guiver J, Knowles D. Infer.NET 2.5. Cambridge, UK: Microsoft Research; 2012. [Google Scholar]
- 24.Parts L, Stegle O, Winn J, Durbin R. Joint genetic analysis of gene expression data with inferred cellular phenotypes. PLoS Genet. 2011;7:e1001276. doi: 10.1371/journal.pgen.1001276. [DOI] [PMC free article] [PubMed] [Google Scholar]
- 25.Simpson A, Tan VY, Winn J, Svensn M, Bishop CM, Heckerman DE, Buchan I, Custovic A. Beyond atopy: multiple patterns of sensitization in relation to asthma in a birth cohort study. Am. J. Respir. Crit. Care Med. 2010;181:1200–1206. doi: 10.1164/rccm.200907-1101OC. [DOI] [PubMed] [Google Scholar]
- 26.de Godoy LMF, Olsen JV, Cox J, Nielsen ML, Hubner NC, Frhlich F, Walther TC, Mann M. Comprehensive mass-spectrometry-based proteome quantification of haploid versus diploid yeast. Nature. 2008;455:1251–1254. doi: 10.1038/nature07341. [DOI] [PubMed] [Google Scholar]
- 27.Rep M, Proft M, Remize F, Tams M, Serrano R, Thevelein JM, Hohmann S. The Saccharomyces cerevisiae Sko1p transcription factor mediates HOG pathway-dependent osmotic regulation of a set of genes encoding enzymes implicated in protection from oxidative damage. Mol. Microbiol. 2001;40:1067–1083. doi: 10.1046/j.1365-2958.2001.02384.x. [DOI] [PubMed] [Google Scholar]
- 28.Hohmann S. Osmotic stress signaling and osmoadaptation in yeasts. Microbiol. Mol. Biol. Rev. 2002;66:300–372. doi: 10.1128/MMBR.66.2.300-372.2002. [DOI] [PMC free article] [PubMed] [Google Scholar]
- 29.Pastor MM, Proft M, Pascual-Ahuir A. Mitochondrial function is an inducible determinant of osmotic stress adaptation in yeast. J. Biol. Chem. 2009;284:30307–30317. doi: 10.1074/jbc.M109.050682. [DOI] [PMC free article] [PubMed] [Google Scholar]
- 30.Nishimura A, Kotani T, Sasano Y, Takagi H. An antioxidative mechanism mediated by the yeast N-acetyltransferase Mpr1: oxidative stress-induced arginine synthesis and its physiological role. FEMS Yeast Res. 2010;10:687–698. doi: 10.1111/j.1567-1364.2010.00650.x. [DOI] [PubMed] [Google Scholar]
- 31.Kartalou M, Essigmann JM. Mechanisms of resistance to cisplatin. Mutat. Res. 2001;478:23–43. doi: 10.1016/s0027-5107(01)00141-5. [DOI] [PubMed] [Google Scholar]
- 32.Loar P, Wahl H, Kshirsagar M, Gossner G, Griffith K, Liu JR. Inhibition of glycolysis enhances cisplatin-induced apoptosis in ovarian cancer cells. Am. J. Obstet. Gynecol. 2010;202 doi: 10.1016/j.ajog.2009.10.883. 371.e1–e8. [DOI] [PubMed] [Google Scholar]
- 33.Schwerdt G, Freudinger R, Schuster C, Weber F, Thews O, Gekle M. Cisplatin-induced apoptosis is enhanced by hypoxia and by inhibition of mitochondria in renal collecting duct cells. Toxicol. Sci. 2005;85:735–742. doi: 10.1093/toxsci/kfi117. [DOI] [PubMed] [Google Scholar]
- 34.Todor IN, Lukianova NY, Chekhun VF. The lipid content of Cisplatin- and Doxorubicin-resistant mcf-7 human breast cancer cells. Exp. Oncol. 2012;34:97–100. [PubMed] [Google Scholar]
- 35.Ramaswamy S, Tamayo P, Rifkin R, Mukherjee S, Yeang C-H, Angelo M, Ladd C, Reich M, Latulippe E, Mesirov JP, et al. Multiclass cancer diagnosis using tumor gene expression signatures. Proc. Natl Acad. Sci. USA. 2001;98:15149–15154. doi: 10.1073/pnas.211566398. [DOI] [PMC free article] [PubMed] [Google Scholar]
- 36.Lu J, Getz G, Miska EA, Alvarez-Saavedra E, Lamb J, Peck D, Sweet-Cordero A, Ebert BL, Mak RH, Ferrando AA, et al. MicroRNA expression profiles classify human cancers. Nature. 2005;435:834–838. doi: 10.1038/nature03702. [DOI] [PubMed] [Google Scholar]
- 37.Lewis BP, Burge CB, Bartel DP. Conserved seed pairing, often flanked by adenosines, indicates that thousands of human genes are MicroRNA targets. Cell. 2005;120:15–20. doi: 10.1016/j.cell.2004.12.035. [DOI] [PubMed] [Google Scholar]
- 38.Linder S, Wiesner C, Himmel M. Degrading devices: invadosomes in proteolytic cell invasion. Annu. Rev. Cell Dev. Biol. 2011;27:185–211. doi: 10.1146/annurev-cellbio-092910-154216. [DOI] [PubMed] [Google Scholar]
- 39.Prill RJ, Marbach D, Saez-Rodriguez J, Sorger PK, Alexopoulos LG, Xue X, Clarke ND, Altan-Bonnet G, Stolovitzky G. Towards a rigorous assessment of systems biology models: the DREAM3 challenges. PLoS One. 2010;5:e9202. doi: 10.1371/journal.pone.0009202. [DOI] [PMC free article] [PubMed] [Google Scholar]
- 40.Ruepp A, Kowarsch A, Schmidl D, Bruggenthin F, Brauner B, Dunger I, Fobo G, Frishman G, Montrone C, Theis FJ. PhenomiR: a knowledgebase for microRNA expression in diseases and biological processes. Genome Biol. 2010;11:R6. doi: 10.1186/gb-2010-11-1-r6. [DOI] [PMC free article] [PubMed] [Google Scholar]
- 41.Demšar J. Statistical comparisons of classifiers over multiple data sets. J. Mach. Learn. Res. 2006;7:1–30. [Google Scholar]
- 42.Dietterich TG. Approximate statistical tests for comparing supervised classification learning algorithms. Neural Comp. 1998;10:1895–1923. doi: 10.1162/089976698300017197. [DOI] [PubMed] [Google Scholar]
Associated Data
This section collects any data citations, data availability statements, or supplementary materials included in this article.