

Abstract
Iron is an essential metal for living organisms, but misregulation of its homeostasis at the cellular level can trigger detrimental oxidative and/or nitrosative stress and damage events. Motivated to help study the physiological and pathological consequences of biological iron regulation, we now report a reaction-based strategy for monitoring labile Fe2+ pools in aqueous solution and in living cells. Iron Probe 1 (IP1) exploits a bioinspired, iron-mediated oxidative C–O bond cleavage reaction to achieve a selective turn-on response to Fe2+ over a range of cellular metal ions in their bioavailable forms. We show that this first-generation chemical tool for fluorescence Fe2+ detection can visualize changes in exchangeable iron stores in living cells upon iron supplementation or depletion, including labile iron pools at endogenous, basal levels. Moreover, IP1 can be used to identify reversible expansion of labile iron pools by stimulation with vitamin C or the iron regulatory hormone hepcidin, providing a starting point for further investigations of iron signaling and stress events in living systems as well as future probe development.
INTRODUCTION
Iron is a required metal nutrient for life and is the most abundant transition metal in the human body.1–5 In particular, potent redox capacity of iron, mainly in its ferrous (Fe2+) and ferric (Fe3+) forms, is utilized for a wide array of physiological functions ranging from O2 binding and transport to electron transfer to catalysis. However, this same redox potency can also trigger damage to biological macromolecules and metabolites if cellular iron homeostasis is compromised.6–9
The central importance of iron in biological systems provides a compelling need for new methods to track biological iron pools, particularly in exchangeable, labile forms, to help assess the contributions of this metal to healthy and diseased states. In this regard, molecular imaging with iron-responsive fluorescent probes can potentially provide a convenient and effective means to study bioavailable iron in living specimens.10–15 However, the field of iron-responsive fluorescent indicators for living biological samples remains underdeveloped owing to significant challenges in overcoming issues of metal selectivity, specificity for different oxidation and spin states, and potent fluorescence quenching by iron in its open-shell forms, all while maintaining biocompatibility.10,11 Moreover, the reducing environment of the cell and the greater aqueous solubility of Fe2+ versus Fe3+ presages that the ferrous state may be more relevant for assaying labile iron pools.16–18 As such, the vast majority of reported fluorogenic probes for iron imaging in living cells operate through a turn-off response,10,11,14,17,19–25 including the commercially available reagents Phen Green SK17,24 and calcein19, which limits spatial resolution. There are few examples of turn-on Fe3+ sensors that have been applied to cells,26–32 and Fe2+ fluorescent probes are even more rare. Indeed, only recently has one turn-on fluorescent probe for Fe2+ in cells based on an elegant N-oxide reduction been described,33 and no endogenous biological stimulations were reported in this initial work.
In this report, we present the design, synthesis, characterization, and biological applications of Iron Probe 1 (IP1), a new type of reaction-based turn-on fluorescent probe for monitoring exchangeable Fe2+ pools in aqueous solution and in living cells. Using a bioinspired Fe2+- and O2-dependent C-O cleavage reaction to release a fluorescent dye product, IP1 features visible excitation and emission profiles, and the dual requirement of metal coordination and bond-breaking reactivity promotes selectivity for Fe2+ over a range of cellularly relevant metal ions in their bioavailable forms. We demonstrate the utility of IP1 in biological settings by showing that this probe can detect changes in exchangeable iron stores in living cells upon iron supplementation or depletion. Moreover, this first-generation probe is capable of imaging endogenous, basal labile iron pools and their expansion by vitamin C or the iron regulatory hormone hepcidin, providing a unique tool that has the capacity to monitor changes in natural cellular iron stores.
RESULTS and DISCUSSION
Design and Synthesis of IP1
Our design strategy for turn-on detection of Fe2+ relies on a reaction-based approach in which a selective but transient Fe2+-triggered bond-cleavage reaction converts a weakly fluorescent caged probe into a highly fluorescent product.15,34–38 Inspired by the diverse range of oxidative chemical transformations catalyzed by iron centers in biology within heme P450 and mononuclear non-heme enzymes and models,39–46 we decided to exploit a biomimetic oxidation strategy for the design of new fluorescent iron probes. Specifically, we sought to construct a fluorophore caged with a biomimetic ligand that can be cleaved by a Fe2+-mediated oxygenation reaction. Indeed, recent work from Taki47 as well as from our laboratory48 show that reaction-based probes exploiting such biomimetic oxidative cleavage can be used to selectively detect Cu+ and Co2+, respectively, in live-cell settings (Scheme 1), and work by Kodanko 49 and Nam50,51 have shown biomimetic oxidations for catalysis and sensing purposes.
Scheme 1.

Design of Iron Probe 1 (IP1), a reaction-based probe for Fe2+ featuring a biomimetic, oxidative bond-cleavage reaction. IP1 contains an expanded mimic of a mononuclear non-heme 2-His-1-carboxylate coordination motif with an open sixth apical site for O2 activation.
Unlike traditional molecular recognition approaches where metal selectivity is solely based on preferential coordination of the target metal with a particular ligand, the reaction-based strategy adds an extra selectivity filter besides coordination to distinguish Fe2+ from other 3d metal ions, which are similar in size and charge, as both the geometry and electronic structure of the metal complex have to be matched with the chemical reactivity in order to result in the bond breaking reaction. Also, this reaction-based strategy separates the metal and the fluorophore after the bond cleavage reaction, circumventing the problem of fluorescence quenching by the paramagnetic metal ions, and thus allowing turn-on detection that improves spatial resolution. Moreover, since the biomimetic ligand can be modularly coupled to different fluorophores or reporter groups, it allows versatile modification of the photophysical properties of the sensors to better suit the specific need of a particular imaging experiment.
IP1 was synthesized according to Scheme 2. To promote selective iron reactivity, we designed a pentadentate N4O ligand to mimic the 2-His-1-carboxylate facial triad commonly found in the active sites of O2-activating mononuclear non-heme iron enzymes.44–46 The N4O ligand 3 was coupled onto the reduced fluorescein alcohol derivative 4, disrupting conjugation of the fused rings and thus giving the non-fluorescent IP1 (Scheme 2). Notably, precursor 3 allows for facile incorporation of the Fe2+-responsive unit to other fluorescent scaffolds and imaging modalities via a simple nucleophilic substitution reaction.
Scheme 2.

Synthesis of IP1
To better understand the coordination of Fe2+ to the N4O motif, a model ligand 6 and its Fe2+ complex were synthesized (Scheme 3). The neutral mononuclear Fe2+ complex 6-FeCl was prepared by reaction of 6 with FeCl2 and K2CO3 in MeCN. A single crystal was obtained from slow evaporation of a MeCN solution of the complex. As anticipated, the Fe2+ center is coordinated by the pentadentate ligand in a distorted octahedral geometry, with a chloride ligand occupying the apical position (Scheme 3). The Fe–Npy and Fe–ORCOO distances are comparable to related N3O2 pyridine-carboxylate Fe2+ complexes.52 Moreover, FT-IR analysis of the complex in solid state showed absorptions at 1600 cm−1 and 1360 cm−1, which are assigned to the symmetric and asymmetric vibrations of the carboxylate ligand, while the 1H NMR spectrum of 6-FeCl (CD3CN, 298 K, 400 MHz) showed paramagnetically shifted resonances comparable to similar S=2 Fe2+ complexes.51 The relatively simple spectrum suggests the mononuclear structure persists in solution, which is also supported by the detection of the [M+H]+ peak at m/z 425.0 by ESI-MS. The UV-Vis spectrum of the Fe2+ complex showed two absorptions at λ = 404 nm (ε = 390 cm−1 M−1) and λ = 496 nm (ε = 360 cm−1 M−1), similar to other mononuclear, high-spin Fe2+ complexes supported by related N3O2 pyridine-carboxylate ligands.52
Scheme 3.
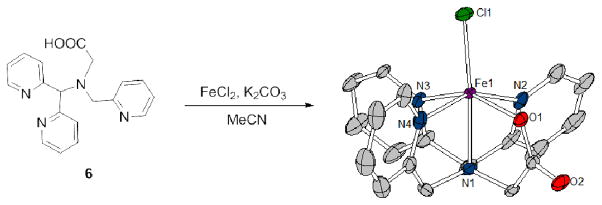
Synthesis of 6-FeCl (30% thermal ellipsoids). Selected bond parameters: Fe1–N1 2.229(4), Fe1–N2 2.214(5), Fe1–N3 2.198(4), Fe1–N4 2.166(5), Fe1–O1 2.116(3), Fe1–Cl1 2.301(2), N1–Fe1–Cl1 175.07(11), N2–Fe1–N4 153.04(19), N3–Fe1–O1 152.94(16)
Fe2+ Reactivity and Metal Ion Selectivity of IP1
Spectroscopic evaluation of IP1 was performed in aqueous buffer (50 mM Tris, pH 7.6) in the presence of 5 mM glutathione to mimic the reducing intracellular environment. As expected, a 1 μM solution of IP1 is weakly fluorescent, and addition of 20 equiv of Fe2+ leads to a 6-fold emission turn-on response within one hour of reaction (Fig. 1).53 In addition to these spectral signatures, release of the fluorophore 4 upon reaction of IP1 with Fe2+ was directly identified by ESI-MS, showing the dye product at m/z 333.0, whereas the peak at m/z 449.0 suggests the ligand has been oxidized to form the iron complex [Fe(L-COO)]+ (Fig. S1). Furthermore, no significant emission increase was observed when IP1 was treated with Fe2+ under anaerobic conditions, nor when IP1 was treated with 100 equivalents of various ROS, confirming the requirement of O2 in the C–O bond cleavage reaction and that it is Fe2+-mediated (Fig. S2 and S3). A detailed mechanism of the bond cleavage reaction is yet to be determined, but it presumably involves high-valent iron species analogous to those found in the non-heme iron systems.44–46 We were unable to further characterize intermediates of this O2-dependent process, as no significant changes in spectral features above 400 nm were observed upon reaction of an acetonitrile solution of the model compound 6-FeCl with O2 at temperatures ranging from −40 to 25°C.
Figure 1.
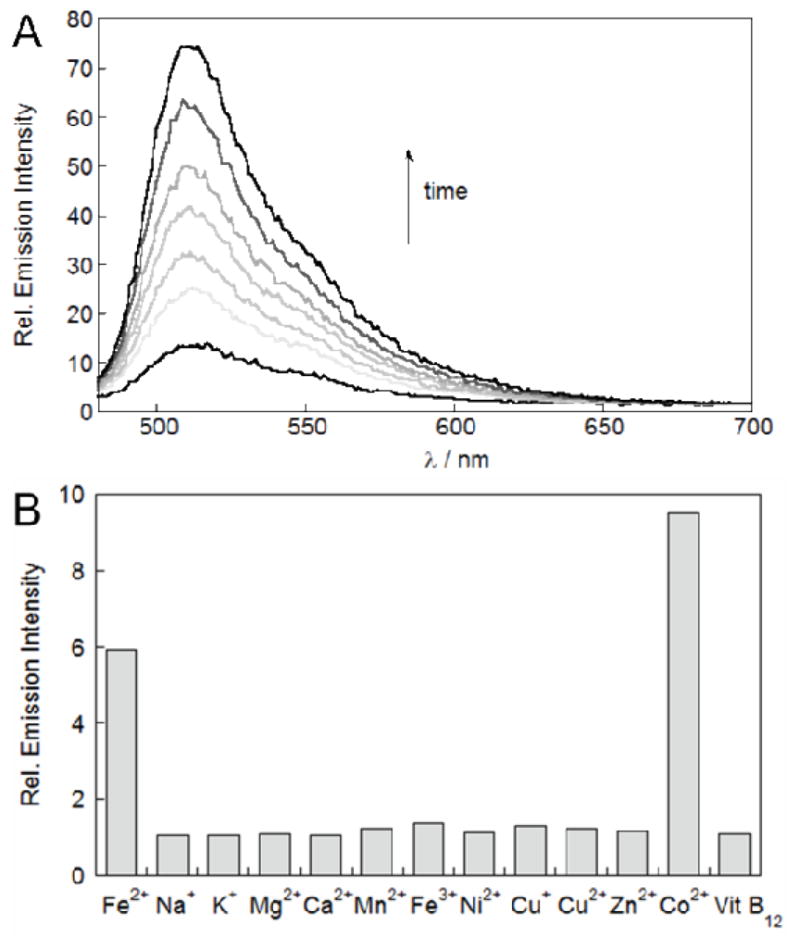
Fluorescence response of 1 μM IP1 (50 mM Tris, pH 7.6, 5 mM GSH) with λex = 470 nm. (A) Emission spectra collected after reaction with 20 μM Fe2+ at time = 0 (bottom black trace), 10, 20, 30, 40, 50 and 60 (top black trace) min. (B) Relative emission intensity at 508 nm after 1-hour reaction with various s-block (1 mM) and d-block (20 μM) metals as well as vitamin B12 (20 μM).
The fluorescence turn-on response of IP1 is selective for Fe2+ over abundant cellular alkali and alkaline earth metal ions, like Na+, K+, Mg2+, and Ca2+, as well as other biologically relevant 3d metal ions like Mn2+, Ni2+, Cu+, Cu2+, and Zn2+ (Fig. 1). In addition, IP1 shows redox selectivity for Fe2+ over Fe3+. Of the 3d transition metal series, only Co2+ at high concentrations can also give a turn-on response; however, ionic Co2+ at these levels is not physiologically relevant within mammalian systems.54 As an additional control experiment, we therefore tested the fluorescence response of IP1 towards cobalamin (vitamin B12), which is the dominant form of cobalt in mammalian systems under physiological conditions.55 As expected, because the cobalt ion in cobalamin is tightly bound, no change in emission of IP1 was observed after reaction with 20 μM cobalamin, a level which is 20-fold above the maximum limit found in the human body.55 In addition to cobalamin, the fluorescence response of IP1 toward Fe2+ in the presence of various concentrations of Co2+ and Zn2+ was also evaluated under conditions that mimic cellular overload of these metal (Fig. S4 and S5). We discovered that in the presence of Co2+ up to 10% relative to Fe2+, a concentration far higher than the total available cobalt in a cell, did not result in a further enhancement of the fluorescence signal compared to just Fe2+ alone, showing that the presence of labile cobalt, if any, would not result in a false positive fluorescence enhancement when cells are imaged with IP1.56 The presence of Zn2+ attenuates the fluorescence enhancement from IP1 by Fe2+ only at relatively high concentrations (a 30% decrease at 10 μM Zn2+). For most mammalian and down to microbial/yeast cell types, labile zinc concentrations are in the femtomolar to nanomolar range which is many orders of magnitude less than the concentrations used in these in vitro experiments.
Cellular Evaluation of IP1 for Imaging Labile Iron Pools
We next established the ability of IP1 to detect changes in exchangeable, labile iron pools within living cells. We chose a liver cell line model, HepG2/C3A, as the liver is a major iron storage organ in the body.57 To improve cellular loading, IP1 was masked as an acetoxymethyl ester58–61 and IP1-AM was employed in all cellular imaging studies. First, we tested if IP1 can detect exogenously elevated levels of labile iron in live HepG2/C3A cells. To this end, HepG2/C3A cells were supplemented with 100 μM ferrous ammonium sulfate (FAS) for 20 hours and then stained with 20 μM IP1-AM staining for an additional 2 hours. As shown in Fig. 2B, a significant increase in intracellular fluorescence in iron-supplemented cells compared to control cells was observed (Fig. 2A). To verify that the fluorescence increase was due to iron-dependent events, the iron-enriched cells were treated with 50 μM of the clinically-used iron chelator desferoxamine (DFO) for 40 minutes to reduce intracellular levels of labile iron. As expected, DFO chelation attenuated cellular fluorescence (Fig. 2c), establishing that the observed fluorescence increase was indeed correlated to elevated levels of exchangeable Fe2+ in the iron-supplemented cells.
Figure 2.
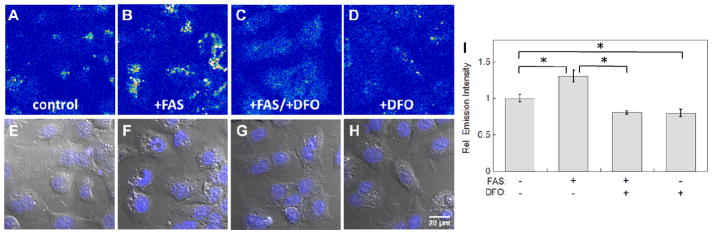
Representative confocal microscopy images of HepG2/C3A cells stained with 20 μM IP1-AM for 2 hrs. (A) Control cells. (B) Cells enriched with 100 μM ferrous ammonium sulfate (FAS) for 20 hrs. (C) Iron enriched cells treated with 50 μM DFO for 40 min. (D) Cells treated with 50 μM desferoxamine (DFO) for 40 min. (E–H) Overlays of bright field images and Hoechst stain in A–D. (I) Quantification of relative fluorescence intensity of confocal microscopy images of HepG2/C3A cells obtained under conditions A–D. Error bars are ±SD (n = 3). Statistical analysis was performed with a two-tailed Student’s t-test, *: p <0.001. Fluorescent intensity in images A–D is represented in a pseudo-color scale for better visual contrast.
With these data in hand, we next tested if IP1 could also detect labile iron pools at basal, endogenous levels within cells. Accordingly, HepG2/C3A cells were treated with 50 μM DFO for 40 minutes to produce iron-depleted specimens. Subsequent IP1-AM staining showed less fluorescent signal than untreated control samples (Fig. 2D), suggesting that IP1 is sensitive enough to image labile iron pools at endogenous, basal levels. Co-staining of IP1-AM with Lysotracker-Red showed good co-localization of fluorescence signals (Fig. S6), demonstrating the applicability of IP1-AM in the study of labile iron in the lysosome, where Fe(II) predominates due to the acidic and reducing environment and the organelle is involved in the degradation and recycling of the metal from iron containing components such as ferritin, mitochondria and endocytosed erythrocyte in macrophages.62 Finally, the cellular toxicity of IP1-AM and its products was assessed by nuclear staining with Hoechst 33342 and WST-1 assays. Both sets of control experiments confirmed that the cells were viable throughout the imaging studies (Fig. 2E–2H, S9–S11) and thus establish the suitability of IP1 for cellular imaging studies in live specimens.
Imaging Labile Iron Pools in Hepcidin-Stimulated Cells
After establishing that IP1 can reliably detect changes in labile Fe2+ pools within living cells, including exchangeable iron at endogenous, basal levels, we turned our attention to monitoring changes in cellular labile Fe2+ stores triggered by physiological stimulation. In this context, we first chose to explore the effects of hepcidin, a key iron regulatory hormone produced by the liver. Hepcidin controls iron homeostasis by regulating iron absorption in the intestine and release of the metal from hepatic stores and macrophages that recycle erythrocytes.63–65 Previous work has shown that co-incubation of iron with hepcidin triggers a greater increase in the total cellular iron pool compared to control cells supplemented with iron alone, as measured by ferritin content and 59Fe labeling, most likely due to the shutdown of the iron export pathway by degrading ferroportin.66 To test whether hepcidin stimulation can also expand the labile cellular iron pool in addition to the total cellular iron content, we used IP1-AM to image HepG2/C3A cells treated with hepcidin and/or iron. As shown in Fig. 3, we observed elevations in intracellular fluorescence in hepcidin-treated, iron-supplemented cells compared to cells supplemented with iron alone, suggesting that the labile iron pool does expand under hepcidin stimulation. Moreover, the observed IP1 fluorescence increases were attenuated by DFO chelation, showing that the fluorescence increase was due to an increase in level of labile iron. To eliminate the possibility of any cobalt-dependent fluorescence enhancements, the cells were also stained with the cobalt-specific indicator CP1 as an additional control.48 As expected, no observable differences in fluorescence between control and hepcidin-treated cells were observed, further supporting that the fluorescence enhancement in hepcidin-stimulated cells was iron-dependent and due to an increase in labile Fe2+ pool (Fig. S7 and S8). Finally, ICP-OES experiments on cell lysates independently show the cells treated with both hepcidin and FAS have more total iron compared to cells supplemented with FAS alone (Fig. S12), in agreement with the anticipated increase in total iron content after hepcidin stimulation. Taken together, the IP1 imaging data show that the iron regulatory hormone hepcidin leads not only to an increase in total cellular iron pool via ferritin storage,66 but also triggers a rise in the labile cellular iron pool.
Figure 3.
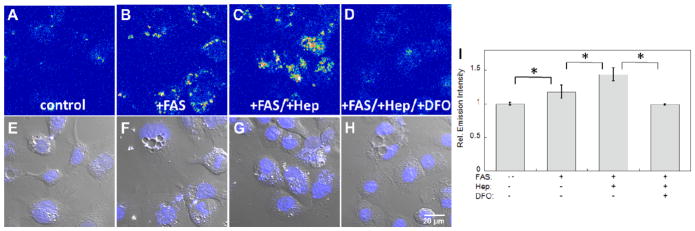
Representative confocal microscopy images of HepG2/C3A cells stained with 20 μM IP1-AM for 2 hrs. (A) Control cells. (B) Cells enriched with 100 μM ferrous ammonium sulfate (FAS) for 20 hrs. (C) Cells treated with 100 FAS for 1 hr, followed by addition of 0.5 μM hepcidin and co-incubated for a further 19 hrs. (D) Cells treated with FAS and hepcidin for 20 hrs and 19 hrs, respectively, and followed by a 40 min treatment with 50 μM desferoxamine (DFO). (E–H) Overlays of bright field images and Hoechst stain in A–D. (I) Quantification of relative fluorescence intensities of confocal microscopy images of HepG2/C3A cells obtained under conditions A–D. Error bars are ±SD (n = 3). Statistical analysis was performed with a two-tailed Student’s t-test, *: p <0.001. Fluorescent intensity in images A–D is represented in a pseudo-color scale for better visual contrast.
Imaging Labile Iron in Vitamin C-Stimulated Cells
As a second stimulation model in addition to hepcidin supplementation, we also examined the effects of ascorbic acid (vitamin C) on labile cellular iron pools. Previous work establishes that vitamin C can promote redox cycling and mobilization of iron, therefore enhancing cellular uptake of non-transferrin bound iron as well as the efficiency of iron chelation in treatment for iron overload disorders.67–70 To probe this relationship by molecular imaging, HepG2/C3A cells were stained with IP1-AM and compared to cells treated with ascorbic acid or ascorbic acid/DFO. As shown in Fig. 4, we observed a marked increase in IP1 fluorescence in vitamin C-treated cells (Fig. 4B) over untreated control samples (Fig. 4A), suggesting an expansion of labile Fe2+ pools in the presence of ascorbic acid. Moreover, the observed fluorescence increases triggered by vitamin C treatment were attenuated by DFO chelation, confirming that the fluorescence enhancement was due to an elevated level of intracellular labile Fe2+ (Fig. 4c). As an additional control experiment, no fluorescence increases in vitamin C-treated cells were observed by staining with the cobalt-sensitive dye CP1 (Fig. S7 and S8), providing further evidence for an iron-dependent effect. Interestingly, ICP-OES analyses of cell lysates show no significant difference in the levels of total iron between ascorbic acid-treated cells and control cells (Fig. S12), suggesting that the increases in intracellular fluorescence imaging observed with IP1-AM are likely due to either a mobilization of iron stores into a more labile form and/or a shift in intracellular Fe2+/Fe3+ ratio within the labile pool, rather than a global change in the total iron pool.
Figure 4.
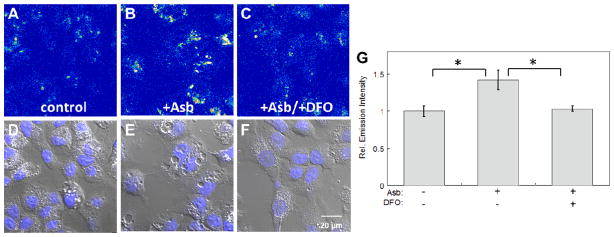
Representative confocal microscopy images of HepG2/C3A cells stained with 20 μM IP1-AM for 2 hrs. (A) Control cells. (B) Cells treated with 1 mM ascorbic acid (Asb) for 40 min. (C) Cells treated with 1 mM ascorbic acid for 40 min and then 50 μM desferoxamine (DFO) for a further 40 min. (D) Quantification of relative fluorescence intensities of confocal microscopy images of HepG2/C3A cells obtained under conditions A–C. Error bars are ±SD (n = 3). Statistical analysis was performed with a two-tailed Student’s t-test, *: p <0.001. Fluorescent intensity in images A–C is represented in a pseudo-color scale for better visual contrast.
CONCLUDING REMARKS
To summarize, we have presented the design, synthesis, spectroscopy, and molecular imaging applications of IP1, a first-generation probe for turn-on detection of Fe2+ in aqueous solution and in living cells. IP1 utilizes a bioinspired Fe2+- and O2-dependent oxidative C-O bond cleavage reaction to provide a selective and sensitive design strategy for fluorescence Fe2+ detection. Notably, the reaction-based approach described here circumvents fluorescence quenching events commonly associated with open-shell transition metal ions and allows for the selective detection of the redox-active metal in a specific oxidation state (i.e. Fe2+ over Fe3+), as well as selectivity over other s-and d-block metal ions in their bioavailable forms. IP1 is capable of being loaded into live cells and can report both increases and decreases in exchangeable iron pools upon iron supplementation and/or depletion with visible excitation and emission profiles. Moreover, this probe is sensitive enough to detect endogenous, basal labile iron pools in living cells and can identify and visualize expansions in these labile iron pools upon stimulation with either the hormone hepcidin or vitamin C, establishing a starting point for further investigations of dynamic, bioavailable iron stores in cellular iron homeostasis and their physiological and pathological consequences. Efforts to modify both the sensor and dye portions of this platform to achieve higher signal-to-noise responses, multicolor imaging, and extension to other imaging modalities, along with the application of IP1 and related chemical tools for studying the cell and animal biology of iron, are currently underway.
EXPERIMENTAL SECTION
General Methods
All solvents were of reagent grade. Acetonitrile, THF and dichloromethane (DCM) were dried by passing through activated alumina. N,N-di-iso-propylethylamine was dried by distilling over KOH. All commercially purchased chemicals were used as received. Di(2-pyridyl)methylamine 1 was synthesized according to literature procedures.71 1H and 13C NMR spectra were obtained from a Bruker AVB-400 NMR spectrometer at the College of Chemistry NMR facility at UC Berkeley. Signals were internally referenced to solvent residues. Low resolution mass spectral analyses were carried out using a LCMS (Agilent Technology 6130, Quadruploe LC/MS). High resolution mass spectral analyses (ESI-MS) were carried out at the College of Chemistry Mass Spectrometry Facility at UC Berkeley. Single-crystal X-ray diffraction was conducted at College of Chemistry X-ray crystallography facility, UC Berkeley. Crystals were mounted on nylon loops in Paratone-N hydrocarbon oil. Data integration was performed using SAINT. Preliminary data analysis and absorption correction were performed using XPREP and SADABS. Structure solution and refinement was performed using SHELX software package. The X-ray crystallographic data collection was carried out on a Bruker three-circle diffractometer mounted with a SMART 1000 detector using monochromated Mo Kα radiation (0.71073 A) outfitted with a low-temperature, N2-stream aperture, an APEXII CCD detector, and equipped with an Oxford Cryostream 700. The structure was solved using direct methods in conjunction with standard difference Fourier techniques and refined by full-matrix least-squares procedures. A semi-empirical absorption correction (SADABS) was applied to the diffraction data. All non-hydrogen atoms were refined anisotropically, and hydrogen atoms were treated as idealized contributions and refined isotropically. All software used for diffraction data processing and crystal-structure solution and refinement are contained in the APEX2 program suite (Bruker AXS, Madison, WI).
Synthesis of 2
To a THF solution of di(2-pyridyl)methylamine (2.4 g, 13 mmol, 50 ml) cooled in an ice bath was added dropwisely a solution of t-butyl bromoacetate (2.5 g, 12.8 mmol) and DIPEA (2.3 ml, 13.2 mmol) in 50 ml THF. The mixture was stirred in the melting ice bath for overnight. THF was removed by a rotary evaporator, residue dissolved in DCM (50 ml) and washed with saturated NaHCO3 (20 ml), water (20 ml) and brine (20 ml). The DCM extract was dried over Na2SO4 and evaporated to dryness. Residue was purified by basic alumina column (ethyl acetate/hexanes = 8:2). Yield = 2.5 g, 65%. 1H NMR (400 MHz, CDCl3, 298 K) δ (ppm): 8.57 (dd, J = 0.6 Hz, 4.8 Hz, 2 H), 7.62 (dt, J = 2.0 Hz, 9.6 Hz, 2H), 7.44 (d, J = 8.0 Hz, 2 H), 7.14 (ddd, J = 1.0 Hz, 4.8 Hz, 7.4 Hz, 2 H), 5.12 (s, 1 H), 3.34 (s, 2 H), 1.44 (s, 9 H). 13C{1H} NMR (100.6 MHz, CDCl3, 298 K) δ (ppm): 171.4, 161.1, 149.4, 136.8, 122.4, 81.3, 68.9, 49.9, 28.2. LRMS (ESI) calcd. for C17H22N3O2 [M+H]+ m/z: 300.2; found: 300.2.
Synthesis of 3
A mixture of 2 (0.99 g, 3.3 mmol), 2,6-dibromomethylpyridine (1.1 g, 4.0 mmol) and Cs2CO3 (1.3 g, 4.0 mmol) in 50 ml of MeCN was heated at 40 °C for overnight. Insoluble material was removed by filtration. Filtrate was concentrated and purified by basic alumina column (ethyl acetate/hexanes = 8:2 → 9:1). Yield = 0.5 g, 31%. 1H NMR (400 MHz, CD3OD, 298 K) δ (ppm): 8.44 (d, J = 0.8 Hz, 2 H), 7.84–7.75 (m, 5 H), 7.68 (d, J = 7.6 Hz, 1 H), 7.38 (d, J = 7.6 Hz, 1 H), 7.25 (ddd, J = 1.2 Hz, 4.8 Hz, 7.4 Hz, 2 H), 5.63 (s, 1 H), 4.53 (s, 2 H), 4.03 (s, 2 H), 3.34 (s, 2 H), 1.39 (s, 9 H). 13C{1H} NMR (100.6 MHz, CD3OD, 298 K) δ (ppm): 171.9, 161.1, 160.7, 157.6, 149.9, 139.3, 138.5, 125.6, 124.1, 123.7, 123.4, 82.2, 74.5, 58.3, 53.4, 33.9, 28.4. LRMS (ESI) calcd. for C24H28N4O2 79Br [M+H]+ m/z: 483.1; found: 483.2; calcd. for C24H28N4O2 81Br [M+H]+ m/z: 485.1; found: 485.2.
Synthesis of 5
A mixture of 3 (116 mg, 0.24 mmol), 4 (88 mg, 0.26 mmol) and Cs2CO3 (78 mg, 0.24 mmol) in 40 ml DMF was heated at 90 °C for overnight. DMF was removed by a rotary evaporator and residue re-dissolved in 40 ml DCM and filtered. The filtrate was concentrated and purified by basic alumina column (ethyl acetate/ hexanes = 1:1 → 100% ethyl acetate). Yield = 85 mg, 52%. 1H NMR (400 MHz, CD3OD, 298 K) δ (ppm): 8.41 (d, J = 5.2 Hz, 2 H), 7.81 (d, J = 7.2 Hz, 2 H), 7.75–7.71 (m, 3 H), 7.65 (d, J = 7.6 Hz, 1 H), 7.38–7.31 (m, 3 H), 7.22–7.16 (m, 3 H), 6.82–6.78 (m, 3 H), 6.73–6.66 (m, 3 H), 6.58 (dd, J = 2.4 Hz, 8.8 Hz, 1 H), 5.64 (s, 1 H), 5.22 (s, 2 H), 5.10 (s, 2 H), 4.05 (s, 2 H), 3.73 (s, 3 H), 3.34 (s, 2 H), 1.36 (s, 9 H). 13C{1H} NMR (100.6 MHz, CD3OD, 298 K) δ (ppm): 171.9, 161.9, 161.2, 160.5, 160.4, 157.4, 152.6, 149.9, 146.2, 140.1, 139.0, 138.5, 131.2, 131.0, 129.5, 129.3, 125.5, 124.7, 124.1, 123.5, 121.9, 121.4, 118.8, 118.1, 112.7, 112.1, 102.6, 101.3, 85.0, 82.1, 74.6, 72.9, 71.5, 58.4, 55.9, 53.4, 28.4. LRMS (ESI) calcd. for C45H43N4O6 [M+H]+ m/z: 735.3; found: 735.3.
Synthesis of Iron Probe 1 (IP1)
Compound 5 (85 mg, 0.11 mmol) was dissolved in 4 ml DCM under N2, followed by addition of TFA (0.9 ml, 12 mmol). The mixture was stirred at room temperature under N2 for overnight. Solvent and excess acid were removed by a rotary evaporator, residue was re-dissolved in DCM, washed with diluted NaHCO3 and water until pH of the aqueous phase was between 7–8. The organic component was then washed with brine and dried over Na2SO4, and DCM was removed to give the product. Yield = 74 mg, quant. 1H NMR (400 MHz, CD3OD, 298 K) δ (ppm): 8.50 (d, J = 4.8 Hz, 2 H), 7.78–7.73 (m, 3 H), 7.55 (d, J = 8.0 Hz, 2 H), 7.46–7.37 (m, 4 H), 7.32–7.28 (m, 2 H), 7.23 (t, J = 7.6 Hz, 1 H), 6.86–6.81 (m, 3 H), 6.75–6.69 (m, 3 H), 6.62 (dd, J = 2.4 Hz, 8.8 Hz, 1 H), 5.49 (s, 1 H), 5.25 (s, 2 H), 5.21 (s, 2 H), 4.22 (s, 2 H), 3.78 (s, 3 H), 3.56 (s, 2 H). 13C{1H} NMR (100.6 MHz, CDCl3, 298 K) δ (ppm): 174.0, 160.4, 159.0, 158.8, 158.3, 156.4, 151.6, 149.0, 144.9, 139.3, 138.0, 137.1, 130.1, 129.9, 128.5, 125.4, 124.5, 124.0, 123.0, 121.8, 120.8, 120.2, 117.8, 117.1, 111.7, 111.3, 101.8, 100.5, 83.6, 72.1, 71.1, 70.4, 59.3, 55.7, 55.6. HRMS (ESI) calcd. for C41H35N4O6 [M+H]+ m/z: 679.2557; found: 679.2548.
Synthesis of IP1-AM
IP1 (74 mg, 0.11 mmol) was dissolved in 10 ml DCM, and bromomethyl acetate (15 μl, 0.15 mmol) and Et3N (20 μl, 0.15 mmol) were added. The mixture was stirred at room temperature for overnight. Volatiles were removed by a rotary evaporator and residue purified by basic alumina column (ethyl acetate/hexanes = 8:2 → 100% ethyl acetate → ethyl acetate/MeOH = 8:2). Yield = 20 mg, 24%. 1H NMR (400 MHz, CD3OD, 298 K) δ (ppm): 8.43 (d, J = 4.4 Hz, 2 H), 7.80–7.76 (m, 3 H), 7.46–7.37 (m, 4 H), 7.25–7.23 (m, 2 H), 6.85–6.81 (m, 4 H), 6.79–6.77 (m, 2 H), 6.74–6.70 (m, 2 H), 6.64–6.61 (m, 2 H), 5.64 (s, 1 H), 5.26 (s, 2 H), 5.25 (s, 2 H), 5.15 (s, 2 H), 4.05 (s, 2 H), 3.80 (s, 3 H), 3.78 (s, 3 H), 3.53 (s, 3 H). 13C{1H} NMR (100.6 MHz, CD3OD, 298 K) δ (ppm): 183.1, 171.3, 162.0, 160.6, 152.8, 151.2, 150.0, 140.1, 139.4, 139.1, 138.6, 131.3, 131.1, 129.5, 129.4, 125.6, 124.7, 124.2, 122.0, 121.6, 118.0, 112.7, 112.1, 102.7, 101.3, 72.9, 67.8, 61.5, 56.0. HRMS (ESI) calcd. for C44H39N4O8 [M+H]+ m/z: 751.2768; found: 751.2761.
Fluorescence Spectroscopy
Fluorescence spectra were recorded on a Photon Technology International Quanta Master 4 L-format scanning spectrofluorometer (Lawrenceville, NJ) equipped with an LPS-220B 75-W xenon lamp and power supply, A-1010B lamp housing with an integrated igniter, switchable 814 photoncounting/ analog photomultiplier detection unit, and MD5020 motor driver. Samples for emission measurements were contained in quartz cuvette with path length of 1 cm, 1.5 ml cell volume (Starna, Atascadero, CA).
Millipore water was used to prepare all aqueous solutions. Spectroscopic measurements were performed in 50 mM Tris buffer at pH 7.6. A typical sample for fluorescence measurement of IP1 in the presence of 20 eq. of Fe2+ was prepared as follow: 1 μl of a stock solution of IP1 (1 mM in DMSO) was added to 50 mM Tris, followed by 1 μl of 20 mM Fe(NH4)2(SO4)2·6H2O and 500 μl of 10 mM glutathione (GSH) to a final volume of 1000 μl to give a solution of IP1, Fe2+ and GSH at final concentrations of 1 μM, 20 μM and 5 mM respectively. The solution was air oxidized and mixed well with a plastic disposable pipette after addition of each reagent and at 5 minutes intervals until the emission spectrum was recorded. For metal selectivity study, aqueous metal solutions of NaCl, KCl, MgCl2·6H2O, CaCl2·2H2O, MnCl2·4H2O, FeCl3·6H2O, CoCl2, NiCl2·6H2O, CuCl2·2H2O and ZnCl2 and MeCN solution of Cu(MeCN)4PF6 at 20 mM and cobalamin at 2 mM were used. For fluorescence measurement in the absence of O2, the Tris buffer was degassed by bubbling N2 for 30 minutes, and all the solutions were prepared from the degassed buffer. Excitation was at 470 nm and emission spectra were collected from 480–600 nm.
ESI-MS Product Analysis
Samples for ESI-MS analysis were prepared as followed: 20 μl of a 1 mM IP1 solution of in DMSO was added to 440 μl of 50 mM Tris at pH 7.6, followed by addition of 40 μl of a 10 mM FAS solution in the same buffer. The mixture was allowed to react for 1 hour, which was then injected into a LC-MS (Agilent Technology 6130, Quadrupole LC/MS) and analyzed by flow injection analysis.
Cell Culture and Confocal Microscopy
Cells were grown in the UC Berkeley Tissue Culturing Facility. HepG2/C3A cells were cultured in Dulbecco’s Modified Eagle Medium (DMEM, Invitrogen) supplemented with 10% fetal bovine serum (FBS, Hyclone), and incubated at 37°C in 5% CO2. One or two days before imaging, the cells were passaged and plated in phenol red-free medium on 4-well chamber slides (Corning, Corning NY), and allowed to grow to 50–70% confluence. Iron enrichment was performed in the same medium with supplementation with 100 μM FAS with equal concentration of sodium citrate for 20 hours. For cells that required hepcidin treatment, the medium was first supplemented with 100 μM FAS as described above, incubated for 1 hour, stock solution of hepcidin (AnaSpec) in MilliQ water added, and cells were co-incubated with FAS and hepcidin for a further 19 hours. DFO (Sigma Aldrich) and ascorbic acid (Sigma Aldrich) treatment were performed at the last 40 minutes of the cell culture period. Immediately before staining or DFO treatment, the cells were washed twice with 200 μM EDTA in PBS. A solution of IP1-AM in DMSO (20 mM) was diluted into DMEM at 20 μM, added to the cells and incubated for 2 hours. Before imaging, dye containing medium was removed and cells were washed twice with PBS. For nuclear staining, cells were incubated with 1 μM Hoechst at 37°C for 15 min prior to imaging.
Confocal fluorescence imaging studies were performed with a Zeiss laser scanning microscope 710 with a 40x water-immersion objective lens, with Zen 2009 software (Carl Zeiss). The dye was excited at 488 nm with an Ar laser, and emission collected using a META detector between 500 and 625 nm. Hoechst 33342 was excited with a 405 nm diode laser, and emission collected using a META detector between 410 and 490 nm. Image analysis was performed using ImageJ (National Institute of Health). For quantitative analysis of fluorescence of the confocal images, threshold of the images was set to 10, area of fluorescence was selected with the “create selection” function and fluorescent intensity of the whole image was measured.
WST-1 Assay
Cells were grown in the UC Berkeley Tissue Culturing Facility. HepG2/C3A cells were cultured in Dulbecco’s Modified Eagle Medium (DMEM, Invitrogen) supplemented with 10% fetal bovine serum (FBS, Hyclone), and incubated at 37°C in 5% CO2. Two days before the experiment, the cells were passaged and plated in phenol red-free medium on clear-bottom, black 96-well plates and allowed to grow to 100% confluence. Iron enrichment and IP1-AM treatment were performed as described for confocal microscopy experiment. At the end of the incubation period, medium was removed and the cells were washed with 200 μM EDTA and PBS. WST-1 reagent (Roche Applied Science), diluted by DMEM (1:10 v/v, 100 μM), was then added to cells and incubated for 2 hours. Absorbance at 450 nm was recorded by a plate reader.
ICP-OES
Cells were grown in the UC Berkeley Tissue Culturing Facility. HepG2/C3A cells were cultured in Dulbecco’s Modified Eagle Medium (DMEM, Invitrogen) supplemented with 10% fetal bovine serum (FBS, Hyclone), and incubated at 37°C in 5% CO2. Two days before the experiment, the cells were passaged and plated in 10 cm culture dish and allowed to grow to 100% confluence. Iron enrichment, hepcidin and ascorbate treatment were performed as described for confocal microscopy experiment. At the end of the incubation period, medium was removed and the cells were washed twice with PBS. Cells were then scraped in PBS, transferred to 15 ml Falcon tube, and re-suspended in 5 ml PBS. Aliquots of 100 μl cell suspension were transferred to 1.5 ml microtube for BCA protein assay. The cell suspension was pelleted by centrifugation, supernatant was carefully removed and the cell pellet was digested in 200 μl 70% HNO3 at 90°C for 4 hours and diluted with MilliQ water to a total volume of 5 ml. Samples were analyzed by an ICP Optima 7000 DV instrument in the Microanalytical Facility at the College of Chemistry, UC Berkeley. Iron signal was detected at 238.204 nm with an internal 10 ppm Ga standard at 417.206 nm.
Supplementary Material
Acknowledgments
This work has been supported by the NIH (GM79465), Packard Foundation, and UC Berkeley. H.Y.A. thanks the Croucher Foundation for a postdoctoral fellowship. J.C. thanks the Human Frontiers Science Program for a postdoctoral fellowship and T.C. was supported by a scholarship from the Ministry of Science, Thailand. C.J.C. is an Investigator of the Howard Hughes Medical Institute. We thank Ann Fischer and Xiaozhu Zhang (UC Berkeley Tissue Culture Facility) and Elena Kreimer (UC Berkeley College of Chemistry) for expert technical assistance.
Footnotes
Supporting Information. Experimental details, including synthesis of 4, 6, and 6-FeCl, ESI-MS spectra, ICP-OES data, and fluorescence and cell data can be found in the supporting information. This material is available free of charge via the Internet at http://pubs.acs.org.
References
- 1.Lippard SJ, Berg JM. Principles of Bioinorganic Chemistry. University Science Book; Mill Valley, California, USA: 1994. [Google Scholar]
- 2.Aisen P, Enns C, Wessling-Resnick M. Int J Biochem Cell Biol. 2001;33:940. doi: 10.1016/s1357-2725(01)00063-2. [DOI] [PubMed] [Google Scholar]
- 3.Hentze MW, Muckenthaler MU, Andrews NC. Cell. 2004;117:285. doi: 10.1016/s0092-8674(04)00343-5. [DOI] [PubMed] [Google Scholar]
- 4.Kaplan CD, Kaplan J. Chem Rev. 2009;109:4536. doi: 10.1021/cr9001676. [DOI] [PubMed] [Google Scholar]
- 5.Theil EC, Goss DJ. Chem Rev. 2009;109:4568. doi: 10.1021/cr900052g. [DOI] [PMC free article] [PubMed] [Google Scholar]
- 6.Crichton RR, Wilmet S, Legssyer R, Ward RJ. J Inorg Biochem. 2002;91:9. doi: 10.1016/s0162-0134(02)00461-0. [DOI] [PubMed] [Google Scholar]
- 7.Salahudeen AA, Bruick RK. Ann N Y Acad Sci. 2009;1177:30. doi: 10.1111/j.1749-6632.2009.05038.x. [DOI] [PMC free article] [PubMed] [Google Scholar]
- 8.Schultz IJ, Chen C, Paw BH, Hamza I. J Biol Chem. 2010;285:26753. doi: 10.1074/jbc.R110.119503. [DOI] [PMC free article] [PubMed] [Google Scholar]
- 9.Philpott CC. J Biol Chem. 2012;287:13518. doi: 10.1074/jbc.R111.326876. [DOI] [PMC free article] [PubMed] [Google Scholar]
- 10.Domaille DW, Que EL, Chang CJ. Nat Chem Bio. 2008;4:168. doi: 10.1038/nchembio.69. [DOI] [PubMed] [Google Scholar]
- 11.Que EL, Domaille DW, Chang CJ. Chem Rev. 2008;108:1517. doi: 10.1021/cr078203u. [DOI] [PubMed] [Google Scholar]
- 12.McRae R, Bagchi P, Sumalekshmy S, Fahrni CJ. Chem Rev. 2009;109:4780. doi: 10.1021/cr900223a. [DOI] [PMC free article] [PubMed] [Google Scholar]
- 13.Haas KL, Franz KJ. Chem Rev. 2009;109:4921. doi: 10.1021/cr900134a. [DOI] [PMC free article] [PubMed] [Google Scholar]
- 14.Sahoo SK, Sharma D, Bera RK, Crisponi G, Callan JF. Chem Soc Rev. 2012;41:7195. doi: 10.1039/c2cs35152h. [DOI] [PubMed] [Google Scholar]
- 15.Chan J, Dodani SC, Chang CJ. Nat Chem. 2012;4:973. doi: 10.1038/nchem.1500. [DOI] [PMC free article] [PubMed] [Google Scholar]
- 16.Breuer W, Shvartsman M, Cabantchik ZI. Int J Biochem Cell Biol. 2008;40:350. doi: 10.1016/j.biocel.2007.03.010. [DOI] [PubMed] [Google Scholar]
- 17.Petrat Fl, de Groot H, Rauen U. Biochem J. 2001;356:61. doi: 10.1042/0264-6021:3560061. [DOI] [PMC free article] [PubMed] [Google Scholar]
- 18.Richardson DR, Lane DJR, Becker EM, Huang ML-H, Whitnall M, Rahmanto YS, Sheftel AD, Ponka P. Proc Natl Acad Sci USA. 2010;107:10775. doi: 10.1073/pnas.0912925107. [DOI] [PMC free article] [PubMed] [Google Scholar]
- 19.Breuer W, Epsztejn S, Millgram P, Cabantchik IZ. Am J Physiol Cell Physiol. 1995;268:C1354. doi: 10.1152/ajpcell.1995.268.6.C1354. [DOI] [PubMed] [Google Scholar]
- 20.Petrat F, Weisheit D, Lensen M, de Groot H, Sustmann R, Rauen U. Biochem J. 2002;362:137. doi: 10.1042/0264-6021:3620137. [DOI] [PMC free article] [PubMed] [Google Scholar]
- 21.Qu X, Liu Q, Ji X, Chen H, Zhou Z, Shen Z. Chem Commun. 2012;48:4600. doi: 10.1039/c2cc31011b. [DOI] [PubMed] [Google Scholar]
- 22.Mei Q, Jiang C, Guan G, Zhang K, Liu B, Liu R, Zhang Z. Chem Commun. 2012;48:7468. doi: 10.1039/c2cc31992f. [DOI] [PubMed] [Google Scholar]
- 23.For a ratiometric, turn-off Fe(II) probe, see: Li P, Fang L, Zhou H, Zhang W, Wang X, Li N, Zhong H, Tang B. Chem Eur J. 2011;17:10520. doi: 10.1002/chem.201101327.
- 24.Petrat F, Rauen U, de Groot H. Hepatology. 1999;29:1171. doi: 10.1002/hep.510290435. [DOI] [PubMed] [Google Scholar]
- 25.Rauen U, Springer A, Weisheit D, Petrat F, Korth HG, de Groot H, Sustmann R. ChemBioChem. 2007;8:341. doi: 10.1002/cbic.200600311. [DOI] [PubMed] [Google Scholar]
- 26.Bricks JL, Kovalchuk A, Trieflinger C, Nofz M, Buschel M, Tolmachev AI, Daub J, Rurack K. J Am Chem Soc. 2005;127:13522. doi: 10.1021/ja050652t. [DOI] [PubMed] [Google Scholar]
- 27.Kennedy DP, Kormos CM, Burdette SC. J Am Chem Soc. 2009;131:8578. doi: 10.1021/ja901653u. [DOI] [PubMed] [Google Scholar]
- 28.Wang B, Hai J, Liu Z, Wang Q, Yang Z, Sun S. Angew Chem, Int Ed. 2010;49:4576. doi: 10.1002/anie.201001373. [DOI] [PubMed] [Google Scholar]
- 29.Lee MH, Giap TV, Kim SH, Lee YH, Kang C, Kim JS. Chem Commun. 2010;46:1407. doi: 10.1039/b921526c. [DOI] [PubMed] [Google Scholar]
- 30.Yang Z, She M, Yin B, Cui J, Zhang Y, Sun W, Li J, Shi Z. J Org Chem. 2012;77:1143. doi: 10.1021/jo202056t. [DOI] [PubMed] [Google Scholar]
- 31.Wang R, Yu F, Liu P, Chen L. Chem Commun. 2012;48:5310. doi: 10.1039/c2cc31426f. [DOI] [PubMed] [Google Scholar]
- 32.Wei Y, Aydin Z, Zhang Y, Liu Z, Guo M. ChemBioChem. 2012;13:1569. doi: 10.1002/cbic.201200202. [DOI] [PubMed] [Google Scholar]
- 33.Hirayama T, Okuda K, Nagasawa H. Chem Sci. 2013;4:1250. [Google Scholar]
- 34.Czarnik AW. Acc Chem Res. 1994;27:302. [Google Scholar]
- 35.Kim HN, Lee MH, Kim HJ, Kim JS, Yoon J. Chem Soc Rev. 2008;37:1465. doi: 10.1039/b802497a. [DOI] [PubMed] [Google Scholar]
- 36.Cho DG, Sessler JL. Chem Soc Rev. 2009;38:1647. doi: 10.1039/b804436h. [DOI] [PMC free article] [PubMed] [Google Scholar]
- 37.Jun ME, Roy B, Ahn KH. Chem Commun. 2011;47:7583. doi: 10.1039/c1cc00014d. [DOI] [PubMed] [Google Scholar]
- 38.Du J, Hu M, Fan J, Peng X. Chem Soc Rev. 2012;41:4511. doi: 10.1039/c2cs00004k. [DOI] [PubMed] [Google Scholar]
- 39.Ortiz de Montellano PR. Cytochrome P450: Structure, Mechamism, and Biochemistry. 3. Kluwer Academic, Plenum Publishers; New York, USA: 2005. [Google Scholar]
- 40.Groves JT. J Inorg Biochem. 2006;100:434. doi: 10.1016/j.jinorgbio.2006.01.012. [DOI] [PubMed] [Google Scholar]
- 41.Nam W. Acc Chem Res. 2007;40:522. doi: 10.1021/ar700027f. [DOI] [PubMed] [Google Scholar]
- 42.Kovaleva EG, Neibergall MB, Chakrabarty S, Lipscomb JD. Acc Chem Res. 2007;40:475. doi: 10.1021/ar700052v. [DOI] [PMC free article] [PubMed] [Google Scholar]
- 43.Sono M, Roach MP, Coulter ED, Dawson JH. Chem Rev. 1996;96:2841. doi: 10.1021/cr9500500. [DOI] [PubMed] [Google Scholar]
- 44.Costas M, Mehn MP, Jensen MP, Que L., Jr Chem Rev. 2004;104:939. doi: 10.1021/cr020628n. [DOI] [PubMed] [Google Scholar]
- 45.Tshuva EY, Lippard SJ. Chem Rev. 2004;104:987. doi: 10.1021/cr020622y. [DOI] [PubMed] [Google Scholar]
- 46.Krebs C, Fujimori DG, Walsh CT, Bollinger JM., Jr Acc Chem Res. 2007;40:484. doi: 10.1021/ar700066p. [DOI] [PMC free article] [PubMed] [Google Scholar]
- 47.Taki M, Iyoshi S, Ojida A, Hamachi I, Yamamoto Y. J Am Chem Soc. 2010;132:5938. doi: 10.1021/ja100714p. [DOI] [PubMed] [Google Scholar]
- 48.Au-Yeung HY, New EJ, Chang CJ. Chem Commun. 2012;48:5268. doi: 10.1039/c2cc31681a. [DOI] [PubMed] [Google Scholar]
- 49.Ekkati AR, Kodanko JJ. J Am Chem Soc. 2007;129:12390. doi: 10.1021/ja075075i. [DOI] [PubMed] [Google Scholar]
- 50.Song D, Lim JM, Cho S, Park S-J, Cho J, Kang D, Rhee SG, You Y, Nam W. Chem Commun. 2012;48:5449. doi: 10.1039/c2cc31632c. [DOI] [PubMed] [Google Scholar]
- 51.Han Y, You Y, Lee YM, Nam W. Adv Mater. 2012;24:2748. doi: 10.1002/adma.201104467. [DOI] [PubMed] [Google Scholar]
- 52.McDonald AR, Guo Y, Vu VV, Bominaar EL, Munck E, Que L. Chem Sci. 2012;3:1680. doi: 10.1039/C2SC01044E. [DOI] [PMC free article] [PubMed] [Google Scholar]
- 53.A pseudo first-order rate constant of the oxidative release of the fluorophore has been estimated to be 1 × 10⁻⁵ s−1.
- 54.To date, only eight non-corrinoid cobalt proteins have been identified and characterized, which are all from bacterial systems. The loosely bound form of cobalt is even less known and studied. See: Kobayashi M, Shimizu S. Eur J Biochem. 1999;261:1. doi: 10.1046/j.1432-1327.1999.00186.x.Okamoto S, Eltis LD. Metallomics. 2011;3:963. doi: 10.1039/c1mt00056j.
- 55.Stahlberg KG, Radner S, Norden A. Scand J Haemat. 1967;4:312. doi: 10.1111/j.1600-0609.1967.tb01632.x. [DOI] [PubMed] [Google Scholar]
- 56.The fluorescence was indeed attenuated by around 50% in the presence of 0.1–10% of Co2+ but enhanced by around 30% in a 1:1 mixture of Fe2+ and Co2+, indicating the possibility of a different bimetallic mechanism that is dependent on the relative concentrations of the metals.
- 57.Anderson ER, Shah YM. Compr Physiol. 2013;3:315. doi: 10.1002/cphy.c120016. [DOI] [PMC free article] [PubMed] [Google Scholar]
- 58.Tsien RY. Nature. 1981;290:527. doi: 10.1038/290527a0. [DOI] [PubMed] [Google Scholar]
- 59.Izumi S, Urano Y, Hanaoka K, Terai T, Nagano T. J Am Chem Soc. 2009;131:10189. doi: 10.1021/ja902511p. [DOI] [PubMed] [Google Scholar]
- 60.McQuade LE, Ma J, Lowe G, Ghatpande A, Gelperin A, Lippard SJ. Proc Natl Acad Sci USA. 2010;107:8525. doi: 10.1073/pnas.0914794107. [DOI] [PMC free article] [PubMed] [Google Scholar]
- 61.Dickinson BC, Peltier J, Stone D, Schaffer DV, Chang CJ. Nat Chem Biol. 2011;7:106. doi: 10.1038/nchembio.497. [DOI] [PMC free article] [PubMed] [Google Scholar]
- 62.Terman A, Kurz T. Antioxid Redox Signal. 2013;18:888. doi: 10.1089/ars.2012.4885. [DOI] [PubMed] [Google Scholar]
- 63.Park CH, Valore EV, Waring AJ, Ganz T. J Biol Chem. 2001;276:7806. doi: 10.1074/jbc.M008922200. [DOI] [PubMed] [Google Scholar]
- 64.Nicolas G, Viatte L, Bennoun M, Beaumont C, Kahn A, Vaulont S. Blood Cells Mol Dis. 2002;29:327. doi: 10.1006/bcmd.2002.0573. [DOI] [PubMed] [Google Scholar]
- 65.Ganz T. Blood. 2003;102:783. doi: 10.1182/blood-2003-03-0672. [DOI] [PubMed] [Google Scholar]
- 66.Nemeth E, Tuttle MS, Powelson J, Vaughn MB, Donovan A, Ward DM, Ganz T, Kaplan J. Science. 2004;306:2090. doi: 10.1126/science.1104742. [DOI] [PubMed] [Google Scholar]
- 67.Bridges KR, Hoffman KE. J Biol Chem. 1986;261:14273. [PubMed] [Google Scholar]
- 68.Toth I, Rogers JT, McPhee JA, Elliott SM, Abramson SL, Bridges KR. J Biol Chem. 1995;270:2846. doi: 10.1074/jbc.270.6.2846. [DOI] [PubMed] [Google Scholar]
- 69.Lane DJR, Lawen A. J Biol Chem. 2008;283:12701. doi: 10.1074/jbc.M800713200. [DOI] [PubMed] [Google Scholar]
- 70.Brewer C, Otto-Duessel M, Lykkesfeldt J, Nick H, Wood JC. Exp Hematol. 2012;40:820. doi: 10.1016/j.exphem.2012.06.005. [DOI] [PubMed] [Google Scholar]
- 71.Renz M, Hemmert C, Meunier B. Eur J Org Chem. 1998:1271–1273. [Google Scholar]
Associated Data
This section collects any data citations, data availability statements, or supplementary materials included in this article.