Significance
Between 2006 and 2011 a series of earthquakes occurred in the Cogdell oil field near Snyder, TX. A previous series of earthquakes occurring 1975–1982 was attributed to the injection of water into wells to enhance oil production. We evaluated injection and extraction of oil, water, and gas in the Cogdell field. Water injection cannot explain the 2006–2011 earthquakes. However, since 2004 significant volumes of gas including CO2 have been injected into Cogdell wells. If this triggered the 2006–2011 seismicity, this represents an instance where gas injection has triggered earthquakes having magnitudes 3 and larger. Understanding when gas injection triggers earthquakes will help evaluate risks associated with large-scale carbon capture and storage as a strategy for managing climate change.
Keywords: triggered seismicity, fluid injection, carbon sequestration
Abstract
Between 1957 and 1982, water flooding was conducted to improve petroleum production in the Cogdell oil field north of Snyder, TX, and a contemporary analysis concluded this induced earthquakes that occurred between 1975 and 1982. The National Earthquake Information Center detected no further activity between 1983 and 2005, but between 2006 and 2011 reported 18 earthquakes having magnitudes 3 and greater. To investigate these earthquakes, we analyzed data recorded by six temporary seismograph stations deployed by the USArray program, and identified 93 well-recorded earthquakes occurring between March 2009 and December 2010. Relocation with a double-difference method shows that most earthquakes occurred within several northeast–southwest-trending linear clusters, with trends corresponding to nodal planes of regional focal mechanisms, possibly indicating the presence of previously unidentified faults. We have evaluated data concerning injection and extraction of oil, water, and gas in the Cogdell field. Water injection cannot explain the 2006–2011 earthquakes, especially as net volumes (injection minus extraction) are significantly less than in the 1957–1982 period. However, since 2004 significant volumes of gases including supercritical CO2 have been injected into the Cogdell field. The timing of gas injection suggests it may have contributed to triggering the recent seismic activity. If so, this represents an instance where gas injection has triggered earthquakes having magnitudes 3 and larger. Further modeling studies may help evaluate recent assertions suggesting significant risks accompany large-scale carbon capture and storage as a strategy for managing climate change.
Induced seismicity related to underground injection of liquids has been widely reported (1–10) but there are very few reports of gas injection triggering earthquakes large enough to be felt or cause damage at the surface. Thus, the injection-induced earthquakes of concern are not the tiny events accompanying hydrofracturing that have magnitudes of 1.5 or smaller; rather, they are the larger-magnitude earthquakes sometimes caused by injection for water flooding, enhanced production, or waste disposal.
For liquid injection, it is plausible that triggered earthquakes occur when fluids reach suitably oriented preexisting faults, reducing the normal stress and hence the friction, and releasing regional tectonic shear stresses. The same mechanism should allow gas injection to trigger earthquakes. Recently Zoback and Gorelick (11) argued that there is a “high probability that earthquakes will be triggered” by the large-scale injection of CO2 as a strategy to reduce greenhouse gases; however, they offered no examples of CO2-injection-triggered earthquakes. Also, we are unaware of any reports of gas-injection-triggered earthquakes having magnitudes exceeding 3 (M3).
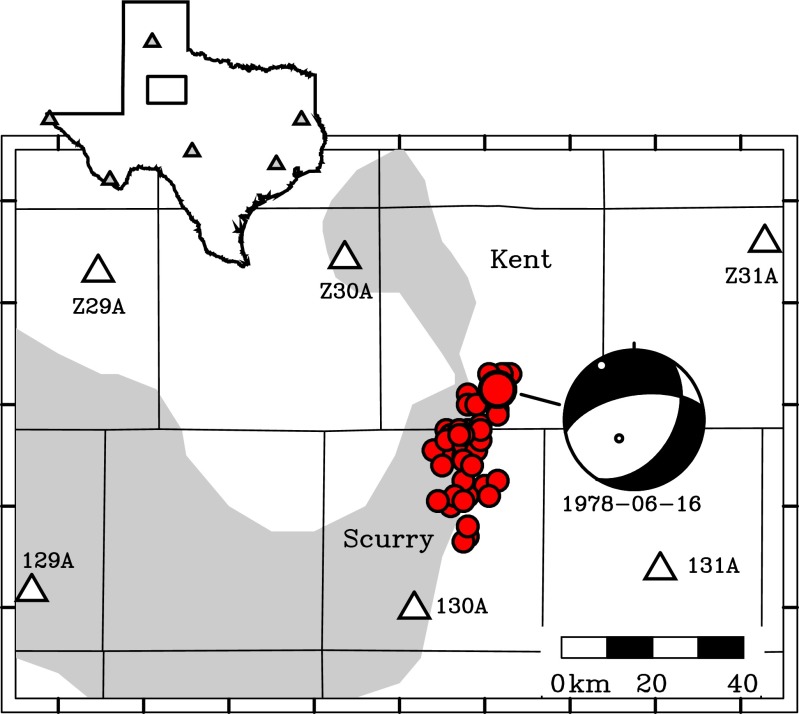
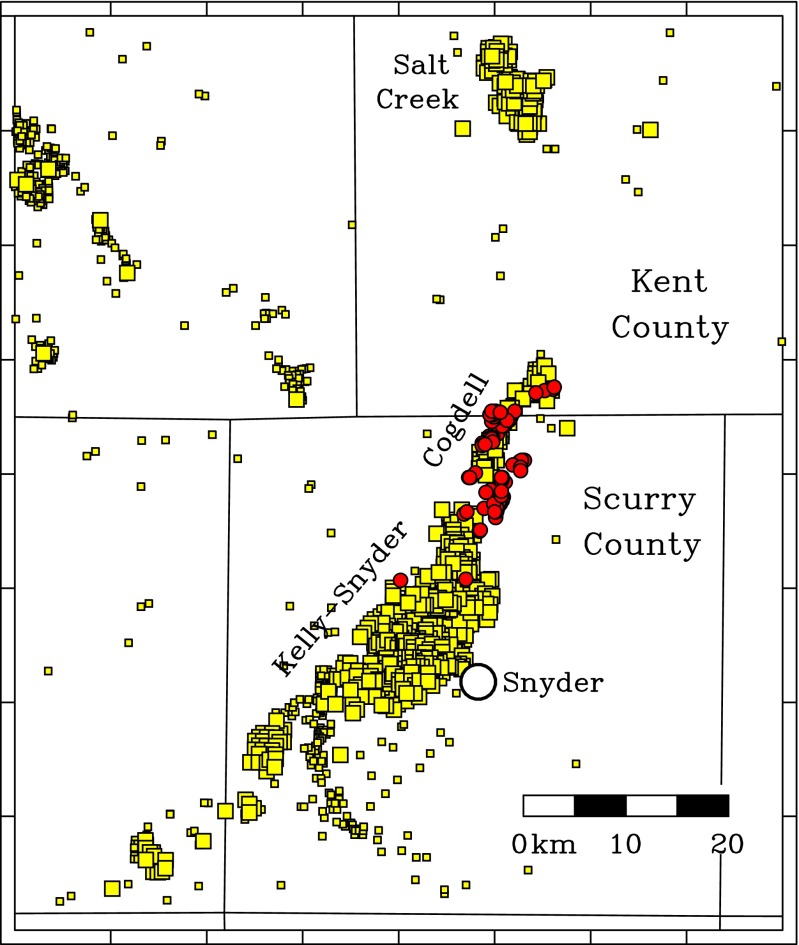
The present investigation concerns seismic activity and injection in petroleum fields in Scurry and Kent Counties, Texas (Figs. 1 and 2). The northern field straddling the Scurry–Kent county line is the Cogdell field. The larger field in Scurry County west of Snyder is called the Kelly–Snyder field, or sometimes the Scurry Area Canyon Reef Operators Committee unit. These fields produce from the Horseshoe Atoll, which accumulated in the Late Paleozoic and is one of the largest subsurface limestone reef mounds in the world (12, 13).
Fig. 1.
Map showing location of study area, with earthquakes (red circles) reported by the NEIC 1977–2012, and USArray Transportable Array stations (white triangles) operating March 2009–December 2010 (Table S1). Gray shaded area indicates extent of Horseshoe Atoll. (Inset) Rectangle in Texas shows map boundaries; gray triangles in inset are seismograph stations operating in 2005 before passage of USArray. Light lines are county boundaries; labels indicate Scurry and Kent Counties.
Fig. 2.
Map of study area, showing 2009–2011 earthquakes (red circles) located in this study, and wells injecting water (yellow squares). Large squares, wells where monthly injection volumes exceeded 16,000 m3/mo for one or more months during 2004–2011 period. White circle indicates town of Snyder, TX. Labels “Cogdell,” “Kelly–Snyder,” and “Salt Creek” are petroleum fields discussed in the text.
The Cogdell field underwent water flooding for secondary recovery between 1956 and 1982 and the earliest earthquakes detected there occurred in November 1974; the largest was an M4.6 on June 16, 1978 (14). Davis and Pennington (1) found that Cogdell seismic activity was correlated with the net liquid injection rate, with the first earthquakes occurring almost 20 y after injection commenced (Fig. S1). They modeled fluid pressures in the field and concluded that the earthquakes occurred at the boundaries of relatively low-pressure areas surrounded by higher-pressure regions. Although they suggested the earthquakes occurred on preexisting faults, there are no faults on regional tectonic maps and available locations of aftershocks did not occur along lineations or elongated clusters (Fig. 3).
Fig. 3.
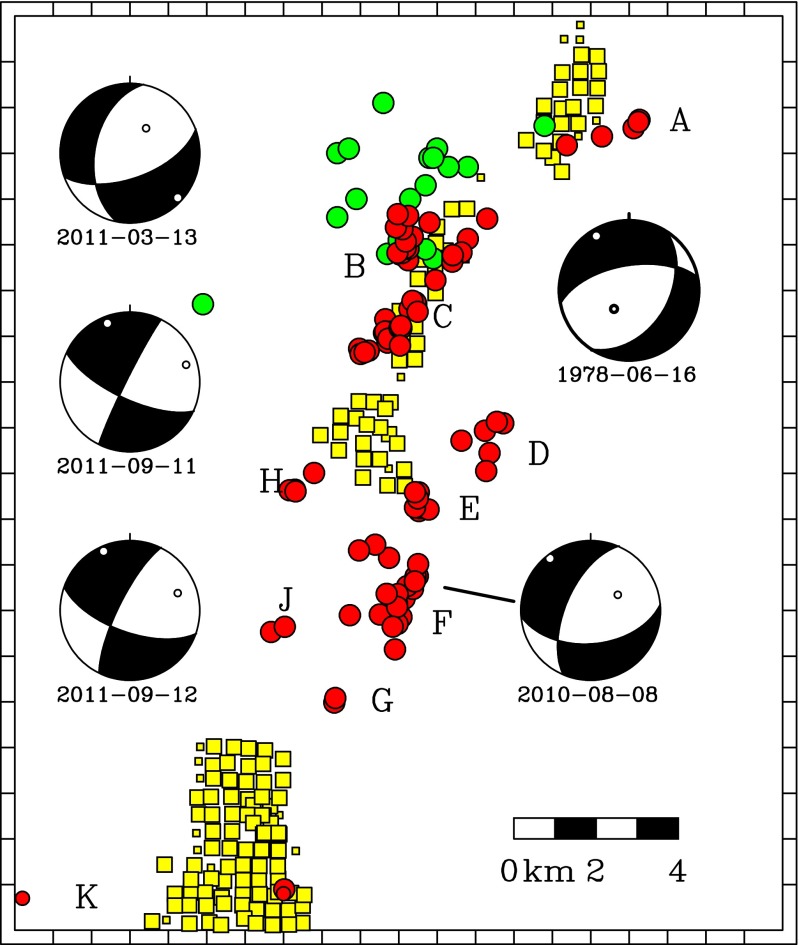
Map showing 2009–2011 earthquakes relocated in this study (red circles), earthquakes occurring 1979–1980 (green circles) reported by Harding (15), gas injection wells active since 2004 (yellow squares), and focal mechanisms for regional events. Focal mechanisms are from the St. Louis group (16); labels indicate the date of occurrence (Table S2). Only the August 8, 2010, mechanism is for an earthquake relocated in this study. Larger red circles are epicenters occurring between March 2009 and December 2010 relocated using the double-difference method; two smaller red circles at southernmost boundary of plot are single-event locations of outlier events. Labels “A” through “K” indicate clusters discussed in Results. The 1979–1980 epicenters were determined from data collected by a temporary local network. For gas injection wells, larger symbols indicate wells where maximum monthly injection rate exceeds 2.8 million m3/mo at standard conditions (8360 m3/mo at depth for SCCO2).
There is a history of gas injection as well as water injection in the Kelly–Snyder and Cogdell fields. Northern sections of the Kelly–Snyder field have been undergoing CO2 injection to enhance recovery since 1971 (17). In 2008 some Kelly–Snyder wells were used for a monitoring and modeling case study to learn about carbon capture use and geologic storage applications (18). Finally, in the Cogdell field, injection of CO2 to enhance recovery began in 2001 and has been ongoing with nearly constant injection volumes since 2004.
For gas injection at wells in the Cogdell and Kelly–Snyder fields, the database available for this study reports monthly gas volumes at surface pressures and temperatures (STP 1 bar and 15 °C), and does not specify whether the gas injected is CO2 or methane. At the depth of injection in Cogdell (∼2.1 km) the pressure and temperature are ∼200 bars and ∼75 °C; under these conditions CO2 is a supercritical fluid (SCCO2) with a volume ∼1/339th of that at STP; for methane the volume is ∼1/180th of that at STP.
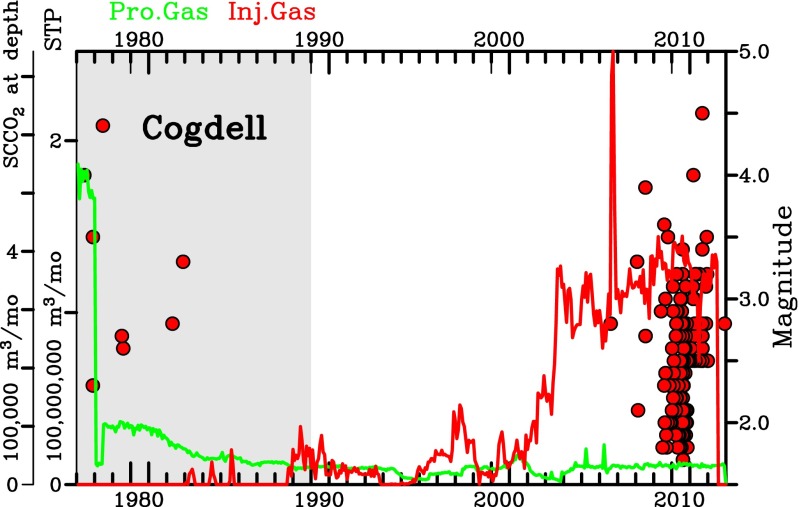
In the Cogdell, since 2004 monthly gas injection volumes have exceeded 85 million m3/mo at STP (Fig. 4). Thus, at the depth of injection this corresponds to 250,000 m3/mo for CO2 and 475,000 m3/mo for methane. In Cogdell and elsewhere, injected SCCO2 and/or methane are often mixed with water, and the mixtures may undergo phase changes as they move away from the site of injection, so the volumes calculated at depth (e.g., left axis on Fig. 4) are only approximate.
Fig. 4.
For the Cogdell field, monthly volumes of natural gas produced (green line), gas injected (red line), and earthquakes detected from 1977 to 2012 (red circles). Volumes on left axes are as reported by RRC for gas at surface at STP, and for CO2 at 200 bars and 75 °C (SCCO2 at depth). Volumes at depth are highly approximate because the pressure–temperature effect differs for natural gas and CO2, and because injected gas is often mixed with water and the physical properties of the mixture changes after injection. Gas volume data are from RRC and IHS digital database for the region labeled “Cogdell” in Fig. S2. Gas volume data before 1990 (gray area) are incomplete (see Materials and Methods).
The National Earthquake Information Center (NEIC) reports no Cogdell earthquakes between 1983 and 2005, but since 2006 they list 38 events that appear to be from a different population than earlier seismic activity (Fig. S3). The 2006–2011 epicenters include 18 with magnitudes M3 and greater and one on September 11, 2011, with moment magnitude (MW) 4.4; if similar events had occurred between 1983 and 2005 most would have been detected and reported by the NEIC (19). Between 2009 and 2011 the EarthScope USArray temporary seismic stations were deployed in Texas; during this period we found 105 epicenters in the Cogdell area in the catalogs from the NEIC, the International Seismological Center (ISC), and the Array Network Facility (ANF), the organization that manages USArray data. Of these, 97 occurred between March 2009 and December 2010 when the six USArray stations surrounding Cogdell were all operational.
The focus of the present investigation is to analyze the characteristics of the recent Cogdell seismicity and to evaluate its relationship with water and gas injection. Although some of the recent earthquakes occurred at distances as great as ∼5 km from active injection wells (Fig. 3), induced earthquakes at greater distances have been observed elsewhere (2, 3), especially where injection has been ongoing for many years. The fortuitous presence of the USArray stations between 2009 and 2011 makes it possible to identify much smaller earthquakes and determine their epicenters more accurately than during prior or subsequent times (Fig. 1).
Results
Earthquake Locations and Focal Mechanisms.
The relocated epicenters (red circles, Fig. 3) cluster into several discrete groups. Overall they form a much less diffuse pattern than the epicenters reported in the ANF catalog (Fig. S4).
Certain linear features in the groups are approximately consistent with focal mechanism nodal planes. In the north a group of five events (labeled “A” in Fig. 3) forms a lineation trending just north of east, approximately the same as the trend (80° east of north) as the most steeply dipping nodal plane of the June 16, 1978, earthquake (Table S2). About 4 km to the southwest there are two more groups; one with 14 events (group B) forms a tight cluster, whereas the other group of 30 events (group C) lies along a distinct line trending ∼45° east of north. Still further south are several more clusters; groups D, E, F, and G all lie along a line trending about 25° east of north. This is nearly identical to the 23° east of north trend of a nodal plane for the August 8, 2010, earthquake which is a member of group F. Finally, two small outlier clusters (H and J) of three and two events, respectively, lie ∼2–3 km to the west of the other events.
The linear features in the relocated epicenters, including some approximately coincident with nodal planes, suggest that the seismic activity may occur along preexisting faults. As noted in previous studies (1, 13), the absence of mapped faults is unsurprising considering that the Cogdell and Kelly–Snyder reservoirs are reef buildups rather than fault-bounded traps.
No accurate location is available for the largest historical Cogdell earthquake (June 16, 1978; M4.6) because of near-absence of contemporary nearby regional seismographs. However, the epicenters of aftershocks determined by a temporary local network in 1979–80 (green circles in Fig. 3) are mostly within a few kilometers of group B of 2009–2011 epicenters, suggesting that the 1978 epicenter may have been nearby, and that the present seismicity is a renewal of the earlier activity.
Seismicity and Injection/Extraction of Liquids and Gas.
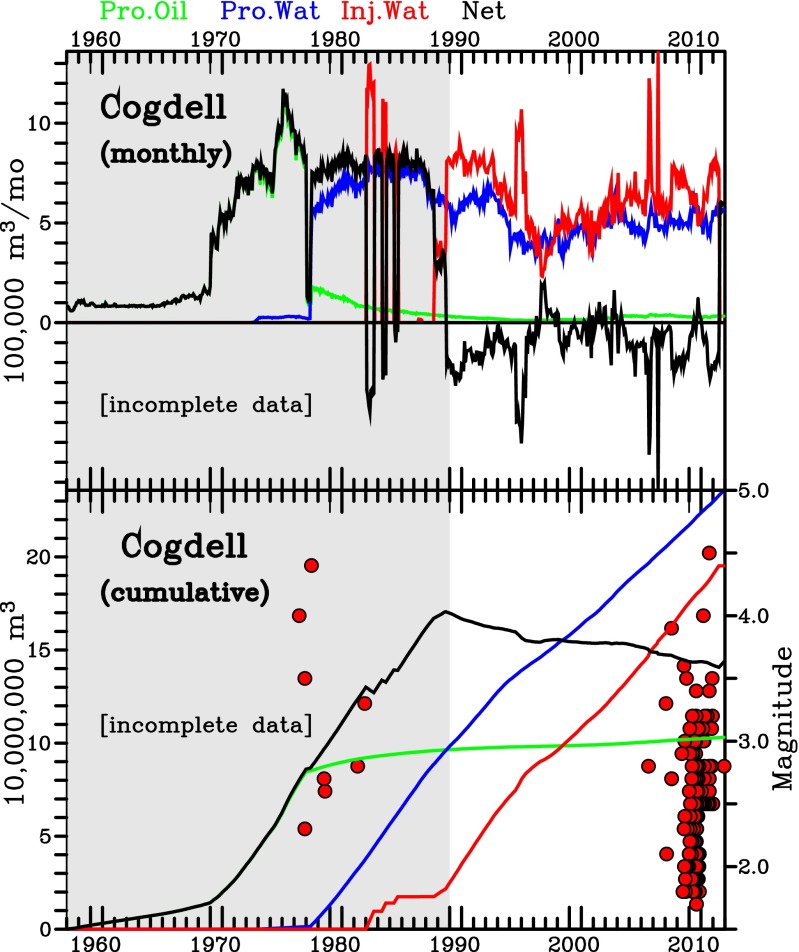
For wells in the Cogdell field, the available digital database has continuous monthly reports of oil produced, water extracted, water injected, gas produced, and gas injected extending back to 1990 (Figs. 4 and 5). Before that, and especially before 1982, the data are incomplete; Davis and Pennington (1) retrieved some of this information from records stored on microfiche and reported that the net volume of fluid extracted before 1982 exceeded 300,000,000 m3 (Fig. S1).
Fig. 5.
For the Cogdell field, monthly (Upper) and cumulative (Lower) volumes of oil produced (green line), water produced (blue line), water injected (red line), and net volume extracted (black line: oil + water produced minus water injected). Red circles and right axis are earthquakes detected from 1977 to 2012. Volume data are from RRC and IHS digital database for the region labeled “Cogdell” in Fig. S2. Data before 1990 (gray area) are incomplete (see Materials and Methods).
Since 1990, however, volumes of water/oil injection and production have been roughly comparable, generally in the range of 400,000–800,000 m3/mo (Fig. 5). A brief spike of higher injection volumes did take place in July and August of 2006 and this coincides with the renaissance of earthquake activity (the M2.8 August 8, 2006 event). However, there are no sustained changes in injection or extraction rates occurring before the 2006–2011 seismic activity, and no obvious overall changes in volumes of liquid extraction, injection, or the net during or before the 2006–2011 period when the field again became seismically active.
In contrast, a significant increase in gas injection (Fig. 4) in the Cogdell field took place before the 2006–2011 earthquake activity. SCCO2 injection began in 2001, but rates were negligible until 2002, when sustained injection at rates of ∼40 million m3/mo at standard conditions (125,000 m3/mo at depth for SCCO2) began in the cluster of wells near label A in Fig. 3. In 2003 sustained injection at rates of ∼25–50 million m3/mo (80,000–160,000 m3/mo at depth for SCCO2) began in the cluster of wells near H in Fig. 3; the rates in August and September of 2006 were anomalous and exceeded 85 million m3/mo (250,000 m3/mo at depth for SCCO2). Also in 2006, injection at rates averaging ∼25 million m3/mo (80,000 m3/mo at depth for SCCO2) began in the cluster of wells near B and C in Fig. 3. In August–September 2006 this group of wells also experienced a 2-mo spike in injection where rates were 70–82 million m3/mo (209,000–242,000 m3/mo at depth for SCCO2). For Cogdell as a whole, the combined effect is that gas injection rates were about 113 million m3/mo (334,000 m3/mo at depth for SCCO2) between 2004 and 2012, and there was a temporary increase to more than 225 million m3/mo (668,000 m3/mo at depth for SCCO2) in August of 2006, just as the first earthquake in the 2006–2011 sequence was detected.
Gas injection rates also increased for wells in the northern Kelly–Snyder field (wells near K label in Fig. 3), but this occurred somewhat later than in Cogdell. For Kelly–Snyder wells north of the southern boundary of Fig. 3, injected volumes first exceeded 42 million m3/mo (125,000 m3/mo at depth for SCCO2) in July 2009, and increased to rates that averaged more than 285 million m3/mo (840,000 m3/mo at depth for SCCO2) after July 2010.
Discussion and Summary
Earthquakes Possibly Triggered by Gas Injection.
The most significant result of this investigation is that gas injection may have contributed to triggering a sequence of earthquakes occurring since 2006 in and near the Cogdell field in Texas. This sequence followed a 24-y interval when no earthquakes were detected. The post-2006 sequence followed significant increases in gas injection in the Cogdell field (Fig. 4) and many earthquake epicenters were within 2 km of actively injecting wells (groups A–C, E, and H in Fig. 3). Between 1990 and 2006 there were no significant changes in rates of injected water except for a 1-y interval beginning in 1995 and 2 mo in 2006 (Fig. 5).
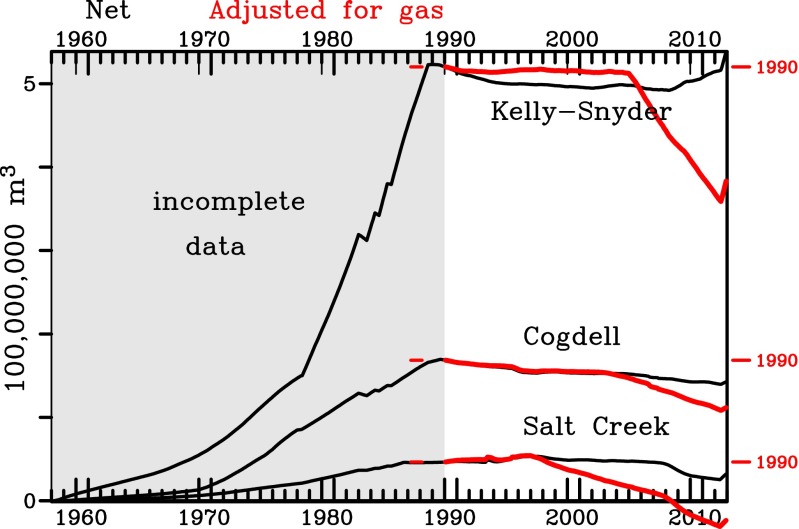
Since 1990 net cumulative volumes (liquid extracted minus injected) have been negative, i.e., the volume of material at depth has increased, and amount to about 20,000,000 m3 (Figs. 5 and 6). When this volume is adjusted to account for the effect of extracted and injected gas, an additional ∼20,000,000 m3 since 2004 is attributable to injected gas (red line, Fig. 6). Thus, if one attributes the seismicity either to overpressuring reducing friction on faults, or to exceeding the capacity of “effectively sealed compartments,” as Keranen et al. (10) recently suggested might contribute to causing a 2011 M5.7 earthquake in Oklahoma, it is plausible that injected gas played a dominant role.
Fig. 6.
Comparison of net cumulative volumes extracted for the Cogdell, Salt Creek, and Kelly–Snyder fields. Black line is oil + water produced minus water injected. Red line is volume adjusted for gas produced and injected after 1990 to approximate volume removed at production depth since 1990. Adjusted volumes are determined by assuming gas extracted is methane, and injected gas is CO2; thus, red line is black line plus (1/180) gas produced minus (1/339) gas injected; at production depths where temperature is ∼75 °C and pressure is ∼200 bars, volumes of natural gas and CO2 are ∼(1/180) and ∼(1/339), respectively, of volumes at surface conditions (see introduction in text). Volume data are from IHS digital database for the three regions (Fig. S2). Data before 1990 (gray area) are incomplete (see Materials and Methods). Ticks labeled “1990” on right axis show net volume as of 1990; note that since 1990 effect of gas injection is to decrease cumulative volume extracted, i.e., to increase the volume at depth.
This is an unusual and noteworthy instance where gas injection may have contributed to triggering earthquakes having magnitudes of 3 or larger, as the 2006–2012 sequence included 18 earthquakes with magnitudes exceeding 3, and an MW4.4 earthquake that occurred September 11, 2011. A recent review of induced seismicity associated with CO2 storage reported no instances where gas injection triggered seismicity (20). Microseismic monitoring has accompanied SCCO2 injection projects at fields in Australia, Algeria, and Utah (21, 22), but in each case recorded seismic activity had magnitudes of zero or less, even in fields where interferometric synthetic aperture radar measurements showed that surface uplifts of several centimeters accompanied the injection. Two reportedly induced or triggered earthquakes with magnitudes of M7 occurred in 1976 and 1984 in gas fields in Gazli, Soviet Uzbekistan (23); however, these have been associated with massive gas extraction (not injection), and there is controversy about whether they are induced or natural.
Faulting in the Cogdell Region?
The recent seismic activity provides strong evidence for the presence of subsurface faults in the Cogdell region. The five currently available focal mechanisms (Fig. 3) include both predominantly normal-faulting and strike slip mechanisms; all five have nearly horizontal tension axes along a north-northwest–south-southeast direction. The observed northeast–southwest-trending linear features in the relocated epicenters, some approximately parallel to the nodal planes, are consistent with the hypothesis that seismicity is releasing tectonic stress along previously existing faults. The observation that some of the 2009–2011 epicenters are near locations reported in 1979–1980 (15) suggests these may be the same faults or part of the same fault system active 1974–1982. Elsewhere in Texas, in Dallas–Fort Worth (8), earthquakes apparently triggered by the injection of water occur along similar northeast–southwest-trending linear features.
Unanswered Questions.
If the recent Cogdell earthquakes are triggered, it is still puzzling why there are no earthquakes in similar nearby fields (Fig. 2) such as the Kelly–Snyder field and the Salt Creek field. Like Cogdell, both fields have experienced a combination of years of sustained injection/extraction of water/oil, followed by recent increases in gas injection (Fig. 6 and Figs. S5–S8). Since 1990, when the injection/extraction data are complete, within all three fields liquid injection and extraction rates have been approximately equal, whereas the injection of gas has increased the volume of material at depth (Fig. 6).
This observation, and the fact that no other gas injection sites have reported earthquakes with magnitudes as large as 3, suggests that despite Zoback and Gorelick’s (11) concerns, it is possible that in many locations large-volume CO2 injection may not induce earthquakes. What is different about Cogdell that allows earthquakes to occur there? Detailed modeling investigations (21, 24) of hydrology and subsurface stress, comparing subsurface conditions in the Cogdell, Kelly–Snyder, and Salt Creek fields, might provide answers to this question. There have been preliminary monitoring and modeling of the consequences of SCCO2 injection in the Kelly–Snyder (SACROC) unit (25, 26). The presence of detectable seismic activity in the Cogdell field and its absence in the apparently similar Kelly–Snyder and Salt Creek fields makes these fields attractive candidates for detailed geomechanical modeling, as has been recently applied to CO2 injection sites near the coast of Italy (27). It would be informative to apply similar analyses to the Cogdell field, incorporating information about faulting, our reported epicentral locations, and Texas Railroad Commission (RRC) data concerning extraction/injection rates at individual wells.
Utility of USArray Data.
As in our previous investigation of triggered seismicity in the Barnett Shale of northeast Texas (9), the present study is an apt example of a positive but unanticipated benefit of the USArray Temporary Array, part of the National Science Foundation-funded EarthScope program. EarthScope was conceived and funded before recent concerns about possible hazards from earthquakes triggered by water injection associated with disposal of hydrofracturing wastes (27) or by SCCO2 injection for carbon sequestration (11, 28, 29). Analysis of USArray data makes it possible to determine accurate epicenters for small events and evaluate their proximity to nearby wells; it is plausible that similar analysis could provide critical information about possibly triggered earthquakes elsewhere.
For studies of this kind, the most serious limitation of USArray data is that it is difficult to assess the focal depths of triggered earthquakes with data collected at 70-km average station spacing. In the present study we arbitrarily fixed the depths at 5 km. To obtain more accurate depths from travel times one needs data from stations situated at intervals of a few kilometers or less. Alternatively, if very accurate information about crustal structure were available, reliable depths might be determined using currently available data by comparing recorded waveforms with synthetics.
Materials and Methods
Information concerning volumes of gas, oil, and water injected and extracted at individual wells is publicly available from the Texas RRC. The RRC regulates activity related to petroleum production and issues permits for drilling wells; by law, petroleum producers must provide the RRC with information concerning well locations, depths, and monthly volumes of injection/extraction of oil, water, and gas. Originally this information was filed as paper records and archived on microfiche. Nowadays most of these data are stored digitally. There has been some effort to convert older data; because this required keypunching there are occasional errors. This study mostly used RRC data as compiled by the company IHS Inc. Generally, before about 1990 the digital information is only partially complete. We wrote computer programs to sum data from individual wells and construct volume/time histories for specific fields and geographic areas. The RRC reports volumes of liquids in units of barrels. Because the volumes of oil and other fluids depend on pressure and on amounts of dissolved gas, subsurface volumes may differ slightly from volumes measured at the surface; however, in this study we use the conversion factor 1 m3 = 6.29 barrels. The RRC reports volumes of gases in thousands of cubic feet at STP; the conversion factor is 1,000 ft3 = 35.3 m3.
This investigation analyzed earthquakes recorded by the six USArray stations surrounding the study area (Fig. 1 and Table S1). These were simultaneously operational from March 2009 to December 2010. During this period, the combined NEIC-ISC-ANF catalogs report 97 earthquakes located in northern Scurry and southern Kent Counties. We downloaded three-component seismograms from the USArray stations for these events from the Incorporated Research Institutions for Seismology Data Management Center.
To obtain more accurate locations for these events, we manually picked primary (P) and secondary (S) phases at all six stations. Then, to ensure we were picking the same feature for each phase and thus improve relative location accuracy, we plotted phases for multiple events together (Fig. S9) and adjusted the time picks. P and S arrival time were thus picked with a precision of 20 ms or better for most phases.
We determined preliminary epicenters for 93 of these events using a standard iterated least-squares program, fixing the focal depths at 5 km because USArray station spacing (∼70 km) is too large to allow determining meaningful depths. We then jointly relocated the events to determine station corrections and more accurate trial locations. Finally, we relocated using the double-difference program HYPODD (30), obtaining relative locations for 90 events (Fig. 3 and Table S3). The rms residuals for the resulting locations were all 0.12 s or less, and most were smaller than 0.05 s. For relocations we used the CHELSEA (southwest Oklahoma) crustal model used by the Oklahoma Geological Survey for routine network locations (31).
Supplementary Material
Acknowledgments
We thank Sue Hovorka, J. P. Nicot, Tip Meckel, Eric Potter, and one anonymous reviewer for helpful comments that improved this manuscript. We especially thank reviewers Wayne Pennington and Bill Ellsworth, who provided helpful comments on two preliminary versions of this work. We also thank Felix Waldhauser for helping us use his double-difference algorithm to locate earthquakes having fixed focal depths. This research was partially supported by National Natural Science Foundation of China Grant 41174076 and by the US Geological Survey (USGS) Department of the Interior, under USGS Award G13AP00023.
Footnotes
The authors declare no conflict of interest.
This article is a PNAS Direct Submission.
This article contains supporting information online at www.pnas.org/lookup/suppl/doi:10.1073/pnas.1311316110/-/DCSupplemental.
References
- 1.Davis SD, Pennington WD. Induced seismic deformation in the Cogdell oil field of west Texas. Bull Seismol Soc Am. 1989;79(5):1477–1495. [Google Scholar]
- 2.Hsieh PA, Bredehoeft JD. A reservoir analysis of the Denver earthquakes: A case of induced seismicity. J Geophys Res. 1981;86(B2):903–920. [Google Scholar]
- 3.Ake J, Mahrer K, O'Connell D, Block L. Deep injection and closely monitored induced seismicity at Paradox Valley, Colorado. Bull Seismol Soc Am. 2005;95(2):664–683. [Google Scholar]
- 4. Nicholson C, Wesson RL (1990) Earthquake Hazard Associated with Deep Well Injection: A Report to the US Environmental Protection Agency, US Geological Survey Bulletin (USGS, Washington, DC), Vol 1951.
- 5.Zoback MD, Harjes H-P. Injection-induced earthquakes and crustal stress at 9 km depth at the KTB deep drilling site, Germany. J Geophys Res. 1997;102(B8):18477–18491. [Google Scholar]
- 6.Horton S. Disposal of hydrofracking waste fluid by injection into subsurface aquifers triggers earthquake swarm in central Arkansas with potential for damaging earthquake. Seismol Res Lett. 2012;83(2):250–260. [Google Scholar]
- 7.Suckale J. Induced seismicity in hydrocarbon fields. Adv Geophys. 2009;51:55–106. [Google Scholar]
- 8.Frohlich C, Hayward C, Stump B, Potter E. The Dallas–Fort Worth earthquake sequence: October 2008 through May 2009. Bull Seismol Soc Am. 2011;101(1):327–340. [Google Scholar]
- 9.Frohlich C. Two-year survey comparing earthquake activity and injection-well locations in the Barnett Shale, Texas. Proc Natl Acad Sci USA. 2012;109(35):13934–13938. doi: 10.1073/pnas.1207728109. [DOI] [PMC free article] [PubMed] [Google Scholar]
- 10.Keranen KM, Savage HM, Abers GA, Cochran ES. Potentially induced earthquakes in Oklahoma, USA: Links between wastewater injection and the 2011 Mw 5.7 earthquake sequence. Geology. 2013;41(6):699–702. [Google Scholar]
- 11.Zoback MD, Gorelick SM. Earthquake triggering and large-scale geologic storage of carbon dioxide. Proc Natl Acad Sci USA. 2012;109(26):10164–10168. doi: 10.1073/pnas.1202473109. [DOI] [PMC free article] [PubMed] [Google Scholar]
- 12. Vest E (1970) Oil fields of Pennsylvanian-Permian horseshoe atoll, west Texas. Geology of Giant Petroleum Fields—Symposium, ed Halbouty MT, Amer Assoc Petrol Geol Memoir 14:185–203.
- 13.Halbouty MT. Giant oil and gas fields in the United States. AAPG Bull. 1968;52(7):1115–1152. [Google Scholar]
- 14. Frohlich C (2002) Texas Earthquakes (Univ Texas Press, Austin, TX), 275 pp.
- 15. Harding ST (1981) Induced Cogdell Canyon Reef oil field. Summaries of Technical Reports, Vol. IX (US Department of the Interior, Menlo Park, CA), pp 452–455.
- 16.Herrmann RB, Benz H, Ammon CJ. Monitoring the earthquake source process in North America. Bull Seismol Soc Am. 2011;101(6):2609–2625. [Google Scholar]
- 17.Brummett WM, Emanual AS, Ronquille JD. Reservoir description by simulation at SACROC – a case history. J Pet Technol. 1976;28(10):1241–1255. [Google Scholar]
- 18.Han WS, McPherson BJ, Lichner PC, Wang FP. Evaluation of trapping mechanisms in geologic CO2 sequestration: Case study of SACROC northern platform, a 35-year CO2 injection site. Am J Sci. 2010;310(4):282–324. [Google Scholar]
- 19.Ellsworth WL. Injection-induced earthquakes. Science. 2013;341(6142):1225942. doi: 10.1126/science.1225942. [DOI] [PubMed] [Google Scholar]
- 20.Nicol A, Carne R, Gerstenberger M, Christophersen A. Induced seismicity and its implications for CO2 storage risk. Energy Procedia. 2011;4:3699–3706. [Google Scholar]
- 21.Rutqvist J. The geomechanics of CO2 storage in deep sedimentary formations. Geotech Geol Eng. 2012;30(3):525–551. [Google Scholar]
- 22.Zhou R, Huang L, Rutledge J. Microseismic event location for monitoring CO2 injection using double-difference tomography. Leading Edge (Tulsa Okla) 2010;29(2):208–214. [Google Scholar]
- 23.Simpson DW, Leith W. The 1976 and 1984 Gazli, USSR earthquakes—Were they induced? Bull Seismol Soc Am. 1985;75(5):1465–1468. [Google Scholar]
- 24.Tsang C-F, Birkholzer J, Rutqvist J. A comparative review of hydrologic issues involved in geologic storage of CO2 and injection disposal of liquid waste. Environ Geol. 2008;54(8):1723–1737. [Google Scholar]
- 25. Xiao C, Harris ML, Wang F, Grigg R (2011) Field testing and numerical simulation of combined CO2 enhanced recovery and storage in the SACROC unit. CSUG/SPE 147544 (abstr)
- 26.Romanak KD, et al. Sensitivity of groundwater systems to CO2: Application of a site-specific analysis of carbonate monitoring parameters at the SACROC CO2-enhanced oil field. Int J Greenh Gas Control. 2012;6:142–152. [Google Scholar]
- 27.Castelletto N, Gambolati G, Teatini P. Geological CO2 sequestration in multi-component reservoirs: Geomechanical challenges. J Geophys Res Solid Earth. 2013;118(1):1–12. [Google Scholar]
- 28. National Research Council (2013) Induced Seismicity Potential in Energy Technologies (National Academies, Washington, DC), 225 pp.
- 29.Benson SM, Cole DR. CO2 sequestration in deep sedimentary formations. Elements. 2008;4(5):325–331. [Google Scholar]
- 30.Waldhauser F, Ellsworth WL. A double-difference earthquake location algorithm: Method and application to the northern Hayward Fault, California. Bull Seismol Soc Am. 2000;90(6):1353–1368. [Google Scholar]
- 31.Mitchell BJ, Landisman M. Geophysical measurements in the southern Great Plains. The structure and physical properties of the earth’s crust. AGU Geophys Monogr Ser. 1971;14:77–93. [Google Scholar]
Associated Data
This section collects any data citations, data availability statements, or supplementary materials included in this article.


