

Abstract
Paclitaxel has been proved to be active in treatment and larynx preservation of HNSCC, however, the fact that about 20-40% patients do not respond to paclitaxel makes it urgent to figure out the biomarkers for paclitaxel-based treatment in Hypopharynx cancer (HPC) patients to improve the therapy effect. In this work, Fadu cells, treated or untreated with low dose of paclitaxel for 24 h, were applied to DNA microarray chips. The differential expression in mRNAs and miRs was analyzed and the network between expression-altered mRNAs and miRs was constructed. Differentially expressed genes were mainly enriched in superpathway of cholesterol biosynthesis (ACAT2, MSMO1, LSS, FDFT1 and FDPS etc.), complement system (C3, C1R, C1S, CFR and CFB etc.), interferon signaling (IFIT1, IFIT3, IFITM1 and MX1 etc.), mTOR signaling (MRAS, PRKAA2, PLD1, RND3 and EIF4A1 etc.) and IGF1 signaling (MRAS, IGFBP7, JUN and FOS etc.), most of these pathways are implicated in tumorigenesis or chemotherapy resistance. The first three pathways were predicted to be suppressed, while the last two pathways were predicted to be induced by paclitaxel, suggesting the combination therapy with mTOR inhibition and paclitaxel might be better than single one. The dramatically expression-altered miRs were miR-112, miR-7, miR-1304, miR-222*, miR-29b-1* (these five miRs were upregulated) and miR-210 (downregulated). The 26 putative target genes mediated by the 6 miRs were figured out and the miR-gene network was constructed. Furthermore, immunoblotting assay showed that ERK signaling in Fadu cells was active by low dose of paclitaxel but repressed by high dose of paclitaxel. Collectively, our data would provide potential biomarkers and therapeutic targets for paclitaxel-based therapy in HPC patients.
Keywords: Paclitaxel, hypopharynx cancer, DNA microarray, mTOR signaling
Introduction
Hypopharynx cancer (HPC) is an uncommon type of squamous cell carcinomas of head and neck (HNSCC); approximately 2,500 new cases are diagnosed in the United States each year (American Cancer Society). Almost all HPCs are mucosal squamous cell carcinomas (SCCs) and clinically tend to be aggressive and are characterized by diffuse local spread, early metastasis, and a relatively high rate of distant spread [1,2]. Approximately 80% of HPC patients were found to have stage III or stage IV disease, more than 50% of HPC patients have clinically positive cervical nodes and as many as 17% of HPCs may be associated with distant metastases when clinically diagnosed [3]. Surgery, radiotherapy, and chemotherapy are the main means for curative management of locally advanced HNSCC (i.e., stage III or IV), including HPC. With the advances in treatment, not only survival but also larynx preservation becomes important goals for treatment of HPC patients.
Growing evidences have suggested that chemotherapy is beneficial to larynx preservation. Induction chemotherapy or chemotherapy administered concomitantly with radiation for advanced HNSCC patients provides a survival advantage as well as a significantly increased rate of organ preservation when compared with radiation alone [4,5], and these two treatment modalities have been proven to be equally efficacy for larynx preservation and overall survival [6]. The previously standard cisplatin/5-fluoruracil (5-FU) combination is being replaced by the triple combination of taxane/cisplatin/5-FU [7]. Randomized trials showed that increased activity with the triplet regimen resulted in improved long-term disease control and survival [8,9]. Paclitaxel (Pac), one type of taxane, is a mitotic inhibitor used in cancer chemotherapy. Pac has proved its activity in treatment of various solid tumors, when used as monotherapy or combination with other drugs. When used alone for HNSCC treatment, the objective response rate (ORR) to Pac is 20-40% [10,11]. When combined with carboplatin for advanced HNSCC, the ORR to Pac is 52% [12]. But when cisplatin plus Pac is used as first-line therapy for locally advanced HNSCC, the ORR is 78-83% [13,14]. Furthermore, several reports suggest that Pac-based regimens provide an 81-84% 2-year organ preservation rate with acceptable toxicity in HNSCC patients, including patients with HPC, larynx and oropharynx cancer [5,15]. Collectively, Pac-based regimens, including induction chemotherapy or concurrent chemoradiotherapy, have good effects on patients’ survival and larynx preservation. However, there are still 20-40% of patients who do not respond to paclitaxel-based therapy. So, it is of great interest to find potential biomarkers for paclitaxel sensitivity evaluation to improve the therapy.
Several genes or microRNAs (miRs) have been implicated in paclitaxel sensitivity or resistance of various cancers. For example, expression of β-tubulin isotypes [16], γ-actin [17] and LIMK2 [18], and the extracellular matrix protein transforming growth factor-β induced (TGFBI) [19] was correlated with paclitaxel sensitivity in different cancers; paclitaxel sensitivity of various cancer cells was also associated to expression of miR-200c [20], miR-148a [21], miR-125b [22], miR-21 [23], miR-337-3p [24] and miR-34a [25]. However, there are few studies on biomarkers of HPC cells for paclitaxel.
In present study, to systematically understand the roles of genes or miRs in paclitaxel sensitivity, Fadu cells, untreated or treated with lower dose of paclitaxel for 24 h, were applied to DNA microarray chips for gene and miR expression profile analysis. The differentially expressed genes and miRs were identified and the relationships between significantly expression-altered miRs and genes were analyzed.
Materials and methods
Cell culture
Fadu cell line was purchased from ATCC (HTB-43) and maintained in DMEM medium supplemented with 10% FBS (Hyclone), penicillin (100 IU/ml) and Streptomycin (100 μg/ml) (Life Technologies). Cells in the exponential growth phase were used for all the experiments.
MTS assay for Fadu cell viability
Fadu cells (4×10³) were cultured in 100 μl of DMEM medium each well in a 96-well plate. 24 h later, the cells were treated with paclitaxel (0, 2, 6.3, 20, 63, 200, 630, 2000 nmol/L, respectively) for 72 h. Every treatment was triplicate in the same experiment. Then 20 μl of MTS (CellTiter 96 AQueous One Solution Reagent; Promega) was added to each well for 2 h at 37°C. After incubation, the absorbance was read at a wavelength of 490 nm according to the manufacturer’s instructions. The IC50 calculation was performed with GraphPad Prism 5.0 software.
The concentration of paclitaxel at which Fadu cell viability was suppressed by 10% or so in 24 h was determined as follow: Fadu cells were treated with paclitaxel (0, 0.2, 0.63, 2.0, 6.3 and 20 nmol/L, respectively) for 24 h. Every treatment was triplicate in the same experiment. The cell viability was examined as above mentioned.
The time-course of paclitaxel treatment was carried out as follow: Fadu cells were left untreated or treated with paclitaxel (2 nmol/L) for 24, 48 and 72 h, respectively. Every treatment was triplicate in the same experiment. The cell viability was calculated relatively to the untreated cells at every time point.
Microarray analysis: gene and miR expression profile
Fadu cells (8×10⁴) were grown in 2 ml of DMEM medium (10% FBS) each well in a 6-well plate. After 24 h, the cells were treated with paclitaxel (2 nmol/L) for 24 h or left untreated, respectively. Every treatment was duplicated in the same experiment. All the samples were homogenized with 1 ml Trizol (Invitrogen, Life Technologies) and total RNAs were extracted according to the manufacturer’s instructions.
500 ng total RNA was used to synthesize double-strand cDNA and in vitro transcribed to cRNA, purified 10 μg cRNA was used to synthesize 2nd-cycle cDNA and then hydrolyzed by RNase H and purified. Above steps were performed with Ambion WT Expression Kit. 5.5 μg 2nd-cycle cDNA was fragmented and the single-stranded cDNA was labeled with GeneChip2 WT Terminal Labeling Kit and Controls Kit (Affymetrix, PN 702880). About 700 ng fragmented and labeled single-stranded cDNA were hybridized to an Affymetrix GeneChip Human Gene 1.0 ST array, which was washed and stained with GeneChip2 Hybridization, Wash and Stain kit (Affymetrix).
Total RNA from Fadu cells, untreated or treated with lower dose of paclitaxel for 24 h, was processed and hybridized to Affymetrix GeneChip® miRNA 2.0 Array, which recognizes 1,105 separate human miRs in accordance with the Sanger Institute miRBase version 15. Each sample was duplicate for miR expression profile.
Microarray data analysis was done using Significance Analysis of Microarrays (SAM) method, as described before [26]. Gene set enrichment analysis (GSEA) was performed to the differential expression genes with Ingenuity Pathway Analysis (IPA) online software.
Quantitative real-time PCR (qPCR)
Total RNA was synthesized to cDNA using PrimeScript RT reagent kit with gDNA Eraser (Takara, RR074A) for RT-PCR with mixture of oligo-dT and Random Primer (9 mer). The primers used for qPCR validation were list in Supplementary Table 1. Real-time qPCR was performed on CFX-96 (Bio-lab), with endogenous control hActb. Gene expression was calculated relative to expression of hActb endogenous control and adjusted relative to expression in untreated control cells.
miR target prediction and miRNA target correlation
miR target prediction was performed with miRWalk online software. The comparative analysis was done by 5 prediction programs: miRanda, miRDB, miRWalk, RNA22 and TargetScan. 6 miRs induced or repressed by paclitaxel were selected to perform miR target prediction. Genes predicted by greater than or equal to 3 programs were selected as putative downstream target of some miR. The putative downstream genes were done intersection with genes that expression level altered significantly (FDR<10%) following paclitaxel treatment. The overlapped genes were selected to construct miR-gene networks with the aid of Cytoscape 2.8 software.
Protein isolation and western blotting
Fadu cells were treated with 2, 5 or 10 nmol/L of paclitaxel for 24 h or left untreated. Cell pellets were resuspended in 1×SDS loading buffer (1 mmol/L Na3VO4, 10 mmol/L NaF, 1 mmol/L PMSF) containing protease inhibitors. Lysates (20 μg each lane) were applied to SDS-PAGE. Immunoblotting of Abs specific for GAPDH (Abmart, 080922), ERK (Abclonal, A0228) and p-ERK (Cell signaling, #9106S, pT202/204), were detected using HRP-conjugated anti-mouse (Promega) or anti-rabbit (Promega) and visualized by chemiluminescence detection system (Millipore, WBKLS0500).
Results
Fadu cells are moderate sensitive to paclitaxel
To determine chemosensitivity of Fadu cells to paclitaxel, Fadu cells were treated with paclitaxel at different concentrations for 72 h, cell viability was examined by MTS assay and IC50 dose to paclitaxel was calculated. IC50 dose of Fadu to paclitaxel at 72 h is 0.032 μmol/L (R2=0.94) (Figure 1A). According to data reported in DTP Data Search, the mean IC50 of NCI-60 cell panel to paclitxel is 0.009-0.035 μmol/L. So, Fadu cell line is moderate sensitive to paclitaxel.
Figure 1.
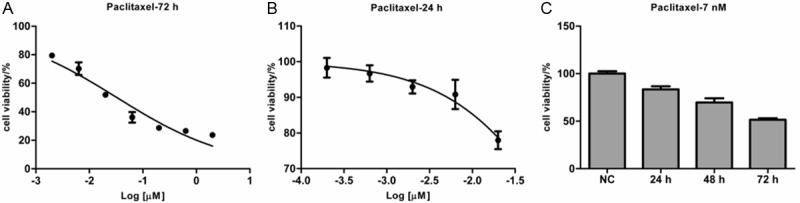
Fadu cells are moderately sensitive to paclitaxel. A: Fadu cells were treated with paclitaxel (0, 2, 6.3, 20, 63, 200, 630, 2000 nmol/L, respectively) for 72 h and then the cell viability was detected by the MTS assay. B: Fadu cells were treated with paclitaxel (0, 0.2, 0.63, 2.0, 6.3 and 20 nmol/L, respectively) for 24 h. The cell viability was detected by the MTS assay and plotted. C: The time-course effect of paclitaxel on Fadu cells. Fadu cells were left untreated or treated with paclitaxel (2 nmol/L) for 24, 48 and 72 h, respectively. Every treatment was triplicate in the same experiment. The cell viability was calculated relatively to the untreated cells at every time point.
To find a suitable dose to inhibit Fadu cells growth by 10% or so, we used a narrower range of paclitaxel concentrations to treat Fadu cells for 24 h. The IC50 of Fadu to paclitaxel at 24 h is 0.147 μmol/L (R2=0.97). As Fadu cells viability was repressed by 7.1% at the concentration of 2 nmol/L (Figure 1B), this concentration is suitable for study on paclitaxel sensitivity. The concentration was far lower than the corresponding IC50 dose.
And then, Fadu cells were treated with 2 nmol/L of paclitaxel for 24, 48 and 72 h or left untreated. The time-course effect of paclitaxel treatment on proliferation of Fadu cells was present in Figure 1C. The results showed that the proliferation inhibition was apparently time-dependent under this condition. Furthermore, when treated with the lower concentration of paclitaxel for 24 h, Fadu cell viability was suppressed by 17% or so.
Gene expression analysis
Fadu cells, treated with a lower dose of paclitaxel for 24 h or left untreated, were applied to gene expression chips. The results of bioinformatics analysis showed that when cells were treated with this moderate condition, expression of 109 genes was significantly (p<0.05) increased by higher than 50%, and that of 58 genes was significantly decreased by higher than 50% following paclitaxel treatment (Table 1). The most markedly expression-altered genes were FOS (FBJ murine osteosarcoma viral oncogene homolog, up to 4.47-fold), JUN (jun proto-oncogene, up to 2.75-fold), SCD (stearoyl-CoA desaturase, down to 0.26-fold), PLD1 (phospholipase D1, phosphatidylcholine-specific, down to 0.40-fold), MRAS (muscle RAS oncogene homolog, down to 0.59-fold) and CP (ceruloplasmin, down to 0.11-fold). IPA results showed that these 167 genes (109 upregulated genes and 58 downregulated genes following paclitaxel treatment) are involved in cell death and survival, lipid metabolism and small molecule biochemistry. Those significantly altered pathways were list in Figure 2. IPA analysis showed these 167 genes were mainly enriched in Superpathway of cholesterol biosynthesis (ACAT2, MSMO1, LSS, FDFT1 and FDPS etc.), complement system (C3, C1R, C1S, CFR and CFB etc.), interferon signaling (IFIT1, IFIT3, IFITM1 and MX1 etc.), mTOR signaling (MRAS, PRKAA2, PLD1, RND3 and EIF4A1 etc.) and IGF1 signaling (MRAS, IGFBP7, JUN and FOS etc.). The former three pathways were predicted to be inactivated, while the latter two pathways were predicted to be induced (Figure 3).
Table 1.
The significantly expression-altered genes following paclitaxel treatment in Fadu cells
| Gene | Probe ID | Fold change | P value | Gene | Probe ID | Fold change | P value |
|---|---|---|---|---|---|---|---|
| FOS | 7975779 | 4.47 | 0.0002 | ADAMTS1 | 8069676 | 1.73 | 0.005 |
| CPA4 | 8136200 | 4.06 | 0.0001 | AFAP1L2 | 7936439 | 1.72 | 0.03 |
| DUSP6 | 7965335 | 3.70 | 0.001 | IL6 | 8131803 | 1.72 | 0.03 |
| DUSP1 | 8115831 | 3.34 | 0.0001 | ODC1 | 8050240 | 1.70 | 0.0004 |
| NT5E | 8120967 | 2.99 | 0.001 | SERPINB8 | 8021653 | 1.69 | 0.02 |
| CTGF | 8129562 | 2.93 | 0.0001 | SPRY4 | 8114797 | 1.69 | 0.01 |
| JUN | 7916609 | 2.75 | 0.01 | RRM2 | 8040223 | 1.69 | 0.03 |
| EGR1 | 8108370 | 2.67 | 0.0002 | CDH5 | 7996264 | 1.69 | 0.002 |
| SNORD102 | 7968232 | 2.59 | 0.03 | CCNE2 | 8151871 | 1.68 | 0.03 |
| IL1RL1 | 8044021 | 2.42 | 0.0004 | IER2 | 8026163 | 1.67 | 0.02 |
| SNORD51 | 8047778 | 2.38 | 0.01 | ROR1 | 7901969 | 1.67 | 0.01 |
| PPP1R15A | 8030128 | 2.28 | 0.005 | GJB3 | 7899932 | 1.66 | 0.003 |
| IER3 | 8178435 | 2.27 | 0.001 | IL1R2 | 8043981 | 1.65 | 0.04 |
| CYR61 | 7902687 | 2.24 | 0.002 | DOCK10 | 8059413 | 1.64 | 0.02 |
| IER3 | 8179704 | 2.16 | 0.001 | SERPINE1 | 8135069 | 1.64 | 0.01 |
| IER3 | 8124848 | 2.16 | 0.001 | THBS1 | 7982597 | 1.64 | 0.002 |
| SERPINB2 | 8021635 | 2.15 | 0.02 | PHLDA1 | 7965040 | 1.63 | 0.01 |
| EFNB2 | 7972713 | 2.10 | 0.01 | EPHA2 | 7912706 | 1.63 | 0.0003 |
| FOSB | 8029693 | 2.08 | 0.05 | ARRDC4 | 7986350 | 1.62 | 0.002 |
| PTGS2 | 7922976 | 1.99 | 0.02 | BRMS1 | 7949603 | 1.61 | 0.02 |
| LOC100127886 | 8066275 | 1.99 | 0.04 | INPP4B | 8102950 | 1.61 | 0.04 |
| IL24 | 7909271 | 1.99 | 0.01 | SLC5A6 | 8051030 | 1.60 | 0.01 |
| FST | 8105302 | 1.98 | 0.03 | CSRNP1 | 8086330 | 1.60 | 0.02 |
| FOSL1 | 7949532 | 1.93 | 0.01 | TRAM2 | 8127051 | 1.60 | 0.001 |
| DUSP4 | 8150076 | 1.92 | 0.01 | SNORA67 | 8004508 | 1.60 | 0.02 |
| DHRS2 | 7973433 | 1.86 | 0.004 | CCDC86 | 7940349 | 1.58 | 0.01 |
| ARL4C | 8059854 | 1.86 | 0.02 | RRP15 | 7909782 | 1.58 | 0.04 |
| TRNAP24P | 7998927 | 1.83 | 0.005 | FAM111B | 7940147 | 1.58 | 0.01 |
| FJX1 | 7939365 | 1.80 | 0.01 | SLIT2 | 8094301 | 1.57 | 0.02 |
| CTNNAL1 | 8163063 | 1.80 | 0.01 | CDH2 | 8022674 | 1.57 | 0.02 |
| MB21D2 | 8092765 | 1.80 | 0.01 | MRPL1 | 8095894 | 1.57 | 0.05 |
| BAG1 | 8160647 | 1.79 | 0.02 | GADD45A | 7902227 | 1.57 | 0.01 |
| GPR39 | 8045336 | 1.79 | 0.00 | DUSP10 | 7924450 | 1.56 | 0.02 |
| SNORD101 | 8122142 | 1.79 | 0.05 | RPL22L1 | 8092067 | 1.56 | 0.02 |
| AKAP12 | 8122807 | 1.77 | 0.02 | ID2 | 8040103 | 1.56 | 0.005 |
| SNORA13 | 8107326 | 1.77 | 0.04 | VGLL1 | 8170179 | 1.56 | 0.02 |
| DUSP5 | 7930413 | 1.75 | 0.00 | LANCL2 | 8132897 | 1.56 | 0.0005 |
| DNER | 8059580 | 1.74 | 0.04 | GDPD3 | 8000799 | 1.56 | 0.01 |
| TRIB1 | 8148304 | 1.74 | 0.004 | NAV3 | 7957298 | 1.56 | 0.05 |
| SNORA62 | 8078918 | 1.73 | 0.003 | MIR22HG | 8011193 | 1.55 | 0.02 |
| CYB5D1 | 8004694 | 1.55 | 0.002 | C1R | 7960744 | 0.47 | 0.002 |
| C8orf33 | 8148955 | 1.55 | 0.01 | MUC1 | 7920642 | 0.47 | 0.02 |
| EPB41L4A-AS1 | 8107321 | 1.55 | 0.001 | CFB | 8178115 | 0.47 | 0.01 |
| VEGFC | 8103822 | 1.55 | 0.02 | C3 | 8033257 | 0.47 | 0.003 |
| PLK3 | 7901054 | 1.54 | 0.01 | RARRES3 | 7940775 | 0.47 | 0.03 |
| TIPIN | 7989915 | 1.54 | 0.01 | CLDN1 | 8092726 | 0.47 | 0.001 |
| HAS2 | 8152617 | 1.54 | 0.03 | FADS1 | 7948612 | 0.47 | 0.001 |
| ZFP36 | 8028652 | 1.54 | 0.02 | GLDC | 8160024 | 0.46 | 0.04 |
| METTL1 | 7964548 | 1.54 | 0.01 | COX20 | 7925561 | 0.46 | 0.0001 |
| ETS1 | 7952601 | 1.53 | 0.002 | MSMO1 | 8098195 | 0.46 | 0.01 |
| OTUB2 | 7976425 | 1.53 | 0.03 | PCSK9 | 7901696 | 0.46 | 0.01 |
| KLF6 | 7931810 | 1.53 | 0.002 | PLCG2 | 7997453 | 0.46 | 0.001 |
| SAMD15 | 7975971 | 1.53 | 0.01 | TRIM22 | 7938035 | 0.46 | 0.01 |
| SURF2 | 8159008 | 1.53 | 0.01 | GBP4 | 7917561 | 0.45 | 0.02 |
| STAG1 | 8090898 | 1.52 | 0.03 | ALDH3B2 | 7949882 | 0.45 | 0.02 |
| ATP6V1D | 7979698 | 1.52 | 0.04 | SERPINB13 | 8021603 | 0.45 | 0.01 |
| TOE1 | 7901091 | 1.52 | 0.002 | ZMAT1 | 8174119 | 0.44 | 0.01 |
| MRTO4 | 7898549 | 1.52 | 0.003 | TCP11L2 | 7958262 | 0.44 | 0.03 |
| RND3 | 8055688 | 1.52 | 0.02 | LOC440173 | 8162183 | 0.44 | 0.01 |
| SPHK1 | 8010061 | 1.51 | 0.04 | BTBD8 | 7902965 | 0.44 | 0.02 |
| ENC1 | 8112615 | 1.51 | 0.04 | C4orf34 | 8099912 | 0.44 | 0.002 |
| GPATCH4 | 7921076 | 1.51 | 0.002 | ASS1 | 8158671 | 0.43 | 0.003 |
| TMCO1 | 7921987 | 1.51 | 0.01 | TMEM154 | 8103226 | 0.43 | 0.02 |
| FAM171A1 | 7932243 | 1.51 | 0.002 | HSD17B7P2 | 7927082 | 0.43 | 0.01 |
| ERRFI1 | 7912157 | 1.51 | 0.01 | KIAA1107 | 7902977 | 0.42 | 0.002 |
| CDCA5 | 7949364 | 1.51 | 0.01 | OAS2 | 7958913 | 0.42 | 0.004 |
| GPAM | 7936322 | 1.50 | 0.01 | CFI | 8102328 | 0.41 | 0.04 |
| AEN | 7985767 | 1.50 | 0.01 | PLD1 | 8092134 | 0.40 | 0.01 |
| RUNX1 | 8070194 | 1.50 | 0.002 | HERC5 | 8096361 | 0.40 | 0.004 |
| MME | 8083494 | 0.50 | 0.02 | METTL7A | 7955441 | 0.39 | 0.002 |
| RAET1E | 8130151 | 0.50 | 0.02 | CCL5 | 8014316 | 0.39 | 0.01 |
| PLA2R1 | 8056151 | 0.50 | 0.003 | SEPP1 | 8111915 | 0.38 | 0.01 |
| ALDOC | 8013660 | 0.49 | 0.001 | OASL | 7967117 | 0.38 | 0.001 |
| A4GALT | 8076497 | 0.49 | 0.01 | CASP1 | 7951397 | 0.38 | 0.03 |
| GRAMD1C | 8081758 | 0.49 | 0.02 | DDIT4 | 7928308 | 0.37 | 0.002 |
| HMGCS1 | 8111941 | 0.48 | 0.002 | TNFSF10 | 8092169 | 0.37 | 0.01 |
| LSS | 8070961 | 0.48 | 0.0002 | IFI44L | 7902541 | 0.37 | 0.01 |
| SREBF2 | 8073522 | 0.48 | 0.01 | DDX60 | 8103563 | 0.35 | 0.01 |
| CFB | 8118345 | 0.47 | 0.01 | ACSS2 | 8062041 | 0.34 | 0.0005 |
| KYNU | 8045539 | 0.47 | 0.002 | C1S | 7953603 | 0.34 | 0.01 |
| SCNN1A | 7960529 | 0.34 | 0.0003 | ||||
| STARD4 | 8113491 | 0.32 | 0.01 | ||||
| INSIG1 | 8137526 | 0.30 | 0.001 | ||||
| SERPINB3 | 8023688 | 0.29 | 0.04 | ||||
| SCD | 7929816 | 0.26 | 0.001 | ||||
| SLCO4C1 | 8113369 | 0.21 | 0.0001 | ||||
| CP | 8091385 | 0.11 | 0.001 |
Figure 2.
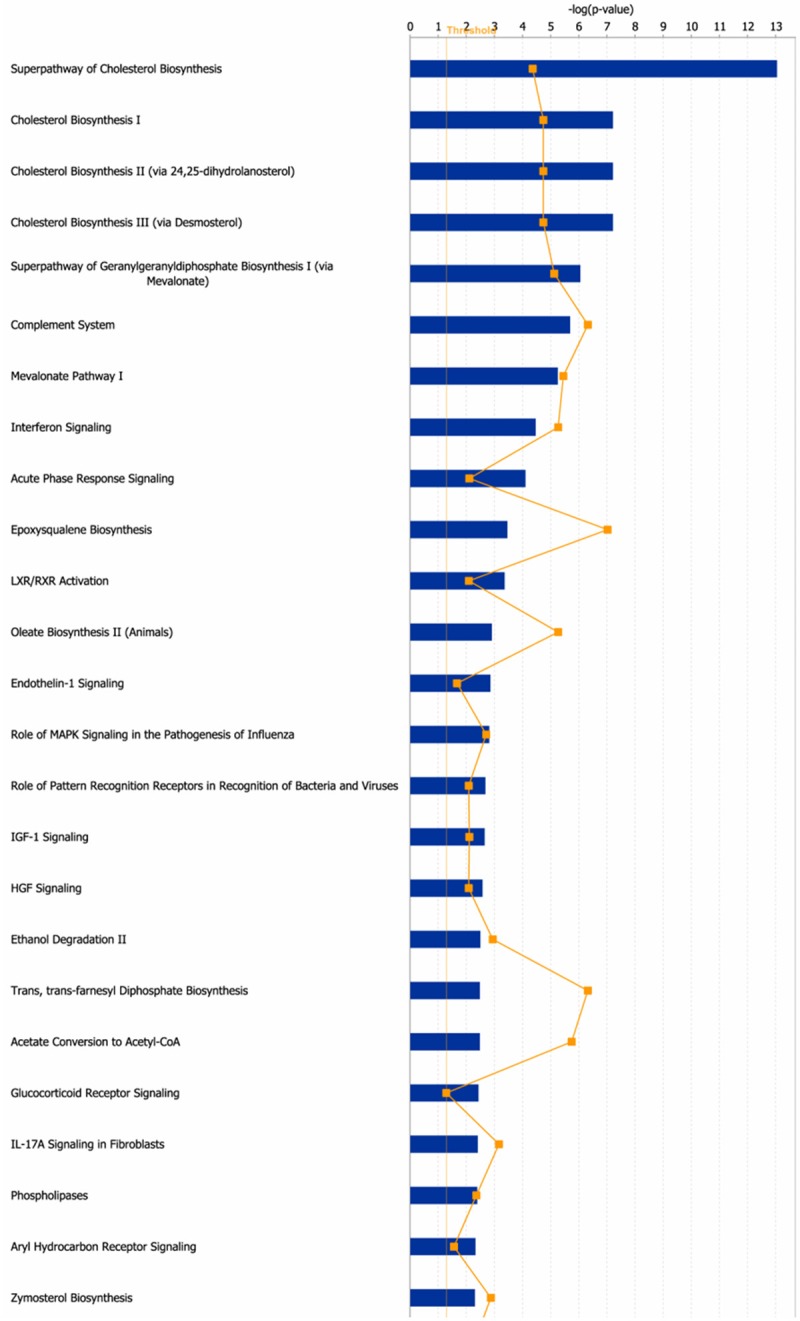
The canonical pathways for the differentially expressed genes in Fadu cells following paclitaxel treatment. 167 genes whose expression altered by higher than 2-fold after paclitaxel treatment were applied to IPA. The canonical pathways (p<0.05) were shown in this figure. The thresh line represents p=0.05. The ratio means the proportion that the amounts of genes involved in some pathway account for all the genes involved in this pathway.
Figure 3.
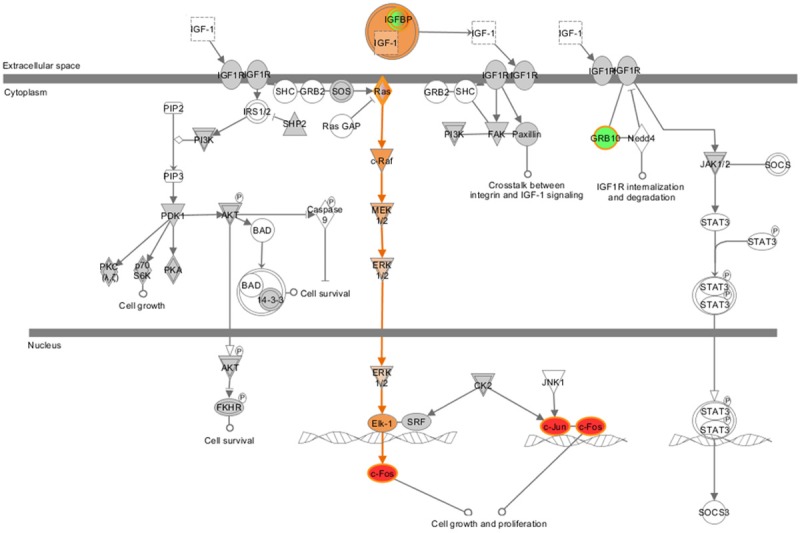
IGF1 signaling was induced by paclitaxel in Fadu cells. This figure was derived from IPA. The colored molecules were genes whose expression altered significantly in Fadu cells following paclitaxel treatment. The red color represented up-regulated genes, while the green color represented down-regulated genes, the orange color represented genes whose expression was predicted to be increased.
qPCR validation of gene expression
Then 9 genes were selected for further validating the fold change determined by microarray. Within these genes, expression of 3 genes (FOS, JUN and RND3) was up-regulated and that of 5 genes (IGFBP7, MRAS, PRKAA2, PLD1 and CCL5) was down-regulated, while one gene (EIF4A1) expression was not changed markedly in microarray data following paclitaxel treatment. As showed in Figure 4, the expression trends of 7 genes were consistence between microarray data and qPCR results following paclitaxel treatment, although expression fold change varied to some extents. For EIF4A1 and MRAS, qPCR data showed their expression was increased, which was in contrast to microarray data. In terms of expression trends, 7 of 9 (78%) genes induced or repressed following paclitaxel treatment were positively validated by qPCR. These data suggested that microarray data were mostly reliable whereas expression of some genes needs to be validated by qPCR. FOS, JUN, RND3, EIF4A1 and MRAS were significantly upregulated, while IGFBP7, PRKAA2, PLD1 and CCL5 were markedly downregulated.
Figure 4.
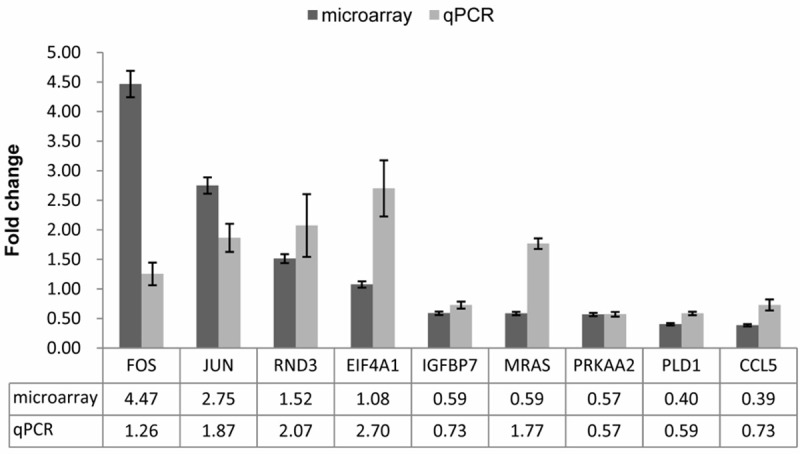
qPCR validation for microarray data. 9 genes were selected to perform qPCR. The expression was calculated relative to expression in untreated cells. The change folds determined by qPCR and microarray were plotted, respectively. Bars represent the standard errors.
miR expression analysis
Bioinformatics analysis showed that expression of only tens of miRs was markedly altered after paclitaxel treatment. Expression of 5 miRs (Has-miR-112, 7, 1304, 222*, 29b-1*) was significantly increased by higher than 100% and that of one miR (Has-miR-210) was markedly decreased by higher than 100% (Table 2).
Table 2.
The significantly expression-altered miRs following paclitaxel treatment in Fadu cells
| Probe Set ID | Fold change | p value |
|---|---|---|
| hsa-miR-122 | 5.52 | 0.03 |
| hsa-miR-7 | 3.26 | 0.03 |
| hsa-miR-1304 | 3.10 | 0.03 |
| hsa-miR-222-star | 2.71 | 0.02 |
| hsa-miR-29b-1-star | 2.05 | 0.04 |
| hsa-miR-210 | 0.38 | 0.01 |
MiRs-genes network construction
To construct the network between significantly expression-altered miRs and genes, 6 miRs whose expression altered the most markedly were selected to perform miR target prediction and miRNA target correlation. For example, miR-112 was predicted to mediate expression of 2226 genes (predicted by ≥3 programs) with the aid of miRWalk online software. Then this 2226 genes set was done intersection with the down-regulated 58 genes and the overlapped genes were FADS1, ALDOC, TNFSF10, CCL5, GBP4, MUC1, ALDH3B2, SERPINB3. Thus the downregulated expression of these 8 genes was putatively mediated by the upregulated expression of miR-122 following paclitaxel treatment. For the other 5 miRs, we did the prediction and target correlation according to the same procedure and found that there were 26 genes whose expression was putatively been mediated by these 6 miRs, the network was constructed with the aid of Cytoscape 2.8 software (Figure 5). Expression-increased miR-29b-1* putatively mediated the decreased expression of SCD, PLD1 and INSIG1, expression-decreased miR-210 putatively mediated the upregulation of ARRDC4, EPHA2, IER3, OTUB2 and TRIB1, while the down-regulated TNFSF10 was putatively mediated by expression-increased miR-122, miR-1304 and miR-222*.
Figure 5.
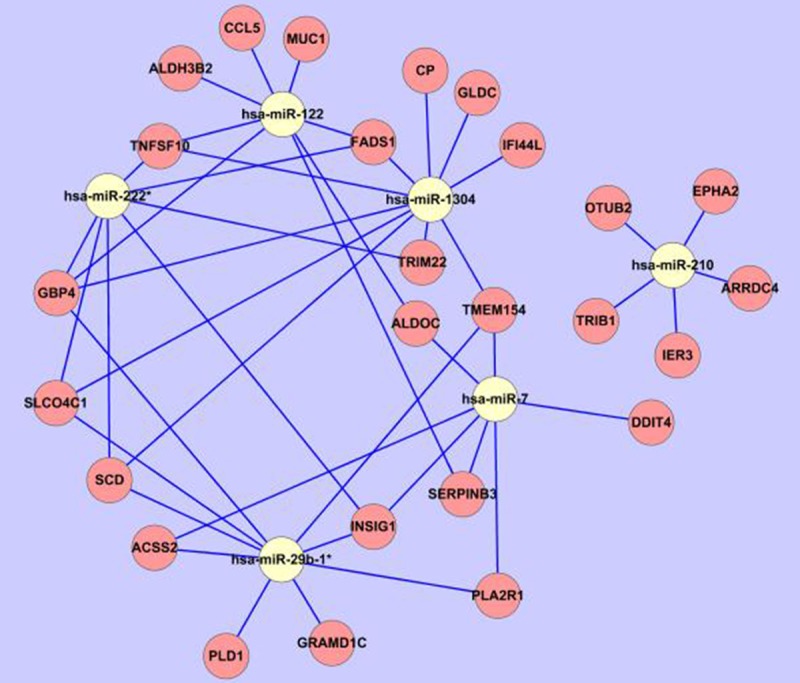
MiR-gene network. The most significantly expression-altered 6 miRs were respectively applied to miRWalk online software to predict the downstream putative target genes. And then the targets were done intersection with the expression-altered genes (109 upregulated genes or 58 downregulated genes, respectively) determined by microarray. The overlapped genes were considered as potential downstream targets and used to construct the miRs-genes network with the aid of Cytoscape 2.8 software. The white circle represented the miR, while the pink circle represented the genes; the blue line represented the regulation from miR to gene.
Signaling pathway detection at protein level
To investigate the underlying mechanism by which paclitaxel exerts its cytotoxic effect on cancer cells, immunoblotting experiments were done with ERK/p-ERK antibodies for Fadu cells treated with three different doses of paclitaxel or untreated. The results showed that when treated with the lowest dose (2 nmol/L) of paclitaxel, the phosphorylated ERK (p-ERK) of Fadu cells was moderately upregulated (Figure 6), which was consistent with the predicted results by IPA (Figure 3). However, when the concentration of paclitaxel was increased stepwise, the p-ERK was dramatically downregulated (Figure 6).
Figure 6.
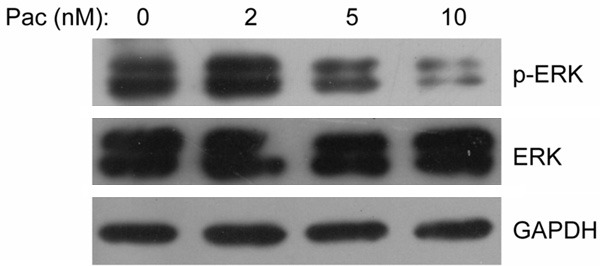
ERK signaling was induced by low dose of paclitaxel but repressed by high dose of paclitaxel. Fadu cells were left untreated or treated with three distinct dose of paclitaxel (2, 5 and 10 nmol/L), and then the samples were collected for western blotting. The ERK and p-ERK protein were detected as described in Materials and Methods.
Discussion
Hypopharynx cancer (HPC), a rare type of HNSCC, generally has a poor prognosis and is difficult to treat. Paclitaxel has been proved to be active in treatment and larynx preservation of HNSCC, however, the clinical data that only a half of patients responding to paclitaxel makes it urgent to figure out the biomarkers for paclitaxel-based treatment in HPC patients to improve the therapy effect.
In this work, Fadu cells, untreated or treated with low dose of paclitaxel for 24 h, were applied to DNA microarray chips. The differential expression in mRNAs and miRs was analyzed and the network between expression-altered mRNAs and miRs was constructed.
Fadu cells were moderate sensitive to paclitaxel. Following low dose (2 nmol/L) of paclitaxel treatment, expression of 167 genes (109 upregulated genes and 58 downregulated genes) was significantly altered. IPA results showed that these genes are involved in cell death and survival, lipid metabolism and small molecule biochemistry. The mainly altered pathways were superpathway of cholesterol biosynthesis, complement system, interferon signaling, mTOR signaling and IGF1 signaling.
Deregulated energy metabolism in cancer cells may play a role in supporting the large-scale biosynthetic programs that are required for active cell proliferation, and therefore have been proposed to be an emerging hallmark of cancer [27]. Recent evidences have identified substantial overlap between metabolic and oncogenic biochemical pathways, suggesting novel approaches to cancer intervention. For example, cholesterol lowering statins act as chemopreventive agents in prostate, glioma and other cancers [28-30]. In our data, cholesterol biosynthesis pathway was predicted to be inactivated following paclitaxel treatment, suggesting that downregulation of cholesterol biosynthesis caused by paclitaxel may be one underlying mechanism by which paclitaxel exert its cytotoxic effect on cancer cells. Therefore, cholesterol biosynthesis may be a potential therapeutic target for HPC patients.
MRAS is a member of the Ras family of small GTPases. These membrane-associated proteins function as signal transducers in multiple processes including cell growth and differentiation, and dysregulation of MRAS signaling has been associated with many types of cancer [31,32]. In our microarray data, MARS was downregulated following paclitaxel treatment; however, subsequent validation by qPCR showed MRAS was induced by paclitaxel. Therefore, the IPA results were modified with qPCR data and the mTOR signaling and IGF1 signaling were predicted to be activated.
The mammalian target of rapamycin (mTOR) signaling pathway integrates both intracellular and extracellular signals and serves as a central regulator of cell metabolism, growth, proliferation and survival. Faried et al reported in 2007 that inhibition of mTOR by rapamycin increases chemosensitivity of CaSki (cervical cancer) cells to paclitaxel [33]. Abrams et al suggested that combinations of signal transduction inhibitors (such as mTOR inhibition) and chemotherapy (such as paclitaxel) enhance therapeutic efficacy in non-oncogene addicted cells [34]. Our data showed that paclitaxel induced mTOR signaling at lower concentration (2 nmol/L), suggesting the initiation of resistance to paclitaxel mediated by mTOR signaling in a very short time (24 h).
Furthermore, IGF1 signaling was predicted to be activated by paclitaxel in our data. IGF1 has been suggested to play an important role in tumor progression [35,36]. It is proposed that IGF1-induced cell proliferation was mediated by the PI3K/Akt/mTOR signaling pathway [37]. Since paclitaxel induced the mTOR signaling and IGF1 signaling in our data, these results together indicate the combination of mTOR inhibition and paclitaxel may be one possible solution for HPC patients resistant to paclitaxel and this hypothesis deserves further validation in more cancer cells and mouse models and patient samples.
Acknowledgements
This study was supported by Shanghai Science and Technology Development Fund (No. 11DZ1921705), China.
Disclosure of conflict of interest
None.
Supporting Information
References
- 1.DeVita VT, Lawrence TS, Rosenberg SA. DeVita, Hellman, and Rosenberg’s cancer: principles & practice of oncology. Philadelphia: Wolters Kluwer Health/Lippincott Williams & Wilkins; 2011. [Google Scholar]
- 2.Argiris A, Karamouzis MV, Raben D, Ferris RL. Head and neck cancer. Lancet. 2008;371:1695–1709. doi: 10.1016/S0140-6736(08)60728-X. [DOI] [PMC free article] [PubMed] [Google Scholar]
- 3.Spector JG, Sessions DG, Haughey BH, Chao KS, Simpson J, El Mofty S, Perez CA. Delayed regional metastases, distant metastases, and second primary malignancies in squamous cell carcinomas of the larynx and hypopharynx. Laryngoscope. 2001;111:1079–1087. doi: 10.1097/00005537-200106000-00028. [DOI] [PubMed] [Google Scholar]
- 4.Forastiere AA, Goepfert H, Maor M, Pajak TF, Weber R, Morrison W, Glisson B, Trotti A, Ridge JA, Chao C, Peters G, Lee DJ, Leaf A, Ensley J, Cooper J. Concurrent chemotherapy and radiotherapy for organ preservation in advanced laryngeal cancer. N Engl J Med. 2003;349:2091–2098. doi: 10.1056/NEJMoa031317. [DOI] [PubMed] [Google Scholar]
- 5.Pfreundner L, Hoppe F, Willner J, Preisler V, Bratengeier K, Hagen R, Helms J, Flentje M. Induction chemotherapy with paclitaxel and cisplatin and CT-based 3D radiotherapy in patients with advanced laryngeal and hypopharyngeal carcinomas--a possibility for organ preservation. Radiother Oncol. 2003;68:163–170. doi: 10.1016/s0167-8140(03)00076-8. [DOI] [PubMed] [Google Scholar]
- 6.Lefebvre JL, Rolland F, Tesselaar M, Bardet E, Leemans CR, Geoffrois L, Hupperets P, Barzan L, de Raucourt D, Chevalier D, Licitra L, Lunghi F, Stupp R, Lacombe D, Bogaerts J, Horiot JC, Bernier J, Vermorken JB EORTC Head and Neck Cancer Cooperative Group; EORTC Radiation Oncology Group. Phase 3 randomized trial on larynx preservation comparing sequential vs alternating chemotherapy and radiotherapy. J Natl Cancer Inst. 2009;101:142–152. doi: 10.1093/jnci/djn460. [DOI] [PMC free article] [PubMed] [Google Scholar]
- 7.Argiris A. Induction chemotherapy for head and neck cancer: will history repeat itself? J Natl Compr Canc Netw. 2005;3:393–403. doi: 10.6004/jnccn.2005.0020. [DOI] [PubMed] [Google Scholar]
- 8.Vermorken JB, Remenar E, van Herpen C, Gorlia T, Mesia R, Degardin M, Stewart JS, Jelic S, Betka J, Preiss JH, van den Weyngaert D, Awada A, Cupissol D, Kienzer HR, Rey A, Desaunois I, Bernier J, Lefebvre JL EORTC 24971/TAX 323 Study Group. Cisplatin, fluorouracil, and docetaxel in unresectable head and neck cancer. N Engl J Med. 2007;357:1695–1704. doi: 10.1056/NEJMoa071028. [DOI] [PubMed] [Google Scholar]
- 9.Posner MR, Hershock DM, Blajman CR, Mickiewicz E, Winquist E, Gorbounova V, Tjulandin S, Shin DM, Cullen K, Ervin TJ, Murphy BA, Raez LE, Cohen RB, Spaulding M, Tishler RB, Roth B, Viroglio Rdel C, Venkatesan V, Romanov I, Agarwala S, Harter KW, Dugan M, Cmelak A, Markoe AM, Read PW, Steinbrenner L, Colevas AD, Norris CM Jr, Haddad RI TAX 324 Study Group. Cisplatin and fluorouracil alone or with docetaxel in head and neck cancer. N Engl J Med. 2007;357:1705–1715. doi: 10.1056/NEJMoa070956. [DOI] [PubMed] [Google Scholar]
- 10.Forastiere AA, Shank D, Neuberg D, Taylor SG 4th, DeConti RC, Adams G. Final report of a phase II evaluation of paclitaxel in patients with advanced squamous cell carcinoma of the head and neck: an Eastern Cooperative Oncology Group trial (PA390) Cancer. 1998;82:2270–2274. [PubMed] [Google Scholar]
- 11.Gebbia V, Testa A, Cannata G, Gebbia N. Single agent paclitaxel in advanced squamous cell head and neck carcinoma. Eur J Cancer. 1996;32A:901–902. doi: 10.1016/0959-8049(96)00002-0. [DOI] [PubMed] [Google Scholar]
- 12.Moosmann P, Egli F, Stahel RA, Jost L. Weekly paclitaxel and carboplatin combination chemotherapy in patients with advanced squamous cell carcinoma of the head and neck. Onkologie. 2003;26:568–572. doi: 10.1159/000074153. [DOI] [PubMed] [Google Scholar]
- 13.Hitt R, Paz-Ares L, Hidalgo M, Colomer R, Brandariz A, Pena M, Alvarez-Vicent J, Hornedo J, Cortes-Funes H. Phase I/II study of paclitaxel/cisplatin as first-line therapy for locally advanced head and neck cancer. Semin Oncol. 1997 Dec;24(Suppl 19):S19-20–S19-24. [PubMed] [Google Scholar]
- 14.Garden AS, Harris J, Vokes EE, Forastiere AA, Ridge JA, Jones C, Horwitz EM, Glisson BS, Nabell L, Cooper JS, Demas W, Gore E. Preliminary results of Radiation Therapy Oncology Group 97-03: a randomized phase ii trial of concurrent radiation and chemotherapy for advanced squamous cell carcinomas of the head and neck. J. Clin. Oncol. 2004;22:2856–2864. doi: 10.1200/JCO.2004.12.012. [DOI] [PubMed] [Google Scholar]
- 15.Cmelak AJ, Li S, Goldwasser MA, Murphy B, Cannon M, Pinto H, Rosenthal DI, Gillison M, Forastiere AA. Phase II trial of chemoradiation for organ preservation in resectable stage III or IV squamous cell carcinomas of the larynx or oropharynx: results of Eastern Cooperative Oncology Group Study E2399. J. Clin. Oncol. 2007;25:3971–3977. doi: 10.1200/JCO.2007.10.8951. [DOI] [PubMed] [Google Scholar]
- 16.Rosell R, Scagliotti G, Danenberg KD, Lord RV, Bepler G, Novello S, Cooc J, Crino L, Sanchez JJ, Taron M, Boni C, De Marinis F, Tonato M, Marangolo M, Gozzelino F, Di Costanzo F, Rinaldi M, Salonga D, Stephens C. Transcripts in pretreatment biopsies from a three-arm randomized trial in metastatic non-small-cell lung cancer. Oncogene. 2003;22:3548–3553. doi: 10.1038/sj.onc.1206419. [DOI] [PubMed] [Google Scholar]
- 17.Verrills NM, Po’uha ST, Liu ML, Liaw TY, Larsen MR, Ivery MT, Marshall GM, Gunning PW, Kavallaris M. Alterations in gamma-actin and tubulin-targeted drug resistance in childhood leukemia. J Natl Cancer Inst. 2006;98:1363–1374. doi: 10.1093/jnci/djj372. [DOI] [PubMed] [Google Scholar]
- 18.Dan S, Tsunoda T, Kitahara O, Yanagawa R, Zembutsu H, Katagiri T, Yamazaki K, Nakamura Y, Yamori T. An integrated database of chemosensitivity to 55 anticancer drugs and gene expression profiles of 39 human cancer cell lines. Cancer Res. 2002;62:1139–1147. [PubMed] [Google Scholar]
- 19.Ahmed AA, Mills AD, Ibrahim AE, Temple J, Blenkiron C, Vias M, Massie CE, Iyer NG, McGeoch A, Crawford R, Nicke B, Downward J, Swanton C, Bell SD, Earl HM, Laskey RA, Caldas C, Brenton JD. The extracellular matrix protein TGFBI induces microtubule stabilization and sensitizes ovarian cancers to paclitaxel. Cancer Cell. 2007;12:514–527. doi: 10.1016/j.ccr.2007.11.014. [DOI] [PMC free article] [PubMed] [Google Scholar]
- 20.Cochrane DR, Spoelstra NS, Howe EN, Nordeen SK, Richer JK. MicroRNA-200c mitigates invasiveness and restores sensitivity to microtubule-targeting chemotherapeutic agents. Mol Cancer Ther. 2009;8:1055–1066. doi: 10.1158/1535-7163.MCT-08-1046. [DOI] [PMC free article] [PubMed] [Google Scholar]
- 21.Fujita Y, Kojima K, Ohhashi R, Hamada N, Nozawa Y, Kitamoto A, Sato A, Kondo S, Kojima T, Deguchi T, Ito M. MiR-148a attenuates paclitaxel resistance of hormone-refractory, drug-resistant prostate cancer PC3 cells by regulating MSK1 expression. J Biol Chem. 2010;285:19076–19084. doi: 10.1074/jbc.M109.079525. [DOI] [PMC free article] [PubMed] [Google Scholar]
- 22.Zhou M, Liu Z, Zhao Y, Ding Y, Liu H, Xi Y, Xiong W, Li G, Lu J, Fodstad O, Riker AI, Tan M. MicroRNA-125b confers the resistance of breast cancer cells to paclitaxel through suppression of pro-apoptotic Bcl-2 antagonist killer 1 (Bak1) expression. J Biol Chem. 2010;285:21496–21507. doi: 10.1074/jbc.M109.083337. [DOI] [PMC free article] [PubMed] [Google Scholar]
- 23.Ren Y, Zhou X, Mei M, Yuan XB, Han L, Wang GX, Jia ZF, Xu P, Pu PY, Kang CS. MicroRNA-21 inhibitor sensitizes human glioblastoma cells U251 (PTEN-mutant) and LN229 (PTEN-wild type) to taxol. BMC Cancer. 2010;10:27. doi: 10.1186/1471-2407-10-27. [DOI] [PMC free article] [PubMed] [Google Scholar]
- 24.Du L, Subauste MC, DeSevo C, Zhao Z, Baker M, Borkowski R, Schageman JJ, Greer R, Yang CR, Suraokar M, Wistuba II, Gazdar AF, Minna JD, Pertsemlidis A. miR-337-3p and its targets STAT3 and RAP1A modulate taxane sensitivity in non-small cell lung cancers. PLoS One. 2012;7:e39167. doi: 10.1371/journal.pone.0039167. [DOI] [PMC free article] [PubMed] [Google Scholar]
- 25.Singh S, Chitkara D, Mehrazin R, Behrman SW, Wake RW, Mahato RI. Chemoresistance in prostate cancer cells is regulated by miRNAs and Hedgehog pathway. PLoS One. 2012;7:e40021. doi: 10.1371/journal.pone.0040021. [DOI] [PMC free article] [PubMed] [Google Scholar]
- 26.Tusher VG, Tibshirani R, Chu G. Significance analysis of microarrays applied to the ionizing radiation response. Proc Natl Acad Sci U S A. 2001;98:5116–5121. doi: 10.1073/pnas.091062498. [DOI] [PMC free article] [PubMed] [Google Scholar]
- 27.Hanahan D, Weinberg RA. Hallmarks of cancer: the next generation. Cell. 2011;144:646–674. doi: 10.1016/j.cell.2011.02.013. [DOI] [PubMed] [Google Scholar]
- 28.Breau RH, Karnes RJ, Jacobson DJ, McGree ME, Jacobsen SJ, Nehra A, Lieber MM, St Sauver JL. The association between statin use and the diagnosis of prostate cancer in a population based cohort. J Urol. 2010;184:494–499. doi: 10.1016/j.juro.2010.03.149. [DOI] [PMC free article] [PubMed] [Google Scholar]
- 29.Jacobs EJ, Newton CC, Thun MJ, Gapstur SM. Long-term use of cholesterol-lowering drugs and cancer incidence in a large United States cohort. Cancer Res. 2011;71:1763–1771. doi: 10.1158/0008-5472.CAN-10-2953. [DOI] [PubMed] [Google Scholar]
- 30.Tapia-Perez JH, Kirches E, Mawrin C, Firsching R, Schneider T. Cytotoxic effect of different statins and thiazolidinediones on malignant glioma cells. Cancer Chemother Pharmacol. 2011;67:1193–1201. doi: 10.1007/s00280-010-1535-2. [DOI] [PubMed] [Google Scholar]
- 31.Kimmelman AC, Osada M, Chan AM. R-Ras3, a brain-specific Ras-related protein, activates Akt and promotes cell survival in PC12 cells. Oncogene. 2000;19:2014–2022. doi: 10.1038/sj.onc.1203530. [DOI] [PubMed] [Google Scholar]
- 32.Kimmelman AC, Nunez Rodriguez N, Chan AM. R-Ras3/M-Ras induces neuronal differentiation of PC12 cells through cell-type-specific activation of the mitogen-activated protein kinase cascade. Mol Cell Biol. 2002;22:5946–5961. doi: 10.1128/MCB.22.16.5946-5961.2002. [DOI] [PMC free article] [PubMed] [Google Scholar]
- 33.Faried LS, Faried A, Kanuma T, Nakazato T, Tamura T, Kuwano H, Minegishi T. Inhibition of the mammalian target of rapamycin (mTOR) by rapamycin increases chemosensitivity of CaSki cells to paclitaxel. Eur J Cancer. 2006;42:934–947. doi: 10.1016/j.ejca.2005.12.018. [DOI] [PubMed] [Google Scholar]
- 34.Abrams SL, Steelman LS, Shelton JG, Chappell W, Basecke J, Stivala F, Donia M, Nicoletti F, Libra M, Martelli AM, McCubrey JA. Enhancing therapeutic efficacy by targeting non-oncogene addicted cells with combinations of signal transduction inhibitors and chemotherapy. Cell Cycle. 2010;9:1839–1846. doi: 10.4161/cc.9.9.11544. [DOI] [PMC free article] [PubMed] [Google Scholar]
- 35.Gao Y, Katki H, Graubard B, Pollak M, Martin M, Tao Y, Schoen RE, Church T, Hayes RB, Greene MH, Berndt SI. Serum IGF1, IGF2 and IGFBP3 and risk of advanced colorectal adenoma. Int J Cancer. 2012;131:E105–113. doi: 10.1002/ijc.26438. [DOI] [PMC free article] [PubMed] [Google Scholar]
- 36.Endogenous Hormones and Breast Cancer Collaborative Group. Key TJ, Appleby PN, Reeves GK, Roddam AW. Insulin-like growth factor 1 (IGF1), IGF binding protein 3 (IGFBP3), and breast cancer risk: pooled individual data analysis of 17 prospective studies. Lancet Oncol. 2010;11:530–542. doi: 10.1016/S1470-2045(10)70095-4. [DOI] [PMC free article] [PubMed] [Google Scholar]
- 37.Lau MT, Leung PC. The PI3K/Akt/mTOR signaling pathway mediates insulin-like growth factor 1-induced E-cadherin down-regulation and cell proliferation in ovarian cancer cells. Cancer Lett. 2012;326:191–198. doi: 10.1016/j.canlet.2012.08.016. [DOI] [PubMed] [Google Scholar]
Associated Data
This section collects any data citations, data availability statements, or supplementary materials included in this article.