

Abstract
Background
There is a strong link between urbanization and type 2 diabetes mellitus. Although a multitude of mechanisms have been proposed, there are no studies evaluating the impact of ambient air pollutants and the propensity to develop type 2 diabetes mellitus. We hypothesized that exposure to ambient fine particulate matter (<2.5 μm; PM2.5) exaggerates diet-induced insulin resistance, adipose inflammation, and visceral adiposity.
Methods and Results
Male C57BL/6 mice were fed high-fat chow for 10 weeks and randomly assigned to concentrated ambient PM2.5 or filtered air (n=14 per group) for 24 weeks. PM2.5-exposed C57BL/6 mice exhibited marked whole-body insulin resistance, systemic inflammation, and an increase in visceral adiposity. PM2.5 exposure induced signaling abnormalities characteristic of insulin resistance, including decreased Akt and endothelial nitric oxide synthase phosphorylation in the endothelium and increased protein kinase C expression. These abnormalilties were associated with abnormalities in vascular relaxation to insulin and acetylcholine. PM2.5 increased adipose tissue macrophages (F4/80+ cells) in visceral fat expressing higher levels of tumor necrosis factor-α/interleukin-6 and lower interleukin-10/N-acetyl-galactosamine specific lectin 1. To test the impact of PM2.5 in eliciting direct monocyte infiltration into fat, we rendered FVBN mice expressing yellow fluorescent protein (YFP) under control of a monocyte-specific promoter (c-fms, c-fmsYFP) diabetic over 10 weeks and then exposed these mice to PM2.5 or saline intratracheally. PM2.5 induced YFP cell accumulation in visceral fat and potentiated YFP cell adhesion in the microcirculation.
Conclusion
PM2.5 exposure exaggerates insulin resistance and visceral inflammation/adiposity. These findings provide a new link between air pollution and type 2 diabetes mellitus.
Keywords: air pollution, diabetes mellitus, macrophage, obesity
Substantial epidemiological evidence implicates air pollution as a major adverse risk factor with serious consequences on human health in both industrialized and developing countries.1,2 Recent data from large population cohorts have provided compelling associations between ambient PM2.5 pollution and increased cardiovascular morbidity and mortality.3,4 Substantial data exist implicating fine particulate matter (diameter <2.5 μm; PM2.5) as a major mediator of cardiovascular effects, including elevations in blood pressure and acute coronary syndromes.5,6 A major component of PM2.5 is pollutant particles generated as a consequence of urbanization, including automobile exhaust and particles generated from power plants. An increasing number of associative studies have suggested that exposure to low concentrations of inhaled environmental pollutants might be associated with a propensity to chronic diseases, including type 2 diabetes mellitus.7,8 Although a number of factors such as increased caloric intake and reduced physical activity undoubtedly play an important part in the genesis of these disorders, there is cumulative evidence that type 2 diabetes mellitus is a chronic inflammatory state aggravated by factors that promote inflammation at the level of vasculature and adipose tissue.9–11 Accordingly, we hypothesized that exposure to PM2.5 exaggerates insulin resistance (IR) and adipose inflammation and tested this hypothesis in a model of diet-induced obesity.
Methods
A detailed description of all materials and methods is provided in the online-only Data Supplement.
Animals and Animal Care
Six-week-old male C57BL/6 mice (The Jackson Laboratories, Bar Harbor, Me) were equilibrated for 2 weeks before being fed high-fat chow (HFC; 42% from fat-adjusted calorie diet, TD 88137, Harlan, Indianapolis, Ind; n=28) for 10 weeks and then randomized to exposure (see below). Ten-week-old transgenic mice expressing yellow fluorescent protein (YFP) under a monocyte-specific promoter (c-fms [CD115]; c-fmsYFP)12 were fed normal chow or were rendered diabetic by the use of a protocol similar to that stated above over 10 weeks (n=8) before being subjected to intratracheal PM2.5 exposure. The Committees on Use and Care of Animals of Ohio State University and New York University approved all experimental procedures.
Exposures to PM2.5
Ambient Whole-Body Inhalational Protocol
C57BL/6 mice were exposed in vivo from October 9, 2006, to March 26, 2007, for a total duration of 128 days, to concentrated PM2.5 composed of the northeastern regional background at the AJ Lanza Laboratory in the Department of Environmental Medicine at New York University, which was characterized previously.13 The concentrated PM2.5 was generated by a versatile aerosol concentration enrichment system14 that was modified for longer-term exposures.15 The mice were exposed to PM2.5 (n=14) for 6 h/d for 5 d/wk. The filtered air (FA; n=14) control mice were exposed to an identical protocol except a high-efficiency particulate air filter (Pall Life Sciences, East Hills, NY) was positioned in the inlet valve to the exposure system to remove all of the particles from that airstream, as detailed previously.16
Intratracheal Installation Protocol
c-fmsYFP mice were randomized to intratracheally delivered PM2.5 (1.6 mg/kg, collected from the filters after the exposure above) suspended in 25μL sterile PBS or 25μL sterile PBS (control) over a 5-minute period twice per week for 10 weeks, as detailed previously.17 PM2.5 in PBS was vortexed before instillation. Prior studies have demonstrated that delivery with this route results in similar levels of pulmonary distribution and bioavailability compared with ambient exposure.18
Measures of Glucose Homeostasis
Mice were fasted overnight before the body weight was measured and lipid profile and intraperitoneal glucose tolerance tests were performed before and after PM2.5 whole-body exposure in C57BL/6 mice. The intraperitoneal glucose tolerance test also was performed in c-fmsYFP mice after 10 weeks of normal chow/HFC feeding. Lipid profile was tested by Cholestech LDX (Hayward, Calif). Fasting blood glucose concentration was determined with an Elite Glucometer (Bayer, Mishawaka, Ind), and a 20-μL sample of blood was taken for basal blood insulin concentration measurement. Then, the mice were administered an intraperitoneal injection of glucose (2 mg/g body weight); blood glucose concentrations were measured; and 20-μL blood samples were taken at 30, 60, 90, and 120 minutes after injection. Serum insulin levels were measured with an insulin ELISA kit (Alpco Diagnostics, Windham, NH). The homeostasis model assessment of the IR index was then calculated as described previously.19
Magnetic Resonance Imaging
In vivo magnetic resonance imaging to assess visceral fat accumulation was performed with a T1-weighted gradient-echo sequence on all C57BL/6 mice when exposure ended. Magnetic resonance imaging was performed with a 11.7-T Bruker magnet.
Myograph Experiments
Aortic ring segments were subjected to graded doses of phenylephrine, acetylcholine, or insulin as described previously.20
Adipose Stromal Vascular Fractionation and Macrophage Isolation
Stromal vascular fraction pellet was harvested from epididymal fat pads, and the lymphocyte layers were incubated with F4/80 antibody (Biolegend, San Diego, Calif) followed by anti-biotin superparamagnetic colloidal particles. Adipose tissue macrophages (ATMs) were separated with an MACS MS column/magnet according to the manufacturer's instruction (Miltenyi Biotec, Germany).
Confocal Microscopy Studies in Fixed and Live Adipose Tissue
To image ATMs in the C57BL/6 group by immunofluorescence, epididymal fat pads were dissected and incubated in 1% paraformaldehyde overnight and incubated with anti-F4/80 and anti-caveolin antibodies. Tissue was imaged with an inverted confocal scanning microscope. To image live adipose tissue from c-fmsYFP mice, epididymal fat tissue was minced into small pieces, washed thoroughly, and incubated with antibodies.21
Intravital Microscopy in c-fmsYFP Mice
c-fmsYFP mice were anesthetized intraperitoneally by a mixture of ketamine (100 mg/kg) and xylazine (20 mg/kg). The mesenteric tissue and cremaster muscle were exteriorized.
On an optically coherent mount. The tissues were superfused with prewarmed Ringer's lactate (37°C), and the number of adherent YFP cells in 5 to 10 movies was acquired with a 40×/0.80-W water-immersed objective using a Nikon Eclipse FN1 microscope (Nikon, Tokyo, Japan) and Metamorph software (version 7.1.2.0, Metamorph, Downingtown, Pa). The number of adherent cells in cremasteric muscle was determined by counting stationary leukocytes in a 100-μm vessel length per 30 seconds; adherent cells in the mesenteric tissue were counted per image field (1.57×105 μm2).
Data Analyses
Data are expressed as mean±SEM unless otherwise indicated. For responses measured repeatedly at different time points or dose levels, a series of 2-sample independent Student's t tests were used to detect the significant differences between 2 treatment groups at every time point and dose level with the Bonferroni correction for multiple comparison adjustment. Comparisons of other continuous variables were conducted with an independent 2-sample Student t test, with values of P<0.05 considered significant.
The authors had full access to and take responsibility for the integrity of the data. All authors have read and agree to the manuscript as written.
Results
Whole-Body Exposure Data
Ambient mean daily PM2.5 concentration at the study site was 7.7 μg/m3 (SD, 5.0 μg/m3). Mean concentration of PM2.5 in the exposure chamber was 72.7 μg/m3 (≈9-fold concentration from ambient levels). Because the mice were exposed for 6 hours a day, 5 days a week, the equivalent PM2.5 concentration to which the mice were exposed in the chamber normalized over the exposure period (128 days) was 13.0 μg/m3, which is well within the annual average PM2.5 National Ambient Air Quality Standard (NAAQS) of 15 μg/m3.22 The general exposure characteristics have previously been described.13
Metabolic Impairment by PM2.5
Before exposure began, there was no statistically significant difference between the 2 groups in body weight, chow consumption, lipid profile, and glucose tolerance response. Table I of the online Data Supplement summarizes the metabolic data in the FA and PM2.5 groups at the end of 24 weeks of exposure. C57BL/6 mice exposed to PM2.5 demonstrated identical chow consumption (2.2±0.2 g/d in FA versus 2.2±0.3 g/d in PM2.5) and weight gain over the duration of the entire experiment (Table I in the Data Supplement). PM2.5-exposed mice displayed abnormal indexes of glucose/insulin homeostasis as evidenced by elevated fasting glucose, insulin, homeostasis model assessment indexes, and abnormalities in lipid profile consistent with IR phenotype. Figure 1A displays responses to the intraperitoneal glucose tolerance test. PM2.5 mice demonstrated elevations in glucose levels at all time points after 20 minutes.
Figure 1.

Glucose tolerance test and vasomotor response in FA- or PM2.5-exposed C57BL/6 mice fed HFC. A, Blood glucose levels by glucose tolerance test. B, Mean vasorelaxation of aortic rings in response to acetylcholine (Ach). C, Insulin-mediated vasorelaxation in aortic rings preconstricted with phenylephrine (10−7 mol/L). D, Maximum phenylephrine-induced vasoconstriction in aortic rings preincubated with the nitric oxide synthase inhibitor L-NMMA (10−4 mol/L). n=7. *P<0.05 vs FA.
PM2.5 Impairs Vascular Endothelium-Dependent Responses
Because the vascular endothelium is a sensor for multiple stimuli, including inhaled particulates, and plays an important role in IR development, we investigated endothelial responses to acetylcholine and insulin (Figure 1B and 1C). PM2.5-exposed C57BL/6 mice demonstrated a decrease in peak relaxation and ED50 to acetylcholine and decreased peak relaxation to insulin compared with FA mice. Because these changes are generally consistent with a decrease in nitric oxide release in response to these agonists, we confirmed the effects of PM2.5 in reducing vascular nitric oxide bioavailability by the increment in tension in preconstricted aortic rings to NG-monomethyl-l-arginine (L-NMMA; 10−4 mol/L). PM2.5-exposed mice demonstrated reduced constriction to this agent (Figure 1D), consistent with lower levels of nitric oxide release.
PM2.5 Exposure Impairs Insulin Signaling
We examined the effect of PM2.5 exposure on insulin signaling in the aorta and liver. The phosphorylation of Akt in intact aorta but not denuded aortic segments was reduced in the PM2.5 group compared with the FA group (Figure 2A and 2B). These results suggest that the differential effect of PM2.5 on aorta was secondary to differences in endothelial Akt phosphorylation. We also investigated the time course of Akt phosphorylation in response to stimulation with insulin and found that Akt phosphorylation levels were decreased at 30 minutes in PM2.5 compared with FA (Figure 2C). To investigate whether protein kinase C (PKC) is involved in PM2.5-mediated IR and vascular dysfunction, we investigated the expression of multiple PKC isoforms by immunohistochemistry. PKC-βII but not PKC-α or PKC-δ was increased in PM2.5 compared with the FA groups (data not shown). The increased PKC-βII expression colocalized in aortic tissues, with anti-insulin receptor substrate-1 suggesting a role for this pathway in PM2.5-mediated IR (see the Data Supplement). Taken together, these data suggest that insulin signaling is abnormal in response to PM2.5 exposure.
Figure 2.
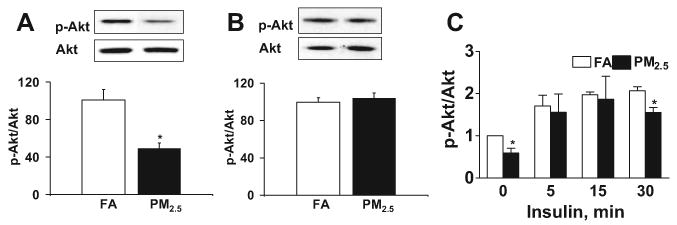
PM2.5 exposure impairs insulin signaling via the PI3-kinase/Akt pathway in FA- or PM2.5-exposed C57BL/6 mice fed HFC. A, Immunoblotting and analysis of Akt (Ser473) phosphorylation in intact aortic tissues. B, Immunoblotting and analysis of Akt (Ser473) phosphorylation in denuded aortic tissues. C, Time course of Akt phosphorylation in response to insulin (500 mU/mL) in intact aortic rings. n=5. *P<0.05 vs FA.
PM2.5 Exposure Induces Adipose Inflammation and Visceral Adiposity
On the basis of the strong evidence that adipose tissue inflammation contributes to IR, we examined the effects of PM2.5 exposure on systemic and local adipose tissue inflammation. Figure 3 shows the plasma concentration of adipokines and inflammatory biomarkers in C57BL/6 mice exposed to either PM2.5 or FA. Tumor necrosis factor-α (TNF-α), interleukin-6 (IL-6), E-selectin, intracellular adhesion molecule-1 (ICAM-1), plasminogen activator inhibitor-1, and resistin were significantly increased in the mice exposed to PM2.5 compared with FA. To examine whether PM2.5 exposure altered visceral adiposity, magnetic resonance imaging measurements using T1-weighted techniques were performed before and after PM2.5 exposure. Before exposure, there was no statistical significance in body fat mass between the 2 groups (data not shown). Although PM2.5 exposure had no effect on subcutaneous and retroperitoneal fat mass, increased visceral and mesenteric fat mass was observed compared with FA group (Figure 4A through 4C).
Figure 3.

Exposure to ambient PM2.5 increases circulatory adipokines and inflammatory biomarkers in C57BL/6 mice fed HFC. A, TNF-α and IL-6. B, E-selectin, ICAM-1, and plasminogen activator inhibitor-1 (PAI-1). C, Resistin and leptin. n=7. *P<0.05 vs FA.
Figure 4.
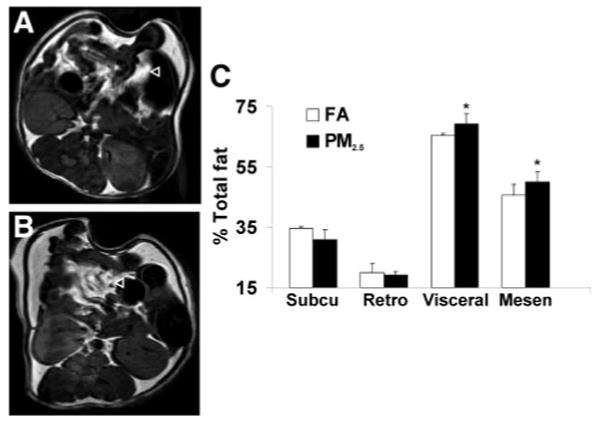
PM2.5 exposure increases visceral fat mass measured by magnetic resonance imaging in C57BL/6 mice fed HFC. A and B, T1-weighted spin echo images in the FA and PM2.5 group, respectively. C, Analysis of fat mass distribution in the 2 groups. n=5. ◃ points to visceral fat tissue. Subcu indicates subcutaneous; Retro, retroperitoneal; and Mesen, mesenteric. *P<0.05 vs FA.
ATMs, known to be mediators of adipose tissue inflammation and IR, were examined in exposed mice. PM2.5 exposure led to a marked increase in F4/80+ macrophages in adipose tissue (Figures 5A, 5B, and 6A). In addition, adipocyte size as measured by cross-sectional area was increased in PM2.5-exposed mice (FA, 883 μm2±21; PM2.5, 973 μm2±26; P<0.01) (Figure 5C and 5D). In view of the increased inflammation seen in adipose tissue, we investigated the expression of ATM-specific genes in the F4/80+ cells in the stromal vascular fraction. PM2.5 treatment resulted in significant increases in the expression of proinflammatory genes TNF-α and IL-6 (M1) with no change in nitric oxide synthase-2 expression. In contrast, IL-10 and the alternative (M2) macrophage activation marker galactose-N-acetylgalactosamine–specific lectin (Mgl1) were markedly downregulated (Figure 6B). These results indicated that PM2.5 downregulates genes associated with an antiinflammatory “M2” phenotype while simultaneously inducing proinflammatory M1 phenotype genes.
Figure 5.
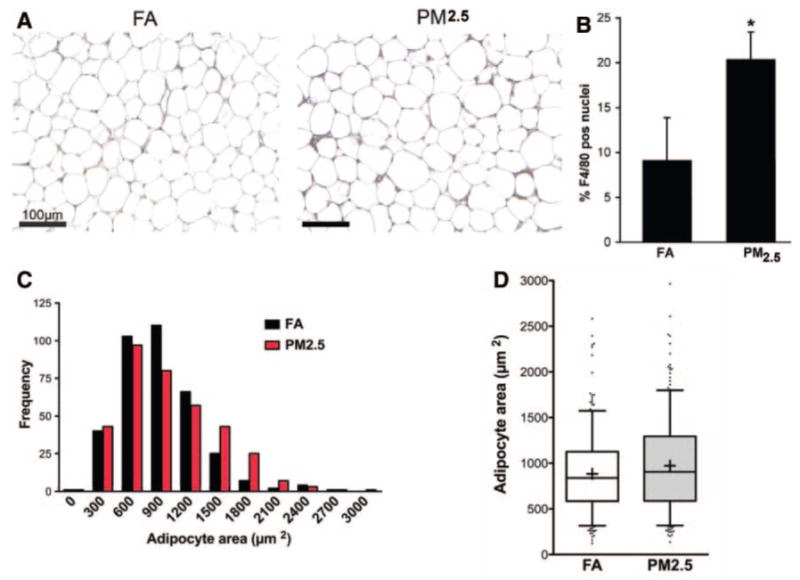
PM2.5 exposure increases ATM infiltration and adipocyte size in C57BL/6 mice fed HFC. A, Immunohistochemistry for macrophage-specific marker F4/80 in sections of epididymal fat pads from FA- and PM2.5-exposed mice. B, Quantification of ATMs in fat pads. F4/80+ nuclei were counted and expressed as a percentage of the total nuclei per ×400 power field. Four sections were evaluated from each mouse in each group. C, Adipocyte-size histograms show increased adipocyte hypertrophy in PM2.5-exposed mice. Areas were calculated from 90 adipocytes from each of 5 mice in each group. D, Box plot of adipocyte size. The box represents the upper and lower quartiles. The whiskers or bars show the 5th or 95th percentiles. The line in the box represents the median. The + signs represent the mean. Raw numbers: FA: mean, 883±21 μm2; median, 839 μm2; PM2.5: mean, 973±26 μm2; median, 905 μm2. n=7. *P<0.05 vs FA.
Figure 6.
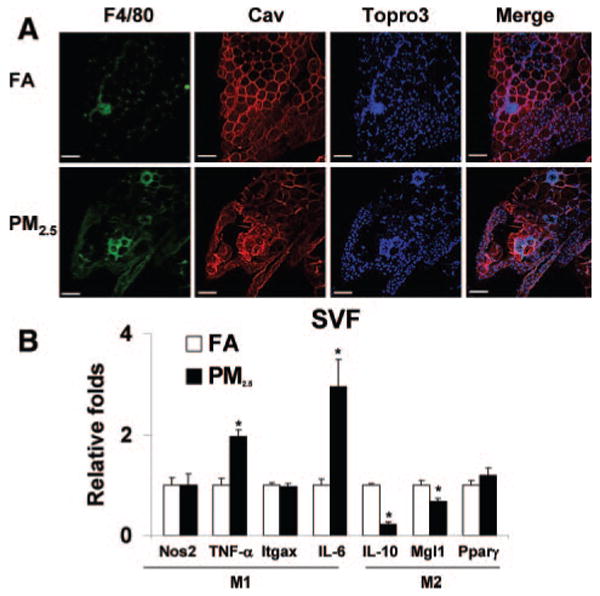
Exposure to ambient PM2.5 increases macrophage infiltration in adipose tissue and induces a shift in macrophage phenotype characteristics in C57BL/6 mice fed HFC. A, Immunofluorescence localization of ATMs (F4/80) in epididymal fat pads from mice exposed to FA or PM2.5. Adipocytes identified by caveolin (Cav) staining and nuclei labeled with TOPRO3. Scale bar=100 μm. B, Real-time polymerase chain reaction measurement of macrophage M1/M2 gene expression. PM2.5 treatment resulted in significant increases in the M1 phenotypic genes TNF-α and IL-6 in the F4/80+ cells of stromal vascular fraction (SVF). Nos2 indicates nitric oxide synthase-2; Itgax, integrin αX, CD11c; and Pparγ, peroxisome proliferator–activated receptor. n=7. *P<0.05 vs FA.
PM2.5 Exposure Induces YFP Cell Adhesion and Infiltration
In view of the inflammatory macrophage phenotype in adipose tissue and an increase in adhesion molecules promoting leukocyte adhesion to endothelial cells (ICAM-1 and E-selectin), we tested the hypothesis that monocytes are recruited to adipose tissue in response to PM2.5 exposure, thus representing newly arrived monocyte-macrophages. To test this hypothesis, we used a transgenic animal model expressing YFP under the control of a c-fms promoter (c-fmsYFP). The mice were rendered diabetic (Figure 7A and 7B) and then exposed to FA or PM2.5 with an intratracheal protocol. Intravital microscopy was performed to determine the number of YFP cells in mesentery and adherent YFP cells in cremasteric vessels as representative of visceral and systemic microcirculation, respectively. Figure 7C indicates that more YFP cells in the adipose tissue were found in the PM2.5-exposed mice compared with the saline-exposed mice. Figure 8A and 8B are representative images of mesenteric tissue from c-fmsYFP mice exposed to either saline or PM2.5, respectively; Figure 8C shows a graphic of multiple experiments (n=4 per group). Exposure to PM2.5 significantly increased YFP cell infiltration in the mesenteric fat. Figure 8D is a representative image of cremasteric circulation from mice exposed to PM2.5. PM2.5 treatment resulted in increased YFP cell adhesion to endothelium compared with saline control in venules measuring 20 and 30 μm, respectively (Figure 8E).
Figure 7.

Glucose and insulin tolerance tests and YFP cell fluorescence staining of live adipose tissue in c-fmsYFP mice fed HFC. A, Blood glucose levels during glucose tolerance test. B, Blood insulin levels during glucose tolerance test. C, Unfixed live adipose tissue from HFC-fed transgenic mice that express yellow fluorescent protein (c-fmsYFP, yellow) was stained with Hoechst 33342 (blue) and isolectin (red) by confocal microscopy. Isolectin is an endothelium-specific marker. PM2.5 treatment resulted in increased YFP cell infiltration into the adipose tissue compared with the saline control. n=4. *P<0.05, normal chow vs HFC.
Figure 8.
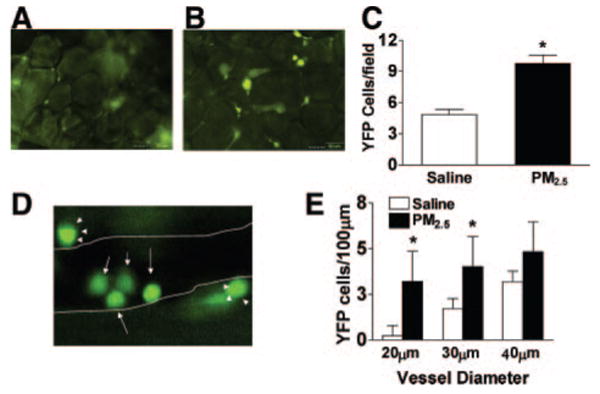
PM2.5 exposure increases YFP cell infiltration in mesenteric tissue and YFP cell adhesion in the cremasteric vasculature in c-fmsYFP mice fed HFC. A, B, Representative images of YFP cells in mesenteric tissue treated by either saline (A) or PM2.5 (B) and the quantification of YFP cells (C). D, Representative image of YFP cells in cremasteric tissue treated by PM2.5. The arrows depict YFP cells inside the vessel; closed arrowheads, YFP cells outside the vessel. E, Quantification of adherent YFP cells. The postcapillary venule boundaries are outlined in white lines. n=4. *P<0.05, saline vs PM2.5.
Discussion
In the present study, ambient PM2.5 induced obesity to potentiate IR, visceral adiposity, and inflammation in a diet-induced murine model. Over the last few decades, a concerted scientific effort on risk factors such as glycemia, diet, and inactivity has resulted in fundamental insights into how they may increase propensity for type 2 diabetes mellitus. 23,24 On the other hand, the link between chronic exposure to environmental factors in air/water and propensity to type 2 diabetes mellitus has gained only recent attention.7,25,26 PM2.5 exposure in conjunction with HFC feeding markedly worsened whole-body insulin glucose homeostasis and inflammation, providing evidence for an important interaction between environmental and dietary signals. Extensive evidence in animal models and humans implicates inflammation as a critical mechanism that is responsible, at least in part, for the pathophysiological abnormalities noted in response to high-fat diet and/or obesity.27,28 PM2.5 exposure was associated with increases in systemic TNF-α and IL-6 levels in our study and is entirely consistent with short-term studies of both in vitro and inhalational exposure to PM2.5 evoking a pronounced pulmonary and systemic inflammatory response.29 Corresponding human studies have demonstrated an effect of ambient and concentrated particles on inflammation.30,31
A key defect in IR is abnormal insulin signaling through alterations in the insulin receptor substrate-1–phosphatidylinositol 3-kinase (PI3K)/Akt pathway. Reduced PI3K phosphorylation caused by abnormal anti-insulin receptor substrate-1 phosphorylation (increased serine phosphorylation or reduced tyrosine phosphorylation) and reduced phosphorylation of the downstream signaling mediator Akt is implicated as a key defect in IR.32 We have demonstrated a marked reduction in PI3K-mediated phosphorylation of basal and stimulated Akt in the aortic endothelium. The abnormalities in the PI3K/Akt pathway in the aorta were associated with markedly diminished dilation to classic endothelium-dependent agonists such as acetylcholine and insulin.33 This observation led us to hypothesize that the mechanism by which PM2.5 exacerbates IR is enhancement of inflammation in adipose tissue at the level of ATMs. ATMs are derived from circulating monocytes that are recruited across the endothelium in response to obesity and have been shown to be required for the development of IR in mouse models of diet-induced and genetic obesity.34 Consistent with this hypothesis, we observed that PM2.5 exposure increased systemic levels of inflammatory cytokines, increased adipokine levels, increased the numbers of F4/80+ ATMs, increased markers of classically activated (M1) ATMs, decreased markers of alternatively activated (M2) ATMs, and increased the adhesion of monocytes to adipose tissue vasculature.
In preliminary studies from our group, PM2.5 exposure in lean C57BL/6 mice, at levels and durations comparable to the exposure in this investigation, induced endothelial dysfunction and mild elevations in blood pressure but failed to induce alterations in lipid profile and insulin sensitivity. The metabolic changes in IR and obesity correspond strongly with low-grade inflammation or meta-flammation characterized by increased abundance of ATMs.9 ATMs have been postulated to interfere with adipocyte function by secreting proinflammatory cytokines such as IL-1, IL-6, and TNF-α.35 We observed an increase in ATMs that was paralleled by an increase in adipose size and translated into a small but significant increase in overall visceral adipose tissue content in the PM2.5 group using highly sensitive magnetic resonance imaging methodologies. These changes raise the question of whether PM2.5 represents yet another factor in the complex relationship between urbanization and obesity and provide a basis for future studies in this area. As has been demonstrated in many epidemiological studies, visceral fat is the most predictive of postprandial glucose levels,36 indexes of IR, and finally cardiovascular disease in both men and women.37,38 Conversely, selective reduction in visceral adipose tissue reduces cardiovascular disease risk through improvements in hypertension, diabetes, IR, and other components of intermediary metabolism, implicating adipose tissue and adipose tissue–derived signals as key mediators in IR.39–42
Our data demonstrate that PM2.5 alters the balance between M1 and M2 ATMs in adipose tissue. M1 macrophages accumulate in obesity and generate inflammatory signals that block insulin signaling in adipocytes. M2 ATMs are present primarily in lean animals and can block the negative effects of TNF-α on adipocytes. The importance of the balance between M1 and M2 ATMs has been emphasized by several recent studies.43 The M2 macrophage markers IL-10 and Mgl1 were found in our study to be dampened with PM2.5 exposure. In combination with the increase in inflammatory gene expression in adipose tissue, the attenuation of M2 gene expression may play a role in further amplifying inflammation. The balance between M1 and M2 macrophages in end organs appears to be an important aspect of and contributes to the inflammation seen in atherosclerosis and obesity.44 Thus, inflammatory diseases such as atherosclerosis that have been shown to be strongly associated with PM2.5 exposure20 may be caused not only by sustained proinflammatory effects but also by failure of antiinflammatory mechanisms. ATM content, adipocyte hypertrophy, and adipocyte death are closely linked,45 and our model cannot exclude the possibility that PM2.5 interacts directly with adipocytes, leading to secondary changes in ATMs.
Because the change in ATM numbers in visceral fat was paralleled by increases in circulating levels of ICAM and E-selectin, key integrins that play a role in the egress of monocytes from the vascular compartment to the adipose tissue,34 we investigated the effect of intratracheal PM2.5 on leukocyte trafficking in a novel mouse model expressing YFP under control of a monocyte specific c-fms promoter. In response to PM2.5, there was a marked increase in the number of adherent and rolling YFP cells and eventually infiltrating YFP cells. This is further evidence that exposure to PM2.5 directly induces macrophage homing to the adipose tissue. The signals leading to their preferential homing and accumulation in response to environmental signals such as PM2.5 clearly need further investigation.
With the limited sample size in each group, we could not explore the longitudinal effect of exposure to PM2.5 on the health outcomes of interest. Instead, we focused on the differences at each individual time point. To adjust for the inflated type I error in multiple comparison, we used the Bonferroni correction, which is considered to be conservative. Nevertheless, our findings provide a potential biological basis for the link between particulate air pollution exposure and type 2 diabetes mellitus and further our understanding of the mechanisms involved in air pollution–induced cardiovascular diseases.46 Currently, the NAAQS standards mandate mean annual concentrations of <15.0 μg/m3 and daily concentrations of <35 μg/m3.47 PM2.5 annual levels seen in cities in Latin America, China, and India average 100 to 150 μg/m3, which are roughly 10- to 15-fold higher than concentrations in the United States and comparable to the levels accomplished in our study.48 The adjusted average concentration of PM2.5 after accounting for the duration of exposure per day (6 h/d, 5 d/wk) is well below the current NAAQS recommendations of 15 μg/m3 in the United States.
Clinical Perspective.
Obesity and type 2 diabetes represent chronic low-grade inflammatory states that have both genetic and environmental determinants. Although the role of diet and exercise as environmental determinants is defined, the interaction between particulate air pollution (PM2.5) and other metabolic determinants of obesity/insulin resistance has not yet been elucidated. In this experiment, we exposed C57BL/6 mice fed high-fat chow to concentrated ambient PM2.5 or filtered air for 24 weeks and demonstrated that PM2.5-exposed mice exhibited marked whole-body insulin resistance, increased visceral adiposity and inflammation, vascular relaxation abnormalities, and enhanced monocyte adhesion to microcirculatory beds. Our findings provide new insights into a potential role for PM2.5 exposure in the pathogenesis of diabetes/insulin resistance and further our understanding of how inhaled particulates may modulate inflammatory responses in distant target organs.
Supplementary Material
The online-only Data Supplement is available with this article at http://circ.ahajournals.org/cgi/content/full/CIRCULATIONAHA.108.799015/DC1.
Acknowledgments
We thank Dr Morton Lippmann for his critical review of this manuscript.
Sources of Funding: This study was supported by National Institutes of Health (NIH) grants R01ES013406 and R01ES015146 to Dr Rajagopalan and K01ES016588 to Dr Sun. The whole-body exposure was performed in facilities at New York University that were supported by NIH grants (ES00260 and ES015495) and a Health Effects Institute grant (4750-RFA05–1A/06–11) to Dr Chen. Dr Lumeng was supported by NIH grant K08DK078851.
Footnotes
Disclosures: None.
References
- 1.Brook RD, Franklin B, Cascio W, Hong Y, Howard G, Lipsett M, Luepker R, Mittleman M, Samet J, Smith SC, Jr, Tager I. Air pollution and cardiovascular disease: a statement for healthcare professionals from the Expert Panel on Population and Prevention Science of the American Heart Association. Circulation. 2004;109:2655–2671. doi: 10.1161/01.CIR.0000128587.30041.C8. [DOI] [PubMed] [Google Scholar]
- 2.Bhatnagar A. Environmental cardiology: studying mechanistic links between pollution and heart disease. Circ Res. 2006;99:692–705. doi: 10.1161/01.RES.0000243586.99701.cf. [DOI] [PubMed] [Google Scholar]
- 3.Pope CA, 3rd, Burnett RT, Thurston GD, Thun MJ, Calle EE, Krewski D, Godleski JJ. Cardiovascular mortality and long-term exposure to particulate air pollution: epidemiological evidence of general pathophysiological pathways of disease. Circulation. 2004;109:71–77. doi: 10.1161/01.CIR.0000108927.80044.7F. [DOI] [PubMed] [Google Scholar]
- 4.Miller KA, Siscovick DS, Sheppard L, Shepherd K, Sullivan JH, Anderson GL, Kaufman JD. Long-term exposure to air pollution and incidence of cardiovascular events in women. N Engl J Med. 2007;356:447–458. doi: 10.1056/NEJMoa054409. [DOI] [PubMed] [Google Scholar]
- 5.Urch B, Silverman F, Corey P, Brook JR, Lukic KZ, Rajagopalan S, Brook RD. Acute blood pressure responses in healthy adults during controlled air pollution exposures. Environ Health Perspect. 2005;113:1052–1055. doi: 10.1289/ehp.7785. [DOI] [PMC free article] [PubMed] [Google Scholar]
- 6.Pope CA, 3rd, Muhlestein JB, May HT, Renlund DG, Anderson JL, Horne BD. Ischemic heart disease events triggered by short-term exposure to fine particulate air pollution. Circulation. 2006;114:2443–2448. doi: 10.1161/CIRCULATIONAHA.106.636977. [DOI] [PubMed] [Google Scholar]
- 7.Brook RD, Jerrett M, Brook JR, Bard RL, Finkelstein MM. The relationship between diabetes mellitus and traffic-related air pollution. J Occup Environ Med. 2008;50:32–38. doi: 10.1097/JOM.0b013e31815dba70. [DOI] [PubMed] [Google Scholar]
- 8.Chen JC, Schwartz J. Metabolic syndrome and inflammatory responses to long-term particulate air pollutants. Environ Health Perspect. 2008;116:612–617. doi: 10.1289/ehp.10565. [DOI] [PMC free article] [PubMed] [Google Scholar]
- 9.Weisberg SP, McCann D, Desai M, Rosenbaum M, Leibel RL, Ferrante AW., Jr Obesity is associated with macrophage accumulation in adipose tissue. J Clin Invest. 2003;112:1796–1808. doi: 10.1172/JCI19246. [DOI] [PMC free article] [PubMed] [Google Scholar]
- 10.Hotamisligil GS. Inflammation and metabolic disorders. Nature. 2006;444:860–867. doi: 10.1038/nature05485. [DOI] [PubMed] [Google Scholar]
- 11.Lumeng CN, Deyoung SM, Bodzin JL, Saltiel AR. Increased inflammatory properties of adipose tissue macrophages recruited during diet-induced obesity. Diabetes. 2007;56:16–23. doi: 10.2337/db06-1076. [DOI] [PubMed] [Google Scholar]
- 12.Sasmono RT, Oceandy D, Pollard JW, Tong W, Pavli P, Wainwright BJ, Ostrowski MC, Himes SR, Hume DA. A macrophage colony-stimulating factor receptor-green fluorescent protein transgene is expressed throughout the mononuclear phagocyte system of the mouse. Blood. 2003;101:1155–1163. doi: 10.1182/blood-2002-02-0569. [DOI] [PubMed] [Google Scholar]
- 13.Maciejczyk P, Zhong M, Li Q, Xiong J, Nadziejko C, Chen LC. Effects of subchronic exposures to concentrated ambient particles (CAPs) in mice, II: the design of a CAPs exposure system for biometric telemetry monitoring. Inhal Toxicol. 2005;17:189–197. doi: 10.1080/08958370590912743. [DOI] [PubMed] [Google Scholar]
- 14.Sioutas C, Koutrakis P, Burton RM. A technique to expose animals to concentrated fine ambient aerosols. Environ Health Perspect. 1995;103:172–177. doi: 10.1289/ehp.95103172. [DOI] [PMC free article] [PubMed] [Google Scholar]
- 15.Chen LC, Hwang JS. Effects of subchronic exposures to concentrated ambient particles (CAPs) in mice, IV: characterization of acute and chronic effects of ambient air fine particulate matter exposures on heart-rate variability. Inhal Toxicol. 2005;17:209–216. doi: 10.1080/08958370590912789. [DOI] [PubMed] [Google Scholar]
- 16.Sun Q, Yue P, Kirk RI, Wang A, Moatti D, Jin X, Lu B, Schecter AD, Lippmann M, Gordon T, Chen LC, Rajagopalan S. Ambient air particulate matter exposure and tissue factor expression in atherosclerosis. Inhal Toxicol. 2008;20:127–137. doi: 10.1080/08958370701821482. [DOI] [PubMed] [Google Scholar]
- 17.Mutlu GM, Green D, Bellmeyer A, Baker CM, Burgess Z, Rajamannan N, Christman JW, Foiles N, Kamp DW, Ghio AJ, Chandel NS, Dean DA, Sznajder JI, Budinger GR. Ambient particulate matter accelerates coagulation via an IL-6-dependent pathway. J Clin Invest. 2007;117:2952–2961. doi: 10.1172/JCI30639. [DOI] [PMC free article] [PubMed] [Google Scholar]
- 18.Costa DL, Lehmann JR, Winsett D, Richards J, Ledbetter AD, Dreher KL. Comparative pulmonary toxicological assessment of oil combustion particles following inhalation or instillation exposure. Toxicol Sci. 2006;91:237–246. doi: 10.1093/toxsci/kfj123. [DOI] [PubMed] [Google Scholar]
- 19.Wallace TM, Levy JC, Matthews DR. Use and abuse of HOMA modeling. Diabetes Care. 2004;27:1487–1495. doi: 10.2337/diacare.27.6.1487. [DOI] [PubMed] [Google Scholar]
- 20.Sun Q, Wang A, Jin X, Natanzon A, Duquaine D, Brook RD, Aguinaldo JG, Fayad ZA, Fuster V, Lippmann M, Chen LC, Rajagopalan S. Long-term air pollution exposure and acceleration of atherosclerosis and vascular inflammation in an animal model. JAMA. 2005;294:3003–3010. doi: 10.1001/jama.294.23.3003. [DOI] [PubMed] [Google Scholar]
- 21.Nishimura S, Manabe I, Nagasaki M, Hosoya Y, Yamashita H, Fujita H, Ohsugi M, Tobe K, Kadowaki T, Nagai R, Sugiura S. Adipogenesis in obesity requires close interplay between differentiating adipocytes, stromal cells, and blood vessels. Diabetes. 2007;56:1517–1526. doi: 10.2337/db06-1749. [DOI] [PubMed] [Google Scholar]
- 22.US Environmental Protection Agency. EPA strengthens U.S. air quality standards. [May 29, 2008]. Available at: http://epa.gov/pm/naaqsrev2006.html.
- 23.Petersen KF, Shulman GI. Etiology of insulin resistance. Am J Med. 2006;119:S10–S16. doi: 10.1016/j.amjmed.2006.01.009. [DOI] [PMC free article] [PubMed] [Google Scholar]
- 24.Smith JP. Nature and causes of trends in male diabetes prevalence, undiagnosed diabetes, and the socioeconomic status health gradient. Proc Natl Acad Sci USA. 2007;104:13225–13231. doi: 10.1073/pnas.0611234104. [DOI] [PMC free article] [PubMed] [Google Scholar]
- 25.O'Neill MS, Veves A, Zanobetti A, Sarnat JA, Gold DR, Economides PA, Horton ES, Schwartz J. Diabetes enhances vulnerability to particulate air pollution-associated impairment in vascular reactivity and endothelial function. Circulation. 2005;111:2913–2920. doi: 10.1161/CIRCULATIONAHA.104.517110. [DOI] [PubMed] [Google Scholar]
- 26.O'Neill MS, Veves A, Sarnat JA, Zanobetti A, Gold DR, Economides PA, Horton ES, Schwartz J. Air pollution and inflammation in type 2 diabetes: a mechanism for susceptibility. Occup Environ Med. 2007;64:373–379. doi: 10.1136/oem.2006.030023. [DOI] [PMC free article] [PubMed] [Google Scholar]
- 27.Pradhan AD, Manson JE, Rifai N, Buring JE, Ridker PM. C-reactive protein, interleukin 6, and risk of developing type 2 diabetes mellitus. JAMA. 2001;286:327–334. doi: 10.1001/jama.286.3.327. [DOI] [PubMed] [Google Scholar]
- 28.Dandona P, Aljada A, Bandyopadhyay A. Inflammation: the link between insulin resistance, obesity and diabetes. Trends Immunol. 2004;25:4–7. doi: 10.1016/j.it.2003.10.013. [DOI] [PubMed] [Google Scholar]
- 29.van Eeden SF, Tan WC, Suwa T, Mukae H, Terashima T, Fujii T, Qui D, Vincent R, Hogg JC. Cytokines involved in the systemic inflammatory response induced by exposure to particulate matter air pollutants (PM(10)) Am J Respir Crit Care Med. 2001;164:826–830. doi: 10.1164/ajrccm.164.5.2010160. [DOI] [PubMed] [Google Scholar]
- 30.Pope CA, 3rd, Dockery DW. Health effects of fine particulate air pollution: lines that connect. J Air Waste Manag Assoc. 2006;56:709–742. doi: 10.1080/10473289.2006.10464485. [DOI] [PubMed] [Google Scholar]
- 31.Utell MJ, Frampton MW, Zareba W, Devlin RB, Cascio WE. Cardiovascular effects associated with air pollution: potential mechanisms and methods of testing. Inhal Toxicol. 2002;14:1231–1247. doi: 10.1080/08958370290084881. [DOI] [PubMed] [Google Scholar]
- 32.Engelman JA, Luo J, Cantley LC. The evolution of phosphatidylinositol 3-kinases as regulators of growth and metabolism. Nat Rev Genet. 2006;7:606–619. doi: 10.1038/nrg1879. [DOI] [PubMed] [Google Scholar]
- 33.Van Gaal LF, Mertens IL, De Block CE. Mechanisms linking obesity with cardiovascular disease. Nature. 2006;444:875–880. doi: 10.1038/nature05487. [DOI] [PubMed] [Google Scholar]
- 34.Nishimura S, Manabe I, Nagasaki M, Seo K, Yamashita H, Hosoya Y, Ohsugi M, Tobe K, Kadowaki T, Nagai R, Sugiura S. In vivo imaging in mice reveals local cell dynamics and inflammation in obese adipose tissue. J Clin Invest. 2008;118:710–721. doi: 10.1172/JCI33328. [DOI] [PMC free article] [PubMed] [Google Scholar]
- 35.Gustafson B, Smith U. Cytokines promote Wnt signaling and inflammation and impair the normal differentiation and lipid accumulation in 3T3-L1 preadipocytes. J Biol Chem. 2006;281:9507–9516. doi: 10.1074/jbc.M512077200. [DOI] [PubMed] [Google Scholar]
- 36.Despres JP, Moorjani S, Tremblay A, Ferland M, Lupien PJ, Nadeau A, Bouchard C. Relation of high plasma triglyceride levels associated with obesity and regional adipose tissue distribution to plasma lipoprotein-lipid composition in premenopausal women. Clin Invest Med. 1989;12:374–380. [PubMed] [Google Scholar]
- 37.Rexrode KM, Carey VJ, Hennekens CH, Walters EE, Colditz GA, Stampfer MJ, Willett WC, Manson JE. Abdominal adiposity and coronary heart disease in women. JAMA. 1998;280:1843–1848. doi: 10.1001/jama.280.21.1843. [DOI] [PubMed] [Google Scholar]
- 38.Palmieri L, Donfrancesco C, Giampaoli S, Trojani M, Panico S, Vanuzzo D, Pilotto L, Cesana G, Ferrario M, Chiodini P, Sega R, Stamler J. Favorable cardiovascular risk profile and 10-year coronary heart disease incidence in women and men: results from the Progetto CUORE. Eur J Cardiovasc Prev Rehabil. 2006;13:562–570. doi: 10.1097/01.hjr.0000221866.27039.4b. [DOI] [PubMed] [Google Scholar]
- 39.Gaede P, Lund-Andersen H, Parving H-H, Pedersen O. Effect of a multifactorial intervention on mortality in type 2 diabetes. N Engl J Med. 2008;358:580–591. doi: 10.1056/NEJMoa0706245. [DOI] [PubMed] [Google Scholar]
- 40.Busetto L. Visceral obesity and the metabolic syndrome: effects of weight loss. Nutr Metab Cardiovasc Dis. 2001;11:195–204. [PubMed] [Google Scholar]
- 41.Metz JA, Stern JS, Kris-Etherton P, Reusser ME, Morris CD, Hatton DC, Oparil S, Haynes RB, Resnick LM, Pi-Sunyer FX, Clark S, Chester L, McMahon M, Snyder GW, McCarron DA. A randomized trial of improved weight loss with a prepared meal plan in overweight and obese patients: impact on cardiovascular risk reduction. Arch Intern Med. 2000;160:2150–2158. doi: 10.1001/archinte.160.14.2150. [DOI] [PubMed] [Google Scholar]
- 42.Ross R, Dagnone D, Jones PJ, Smith H, Paddags A, Hudson R, Janssen I. Reduction in obesity and related comorbid conditions after diet-induced weight loss or exercise-induced weight loss in men: a randomized, controlled trial. Ann Intern Med. 2000;133:92–103. doi: 10.7326/0003-4819-133-2-200007180-00008. [DOI] [PubMed] [Google Scholar]
- 43.Odegaard JI, Ricardo-Gonzalez RR, Red Eagle A, Vats D, Morel CR, Goforth MH, Subramanian V, Mukundan L, Ferrante AW, Chawla A. Alternative M2 activation of Kupffer cells by PPARdelta ameliorates obesity-induced insulin resistance. Cell Metab. 2008;7:496–507. doi: 10.1016/j.cmet.2008.04.003. [DOI] [PMC free article] [PubMed] [Google Scholar]
- 44.Gordon S. The macrophage: past, present and future. Eur J Immunol. 2007;37:S9–S17. doi: 10.1002/eji.200737638. [DOI] [PubMed] [Google Scholar]
- 45.Strissel KJ, Stancheva Z, Miyoshi H, Perfield JW, 2nd, DeFuria J, Jick Z, Greenberg AS, Obin MS. Adipocyte death, adipose tissue remodeling, and obesity complications. Diabetes. 2007;56:2910–2918. doi: 10.2337/db07-0767. [DOI] [PubMed] [Google Scholar]
- 46.Dubowsky SD, Suh H, Schwartz J, Coull BA, Gold DR. Diabetes, obesity, and hypertension may enhance associations between air pollution and markers of systemic inflammation. Environ Health Perspect. 2006;114:992–998. doi: 10.1289/ehp.8469. [DOI] [PMC free article] [PubMed] [Google Scholar]
- 47.Air Quality Criteria for Particulate Matter. Washington, DC: US Environmental Protection Agency; 2004. [Google Scholar]
- 48.Wang S, Zhao Y, Chen G, Wang F, Aunan K, Hao J. Assessment of population exposure to particulate matter pollution in Chongqing, China. Environ Pollut. 2008;153:247–256. doi: 10.1016/j.envpol.2007.07.030. [DOI] [PubMed] [Google Scholar]
Associated Data
This section collects any data citations, data availability statements, or supplementary materials included in this article.
Supplementary Materials
The online-only Data Supplement is available with this article at http://circ.ahajournals.org/cgi/content/full/CIRCULATIONAHA.108.799015/DC1.