Abstract
Intensive Care Units (ICUs) are chaotic places where hundreds of tasks are carried out by many different people. Timely and coordinated execution of these tasks are directly related to quality of patient outcomes. An improved understanding of the current care process can aid in improving quality. Our goal is to build towards a system that automatically catalogs various tasks being performed by the bedside. We propose a set of techniques using computer vision and machine learning to develop a system that passively senses the environment and identifies seven common actions such as documenting, checking up on a patient, and performing a procedure. Preliminary evaluation of our system on 5.5 hours of data from the Pediatric ICU obtains overall task recognition accuracy of 70%. Furthermore, we show how it can be used to summarize and visualize tasks. Our system provides a significant departure from current approaches used for quality improvement. With further improvement, we think that such a system could realistically be deployed in the ICU.
Introduction
An Intensive Care Unit (ICU) is a complex environment. Often patients are seen by more than two dozen caregivers during their stay. Hundreds of micro-tasks need to be performed on a daily basis in a coordinated way to keep the patient stable. Many of these tasks are time-sensitive, and failure to execute at the right time can lead to adverse outcomes. Workflow factors such as poor coordination or increased caregiver workloads are also likely to lead to lapses in care [ 1 ].
A system that passively catalogs patient-centered tasks being performed in this environment can aid in understanding current workflow and its effect on the quality of care. For example, when was a given set of tasks performed? Were they performed on schedule? In particular, when hospital administrators consider adding tasks to the existing work-flow, it is valuable to systematically catalog and understand how the ICU caregivers are currently spending their time. In this paper, we develop an automated system for identifying frequently performed tasks in the ICU using noninvasively measured depth-range sensor data. Unlike survey or ethnographic studies, such a system is more scalable, relatively cheap to deploy, and can be “always present.” Moreover, caregivers and patients need not wear additional sensors, thus avoiding any interference with existing work-flow.
Related Work
Task Analysis in the ICU:
The need for active surveil-lance in the ICU for improving quality of care has received growing emphasis in the literature (e.g. [ 2 ]). Existing studies rely on manual observations or surveys [ 3 , 1 , 4 ] unlike the approach proposed in this paper.
Automated ICU Surveillance:
More recently, using data collected from electronic medical records (EMR), several works have proposed to develop methods for automated surveillance. The resulting tools are typically limited to detection [ 5 , 6 ] or early prediction [ 7 , 8 ] of individual outcomes and are unable to capture the broad class of care-process-related tasks that we are interested in for this paper.
Activity Recognition:
There are notable parallels with the work we are doing in ICUs with the work done in recent years in surgical settings. Padoy et al. analyzed and recognized surgical workflow by learning from a set of previously recorded procedures using what they call Workflow Hidden Markov Models [ 9 ]. The largest difference is in the types of actions that take place. A surgical operation is highly structured; for each operation there is typically a set of sub-procedures that occurs sequentially. Thus it is possible to acquire a large number of similar sequences and learn dynamical models that capture the workflow well. In the ICU we have a large number of small tasks that may only have a small dependence on each other. Therefore, these methods do not scale readily to our domain.
Outside of the surgical setting activity recognition has been attempted in a home setting using various sensing platforms [ 10 , 11 , 12 ]. Methods proposed in many of these papers rely on having an accurate estimate of the skeleton model of the body. Such a model is acquired by adding visible markers on the body or requiring the person to initialize the tracker by looking at the camera and posing. Requiring caregivers to register with the tracker is not practical in our setting.
Methods
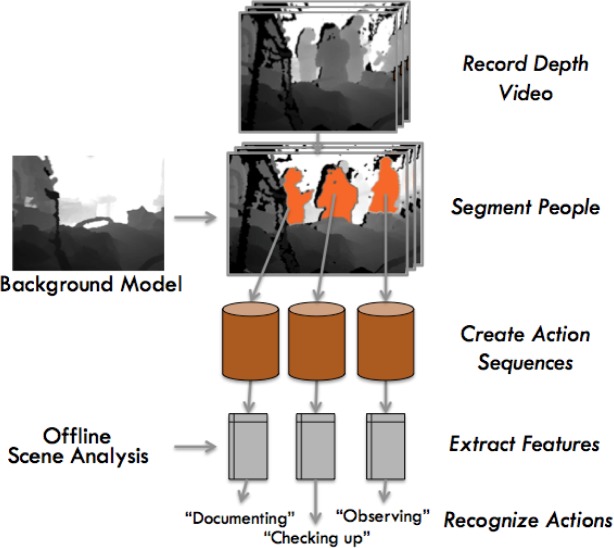
Our approach has four steps as displayed in figure 1 . First, data is recorded from inside a room at the ICU. Second, individual people are segmented from the image and put into an action sequence. An example action sequence could be a nurse coming into the room, checking patient diagnostics, and leaving the room. This sequence is comprised of all images of that person during that event and is combined with scene analysis information generated offline. Relevant scene information could include the location of the patient’s bed or the documentation station. Features are extracted that summarize information like the caregivers’ position relative to specified equipment and whether they are interacting with another individual. Finally, each action sequence is classified using one of our recognition techniques. Below, we describe each step in more detail.
Figure 1:
Our task recognition pipeline records video using a depth range sensor, segments people from the images, tracks them through time, and recognizes each action sequence based on a set of features.
Data Acquisition
An Xbox Kinect range sensor was used to record depth video at our hospital’s Pediatric ICU in a single-patient room. Recorded data contains depth information at each pixel of the captured image. The system is also able to record video simultaneously but due to restrictions by the institutional IRB committee we only record depth images. The device is placed near the door looking towards the patient and captures footage continuously. For this study we collected 5.5 hours of data for one patient in the PICU. According to the nurses and the attending physician the footage we recorded is representative of a normal day.
Segmentation and Tracking
Caregivers’ silhouettes are extracted from the depth images using a straightforward background subtraction technique. A background model is generated offline by averaging a set of 10 frames taken at the beginning of the recording. The depth images have a moderate amount of noise so averaging reduces the effect of aberrant depth measurements. The background model is subtracted from all images to contain the parts of the map where motion is detected. Large gradients in the depth map (Δ z > 100mm) are removed to help differentiate separate people that may be overlapping. Lastly, a connected-components technique is used to extract the individual people from the image. These segmentations represent the 3D information for each person.
An activity sequence is created by tracking each individual over time. For each new image we look for the closest matching person in 3D space from the previous frames. In practice, to deal with occlusions, like someone walking in front of another person, a new person is added to a current activity sequence if their previous distance is less than 0.5 meters away and they were seen in the last second of footage.
Feature Extraction
For each action sequence we extract position-based and orientation-based features (marked in italics below) that summarize each event. The output is a 17-dimensional vector per sequence that takes into account interactions with the scene and multi-person interactions.
Positional Features:
There are nine position-based features that encode relative spatial information for each activity sequence. The first five summarize the whole sequence in the form of path length , average velocity , and the average center of mass in the X, Y, and Z axes . Each segmentation within the activity sequence has a 3D center of mass, thus we can calculate the path length by integrating the position changes over the whole sequence. Path velocity is then the path length divided by the duration of the action sequence.
The next four positional features deal with caregiver locations relative to equipment in the room. Hand-labeled “virtual proximity sensors” are placed at strategic locations such as the head and foot of the bed , at the documentation station , and on the ventilator . Intuitively, if a staff member is not close to the ventilator, it is unlikely that they are interacting with that machine. Empirically we see that this has a significant benefit in our recognition results. Furthermore, defining features that measure relative positions between objects and individuals instead of absolute positions in the room allows for the model to more easily generalize as equipment locations change or the system is moved to a different room. Quantitatively, the value for each proximity sensor is the minimum distance between the sensor and the caregiver’s position at any time in the action sequence:
| (1) |
f i is the feature value at index i , p is the 3D position, and k is a frame in the action sequence. Figure 2 shows two example proximity sensors centered at the patient’s head and foot. The blue rings represent equidistant points from the sensor.
Figure 2:
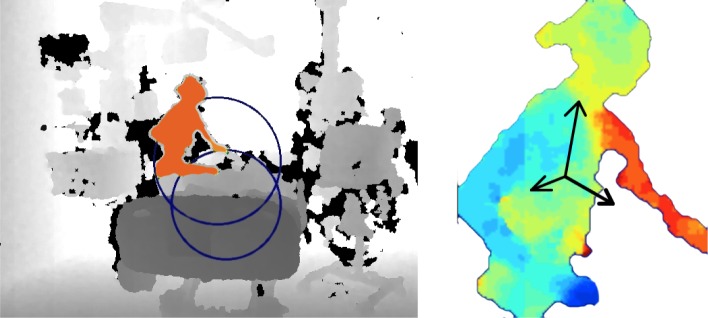
(left) A segmented person highlighted in orange with two proximity sensors marked by blue circles. (right) Colorized depth map of the same person with an estimate of their orientation.
Orientation-based Features:
Knowing the orientation of an individual can give insight into the task at hand and any interactions with others. For example, if a caregiver is positioned next to the ventilator then they could be doing one of two tasks: using the ventilator or performing a procedure on the patient. Knowing which way they are facing gives context for what they are doing.
Orientation is estimated by computing the three principal components of the 3D points belonging to each individual. Using figure 2 as an example, the first component is typically pointing upwards, the second is pointing in front of the person, and the third is pointed laterally towards their shoulders. Note that due to ambiguity between a forward facing and backwards facing vector we modulus everything into a 180° workspace. In order to reduce the dimensionality and discretize these features we generate a histogram of orientations throughout the action sequence. These are binned into six 30° features.
The second set of orientation features deals with multi-user interactions . We define two interaction coefficients which correspond to whether or not people are facing each other in the room. The intuition is that if people are working together on a task, like for a procedure or communication, they are more likely to be looking at each other. For each person (up to 2), the interaction coefficients are the average of the pairwise dot product of the orientation with each person in the room at the time. The interaction coefficient is computed as follows where f represents a feature, N is the number of people in the room, t is time, v is the orientation vector, and c is the current sequence:
| (2) |
Recognition
The feature vector from each action sequence is classified independently with one of two techniques. The first is a multi-class Support Vector Machine (SVM) using pairwise classifiers for each action. The second is a variant of a Decision Forest (DF) called Extremely Randomized Trees [ 13 ] which obtains the same accuracy as traditional Forests but is more computationally efficient. Both methods are available using the SciKit-Learn machine learning library [ 14 ]. Additional techniques looking at principal components and manifold techniques were investigated but ultimately did not show promising results.
Seven action categories were chosen by hand based on what could be seen in the footage and what clinical research has shown is important [ 1 ]. The categories are as follows: (1) Documentation, (2) Observing and communicating with others, (3) Checking up and taking diagnostics, (4) Performing procedures, (5) Changing the Foley Catheter (CFC), (6) Using the Ventilator, and (7) Other. Each of these is represented between 5 and 47 times in our data.
Validation was done using a leave-one-out strategy. For each iteration, all but one of the actions is used to train the system and that one removed sequence is tested on. The test set was then individually classified by the SVM and DF classifiers.
Results and Discussion
Our results are based on a dataset from one day at the PICU for a total of 5.5 hours of footage. This dataset includes 122 action sequences totaling 2 hours and 12 minutes of care related interactions. During this period, many different people enter the room including nurses, doctors, parents, and other staff personnel. Each sequence was labeled as a single action with the help of the patient’s attending doctor.
Automated Task Recognition
In table 1 , we report accuracies. The leave-one-out procedure is used for all reported results. Recognition accuracy for each task category is calculated by averaging the number of action sequences correctly classified over the total number of such sequences. The overall accuracy is the average of per-task accuracy weighted by the number of samples for each task in our dataset.
Table 1:
Activity categories and the corresponding recognition accuracies for each category. The results of the Decision Forest are an average over the search space.
| Actions | Samples | SVM (%) | DF (%) |
|---|---|---|---|
|
| |||
| Documenting | 11 | 54.5 | 63.6 |
| Observing | 47 | 70.2 | 83.8 |
| Checking up | 28 | 64.3 | 74.2 |
| Pf. Procedure | 14 | 42.9 | 37.1 |
| CFC | 5 | 80.0 | 100.0 |
| Using Ventilator | 9 | 40.0 | 33.3 |
| Other | 8 | 50.0 | 55.0 |
|
| |||
| Overall Avg | 60.6 | 69.5 | |
The SVM hyperparameter is set to C = 100 using grid search on a coarse grid. A radial basis kernel was used in all our experiments. Other kernels such as linear, polynomial, and sigmoid were tested but did not perform as well. For the DF, hyperparameters F , the maximum number of features to be used in each tree and T , the total number of trees must be pre-selected. To achieve optimal accuracy while preventing over fitting we set F = 5 to use shallow trees of maximum height 5. We report performance averaged over T = {20, 25, 30, 40, 50}.
The DF classifier consistently outperforms the SVM classifier. Average overall accuracies are 60.6% for the SVM and 69.5% for the DF. Note that a chance classifier would have yielded a much lower accuracy of 14.3%.
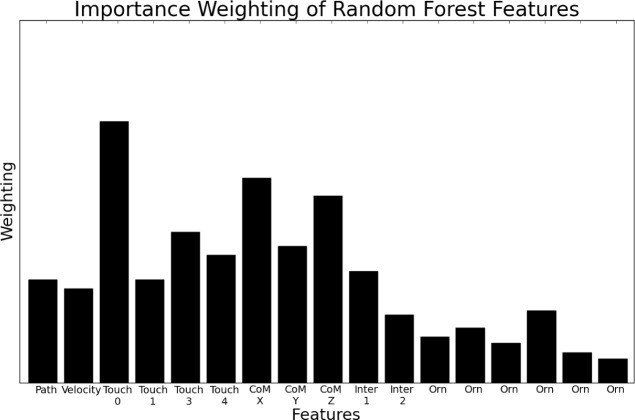
Figure 3 shows the relative importance of individual features for our task. These correspond to learned weights for the DF classifier with F = 5 and T = 20. A DF resamples features in its trees based on these relative importance weights. We see that all features have a significant impact, although relative positional information from the proximity sensors and center of mass are most highly weighted.
Figure 3:
Importance weighting for each feature as used in the Decision Forest. P ath is path length, P rox is a Proximity Sensor, C oM is Center of Mass, I nter is an interaction coefficient, and θ is a part of the orientation histogram.
Task Summarization
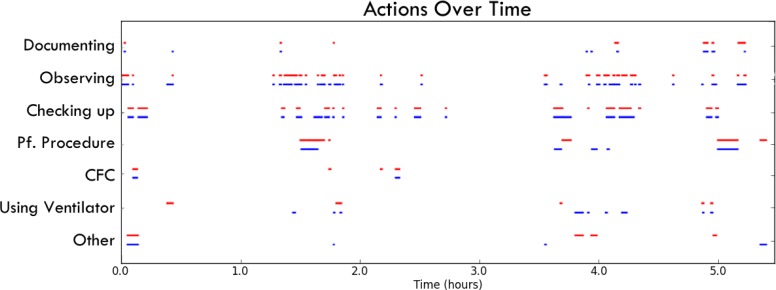
Figure 4 depicts the distribution of each action category over time. Each line represents an action from our dataset marked by its start and end time. Each action is represented twice: the hand-labeled actions are shown in red and the classified actions based on the DF classifier with 20 trees 1 are shown in blue. We see that the automatically recognized labels match the hand-labeled labels closely. Signifi-cant sources of error include misidentification of procedure and ventilator related sequences. The procedure category is a heterogeneous mixture of sequences as different procedures require different actions to be performed. Classification accuracy for this task will likely improve as more training samples become available. Similarly, in our data, little time was spent in front of the ventilator and a larger training dataset should improve performance.
Figure 4:
Time and duration of events that happen in the ICU over the 5.5 hour span of our dataset. Each activity is split into it’s corresponding action category. Red (top lines) represents the ground truth labels and blue (bottom lines) represents the action labels output by the Decision Forest.
Several clinical insights can be gleaned from the analysis shown in figure 4 . In addition to showing when tasks are typically performed, this representation also shows how frequently these tasks are performed and whether there are any patterns that suggest lapses in care. For example, the Foley Catheter is supposed to be changed approximately hourly though the recorded data shows that this is not the case. One can argue our system could be used to generate alerts for the caregiver when critical tasks are missed.
In figure 5 , we show time spent on each task computed using our automated logger versus using the physician labeled data. The two distributions are similar. In our data, caregivers are present in the room for 41% of the time. As expected, much of this time is spent checking up on patients.
Figure 5:
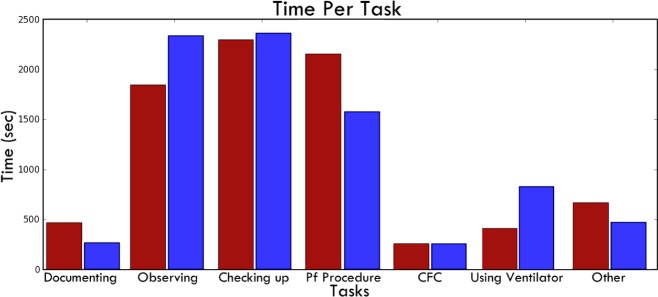
Comparison of the duration of each kind of task in our dataset based on the (red) hand-annotated tasks and our (blue) automated system using the Decision Forest.
Limitations in the size of the current dataset prevent us from relying too much on the current results. By incorporating hundreds of hours of footage we believe the output could be much more meaningful.
Conclusion
In this paper we have proposed a novel set of 3D sensing-based algorithms that can be used to capture the processes of care giving in the ICU. Our preliminary results show that an automated task analysis system using non-invasive depth range sensors has the potential to provide a highly granular information capture useful for optimizing work-flow, improving efficiency and increasing patient safety
We see several avenues for further development. Our current single-sensor setup cannot capture a complete representation of the ICU room. This results in some actions that are performed outside the field of view of the sensor to be mis-represented in the overall distribution of activities shown in figure 5 . By incorporating multiple depth sensors we hope to form a more complete model of the room. From a recognition standpoint, our current models are fairly simple and do not exploit the rich structure present in the activity stream. For example, rather than learning a single classifier for recognizing procedures, learning classifiers geared towards individual procedures will likely improve performance. Exploiting temporality in the sequence of tasks performed may also improve our classification accuracy. The current system does not assign roles (nurses vs. family vs. the attending doctor) to individuals in the room. We think identifying these can help understand activity patterns by roles of caregivers and how care is coordinated between them.
Our approach offers a significant departure from tools currently used for quality improvement and can be used to fill in gaps in our understanding of the current clinical environment. While our results are not currently robust enough for clinical use, we think with further improvements a similar system could realistically be used in the ICU.
Acknowledgments
This material was funded in part by a fellowship from Intuitive Surgical, Johns Hopkins University internal funds, and the National Science Foundation Graduate Research Fellowship under Grant Number DGE-1232825. Some equipment was provided by the Johns Hopkins University Applied Physics Lab.
Footnotes
These results do not vary significantly as the number of trees in the DF classifier increases.
References
- [1]. Gurses A , Carayon P , Wall M . Impact of performance obstacles on intensive care nurses workload, perceived quality and safety of care, and quality of working life . Health Services Research . 2008 doi: 10.1111/j.1475-6773.2008.00934.x. [DOI] [PMC free article] [PubMed] [Google Scholar]
- [2]. Henneman E , Gawlinski A , Giuliano K . Surveillance: A strategy for improving patient safety in acute and critical care units . Crit Care Nurse . 2012 doi: 10.4037/ccn2012166. [DOI] [PubMed] [Google Scholar]
- [3]. Fackler JC , Watts C , Grome A , Miller T , Crandall B , Pronovost P . Critical care physician cognitive task analysis: an exploratory study . Crit Care . 2009 doi: 10.1186/cc7740. [DOI] [PMC free article] [PubMed] [Google Scholar]
- [4]. Dixon-Woods M , Bosk C . Learning through observation: the role of ethnography in improving critical care . Current Opinion in Critical Care . 2010 doi: 10.1097/MCC.0b013e32833ef5ef. [DOI] [PubMed] [Google Scholar]
- [5]. Herasevich V , Pickering BW , Dong Y , Peters SG , Ognjen G . Informatics infrastructure for syndrome surveillance, decision support, reporting, and modeling of critical illness . Mayo Clin Proc . 2010 doi: 10.4065/mcp.2009.0479. [DOI] [PMC free article] [PubMed] [Google Scholar]
- [6]. Woeltje K , McMullen K , Butler A , Goris A , Doherty J . Electronic surveillance for healthcare-associated central line-associated bloodstream infections outside the intensive care unit . Infect Control Hosp Epidemiol . 2011 doi: 10.1086/662181. [DOI] [PubMed] [Google Scholar]
- [7]. Hug C . 2009 . Detecting hazardous intensive care patient episodes using real-time mortality models . MIT PhD Thesis . [Google Scholar]
- [8]. Saria S , Rajani A , Gould J , Koller D , Penn A . Integration of early physiological responses predicts later illness severity in preterm infants . Science Translational Medicine . 2010 doi: 10.1126/scitranslmed.3001304. [DOI] [PMC free article] [PubMed] [Google Scholar]
- [9]. Padoy N . Workflow monitoring based on 3D motion features . International Conference on Computer Vision (ICCV) ; 2009 . [Google Scholar]
- [10]. Duong TV , Bui HH , Phung DQ , Venkatesh S , Ave R , Park M . Activity recognition and abnormality detection with the switching hidden semi-markov model . International Conference on Computer Vision and Pattern Recognition (CVPR) ; 2005 . [Google Scholar]
- [11]. Kasteren TV , Noulas A , Englebienne G , Krose B . Accurate activity recognition in a home setting . In Ubiquitous Computing . 2008 [Google Scholar]
- [12]. Sung J , Ponce C , Selman B , Saxena A . Human Activity Detection from RGBD Images . American Association of Artificial Intelligence . 2011 [Google Scholar]
- [13]. Geurts P , Ernst D , Wehenkel L . Extremely randomized trees . Machine Learning . 2006 [Google Scholar]
- [14]. Pedregosa F , Weiss R , Brucher M . Scikit-learn : Machine Learning in Python . Journal of Machine Learning Research . 2011 [Google Scholar]


