Reduction of a plasma membrane-localized sucrose transporter decreases carbon allocation to secondary walls of wood fibers.
Abstract
Wood formation in trees requires carbon import from the photosynthetic tissues. In several tree species, including Populus species, the majority of this carbon is derived from sucrose (Suc) transported in the phloem. The mechanism of radial Suc transport from phloem to developing wood is not well understood. We investigated the role of active Suc transport during secondary cell wall formation in hybrid aspen (Populus tremula × Populus tremuloides). We show that RNA interference-mediated reduction of PttSUT3 (for Suc/H+ symporter) during secondary cell wall formation in developing wood caused thinner wood fiber walls accompanied by a reduction in cellulose and an increase in lignin. Suc content in the phloem and developing wood was not significantly changed. However, after 13CO2 assimilation, the SUT3RNAi lines contained more 13C than the wild type in the Suc-containing extract of developing wood. Hence, Suc was transported into developing wood, but the Suc-derived carbon was not efficiently incorporated to wood fiber walls. A yellow fluorescent protein:PttSUT3 fusion localized to plasma membrane, suggesting that reduced Suc import into developing wood fibers was the cause of the observed cell wall phenotype. The results show the importance of active Suc transport for wood formation in a symplasmically phloem-loading tree species and identify PttSUT3 as a principal transporter for carbon delivery into secondary cell wall-forming wood fibers.
In trees, the majority of the assimilated carbon dioxide accounting for biomass increase is deposited in the secondary cell walls of wood. In several tree species, most of this carbon is derived from Suc imported from leaves (Turgeon, 1996). Suc transport from leaves to wood occurs in the phloem sieve elements, where a pressure flow mechanism is thought to drive the movement of solutes from source to sink tissues (Münch, 1930; Knoblauch and Peters, 2010). In Münch’s pressure flow model, a high source tissue solute concentration causes an osmotic pressure driving the uptake of water and a subsequent flow of water and solutes toward sink tissues with lower solute concentration and osmotic pressure. In most tree species, including Populus spp., phloem loading is thought to occur passively through the symplasm (Davidson et al., 2011; Fu et al., 2011). In this process, Suc is thought to move passively by diffusion through plasmodesmata connecting mesophyll cells and into the phloem sieve element/companion cells of the source leaves. In addition to phloem loading in leaves, the maintenance of the source-to-sink flow requires that the sink tissues are actively lowering the phloem solute concentration either through metabolism or export (Münch, 1930; Van Bel, 2003). Therefore, it can be hypothesized that active Suc transport from the phloem into developing wood may be important for wood formation in Suc-transporting trees.
Our knowledge of the molecular mechanisms involved in the radial phloem-to-developing wood Suc transport is very limited. In trees, this transport of Suc is thought to occur mainly through ray cells. Ray cells are symplasmically connected parenchyma cells that have an important function in the nutrient exchange between phloem and wood (Van Bel, 1990). Symplasmic connections between phloem and ray cells appear to be rare in most investigated plant species (Van Bel, 1990). However, in Populus × canadensis wood, symplasmic phloem-to-ray transport appeared to dominate (Sauter and Kloth, 1986). Sauter and Kloth (1986) estimated the minimum radial carbon flux rate from the rate of starch accumulation in ray cells, concluding that only a symplasmic radial carbon transport route could explain the observed starch accumulation rates. Additional support for the predominance of the wood ray cell route in phloem unloading was provided by stem section autoradiographs of 14CO2-labeled 2-year-old spruce (Picea spp.) trees showing clear labeling of ray cells (Langenfeld-Heyser, 1987).
The export of solutes from ray cells to the developing wood is thought to occur primarily across so-called contact pits located between ray cells and fibers (Barnett, 1981; Van Bel, 1990). The mature pits are spherical porous openings crossing the cell walls of two neighboring cells, allowing solute transport between lignified cells, whereas developing pits have been observed to contain symplasmic connections in some species but not in others (Barnett, 1981). For example, electron microscopy images of differentiating tracheids in Pinus radiata wood did not show symplasmic connections (Barnett and Harris, 1975), whereas clear connections were documented in the developing fiber pits of Aesculus hippocastanum (Barnett, 1981). Anatomical studies of the developing pit structure in Populus spp. are limited, but investigation of symplasmic connectivity in the developing wood of hybrid aspen (Populus tremula × Populus tremuloides) using symplasmic fluorescent tracers did not reveal connections between rays and developing vessels and fibers (Sokołowska and Zagórska-Marek, 2012). This observation suggested that, during wood formation, Suc is exported across the ray cell plasma membrane and imported across the plasma membrane of the developing fibers and vessels. Thus, at least in Populus spp., this step in the radial wood Suc import pathway may involve active transport.
Suc/H+ symporters (SUTs) facilitating active Suc import into cytosol have been identified in several plant species (Lalonde et al., 2004; Kühn and Grof, 2010). According to the current nomenclature, SUTs are classified into groups I to IV based on their phylogenetic relationship (Sauer, 2007). The sequenced Populus trichocarpa genome encodes for five functional SUTs representing group II (PtSUT1 and PtSUT3), group III (PtSUT5 and PtSUT6), and group IV (PtSUT4; Payyavula et al., 2011). Quantitative reverse transcription-PCR (qPCR) analysis of SUT transcript levels in greenhouse-grown Populus tremula × Populus alba showed PtaSUT1 transcripts in phloem and roots, PtaSUT3 transcripts primarily in stems undergoing secondary growth, and PtaSUT4, PtaSUT5, and PtaSUT6 transcripts ubiquitously throughout the tree (Payyavula et al., 2011). Interestingly, microarray transcript profiling of different wood developmental stages in greenhouse-grown hybrid aspen showed an increase in PttSUT1 and/or PttSUT3 transcript levels during secondary cell wall formation (Hertzberg et al., 2001). The coding sequences of PttSUT1 and PttSUT3 are 90% identical; hence, the complementary DNA microarray probe may have hybridized to both transcripts. The expression patterns of the other PttSUTs during wood formation is not known, since the microarray used by Hertzberg et al. (2001) only included a probe for PttSUT1/PttSUT3.
Of the Populus spp. SUTs, only PtaSUT4 has been studied in detail. Similar to orthologous group IV SUTs from barley (Hordeum vulgare) and Arabidopsis (Arabidopsis thaliana; Endler et al., 2006; Schneider et al., 2012), a GFP:PtaSUT4 fusion protein was localized to the vacuolar tonoplast membrane in tobacco (Nicotiana tabacum) protoplasts (Payyavula et al., 2011). In agreement with the qPCR results, in situ hybridization of PtaSUT4 transcripts in source leaf lamina and stem cross sections showed a clear signal, supporting a role for PtaSUT4 in Suc transport in these tissues. Reduction of PtaSUT4 expression in greenhouse-grown P. tremula × P. alba using a 35S promoter-driven SUT4RNAi construct resulted in Suc accumulation in source leaves, phloem, and developing wood (Payyavula et al., 2011). No effect on wood anatomy or biosynthesis was reported for the PtaSUT4RNAi lines, but the lines did show a modest reduction in total shoot biomass (Payyavula et al., 2011). Payyavula et al. (2011) interpreted the PtaSUT4RNAi phenotype to reflect an important role of tonoplast Suc transport in the modulation of Suc export from leaves as well as the maintenance of Suc homeostasis in sink tissues.
To explore the role of active Suc transport in the radial phloem-to-wood pathway, we first quantified transcript levels of all P. tremula SUTs at different wood developmental stages from cambium to maturation/cell death. This analysis established that the previously observed increase in PttSUT1 and/or PttSUT3 transcript levels during secondary cell wall formation (Hertzberg et al., 2001) was due to PttSUT3. The group II SUTs, to which also Populus spp. SUT3 belongs, have been mainly associated with phloem loading and transport in apoplasmically loading species such as potato (Solanum tuberosum), tobacco, and Arabidopsis (Riesmeier et al., 1994; Burkle et al., 1998; Gottwald et al., 2000). However, the function of group II SUTs in symplasmic phloem loaders such as Populus spp. has not been investigated, nor has the role of SUTs during secondary cell wall biosynthesis in wood. To examine the function of Populus spp. SUT3 during wood formation, we generated transgenic hybrid aspen SUT3RNAi lines, where the RNA interference construct was expressed under the control of a promoter driving expression during secondary cell wall formation. Reduction of PttSUT3 transcript levels in developing wood led to decreased carbon allocation to secondary cell walls, as shown by thinner fiber cell walls, while at the same time the accumulation of 13C in developing wood after 13CO2 supply was not reduced. Thus, our results supported a central role for Populus spp. SUT3 in Suc import to secondary cell wall-forming wood fibers.
RESULTS
Characterization of SUT Expression during Wood Formation
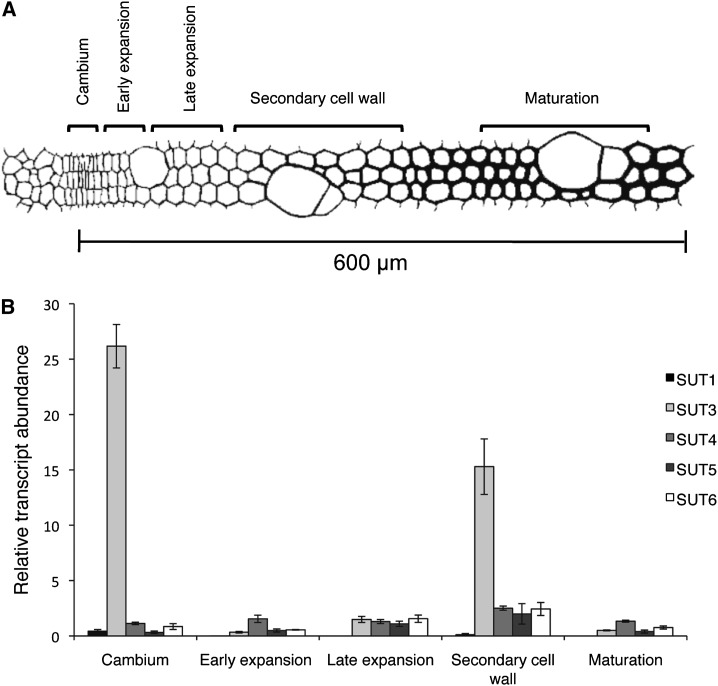
The P. trichocarpa genome encodes for five Suc transporters (PtSUT1, PtSUT3, PtSUT4, PtSUT5, and PtSUT6; Payyavula et al., 2011). To investigate the expression of Populus spp. SUTs at different stages of wood formation, we analyzed SUT transcript levels in cambium, early expansion, late expansion, secondary cell wall, and maturation/cell death zones using qPCR. Samples were harvested from approximately 45-year-old P. tremula trees on July 7, 2010, at Mullkälen, Sweden. Anatomical inspection and viability staining of wood showed that all trees were undergoing active wood formation (Supplemental Fig. S1). Total RNA from frozen microtome-cut sections corresponding to cambium, early expansion, late expansion, secondary cell wall, and maturation/cell death zones was isolated from three independent trees. qPCR with gene-specific primers showed PtSUT1 transcript levels to be low in the cambium and below detection in the developing wood. PtSUT4, PtSUT5, and PtSUT6 transcript levels were stable across the developing wood, while PtSUT3 transcripts were highest in the cambium, low in the early expansion zone, and increased in the late expansion zone to peak during secondary cell wall formation (Fig. 1). The latter observation suggested a role for PtSUT3 in Suc transport to secondary cell wall-forming cells.
Figure 1.
PttSUT transcript levels during wood development. A, Illustration of wood developmental zones, defined as cambium, early expansion, late expansion, secondary cell wall, and maturation, adapted from Hertzberg et al. (2001). B, Relative transcript abundance of PttSUTs in different developmental zones of developing wood. Error bars represent se of three biological replicates.
Populus Spp. SUT3 Is a Plasma Membrane-Localized Suc Transporter
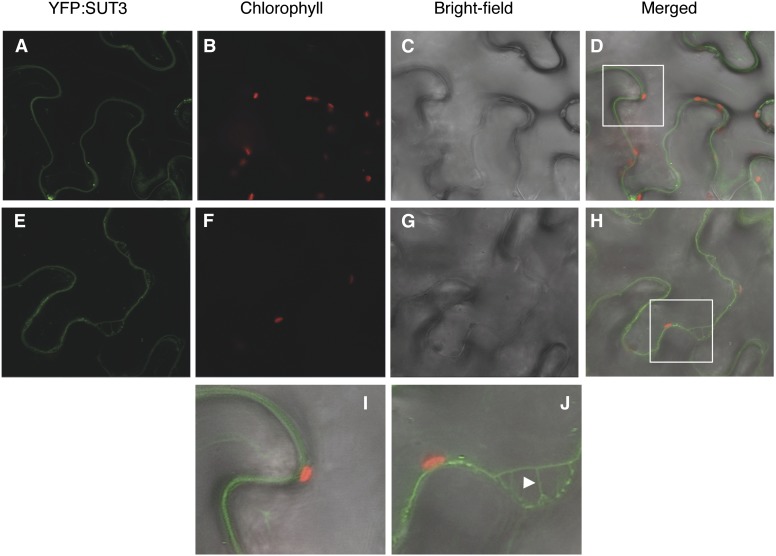
Populus spp. SUT3 (POPTR_0019s11560) is a functional Suc transporter, as shown by a previous study where P. tremula × P. alba SUT3 complemented a yeast mutant deficient in Suc uptake from the growth medium (Payyavula et al., 2011). In our work, we used the hybrid aspen as a model system to investigate PttSUT3 function during secondary cell wall biosynthesis. To determine the subcellular location of PttSUT3, a yellow fluorescent protein (YFP):PttSUT3 fusion construct was transiently expressed in Nicotiana benthamiana leaf epidermis. YFP:SUT3 signal was not observed on the vacuole side of the chloroplasts (Fig. 2). Furthermore, plasmolysis experiments clearly showed the presence of YFP:PttSUT3 in Hechtian strands characteristic of plasma membrane localization (Fig. 2). Thus, similar to the other characterized dicot group II transporters (Sauer, 2007), PttSUT3 imports Suc across the plasma membrane.
Figure 2.
Subcellular localization of PttSUT3. A, YFP:PttSUT3 signal in N. benthamiana leaf epidermis. B, Chlorophyll autofluorescence. C, Bright-field image of epidermis. D, Merged A to C. E, YFP:PttSUT3 signal 20 min after plasmolysis in 1 m NaCl. F, Chlorophyll autofluorescence after plasmolysis. G, Bright-field image after plasmolysis. H, Merged E to H. I and J, Magnification of the selected areas (white rectangles) in D and H. I, Position of the chloroplast in relation to the YFP:SUT3 signal. J, Detachment of the plasma membrane from the cell wall accompanied by the formation of Hechtian strands (arrowhead).
SUT3RNAi Increased the Internode Number and Decreased the Total Leaf Area
To investigate the function of PttSUT3 during secondary cell wall formation in wood, we expressed a SUT3RNAi construct under the control of the P. trichocarpa GLYCOSYLTRANSFERASE43B (GT43B) promoter. The SUT3RNAi sequence corresponds to a 140-bp fragment of the PttSUT3 coding sequence (Supplemental Table S1). The RNAi sequence is also similar to PttSUT1 but not to the other PttSUTs. However, Populus SUT1 is not expressed in developing wood (Fig. 1; Payyavula et al., 2011), whereas GT43B is expressed during secondary cell wall formation, while the expression in other tissues is low or absent (Supplemental Fig. S2; Aspeborg et al., 2005; Lee et al., 2011). In situ hybridization with a GT43B probe showed specific labeling of cells undergoing secondary cell wall biosynthesis in Populus spp. (Zhou et al., 2007). The GT43B promoter-driven SUT3RNAi, therefore, is designed to target SUT3 in developing wood. Agrobacterium tumefaciens-mediated transformation of stem pieces resulted in 18 independent SUT3RNAi transgenic lines. Three independent transgenic lines were selected for further characterization based on reduced PttSUT3 transcript levels in the stems of in vitro-grown trees. The lines were amplified from cuttings, named SUT3RNAi line 1, line 2, and line 3, and used in all subsequent experiments.
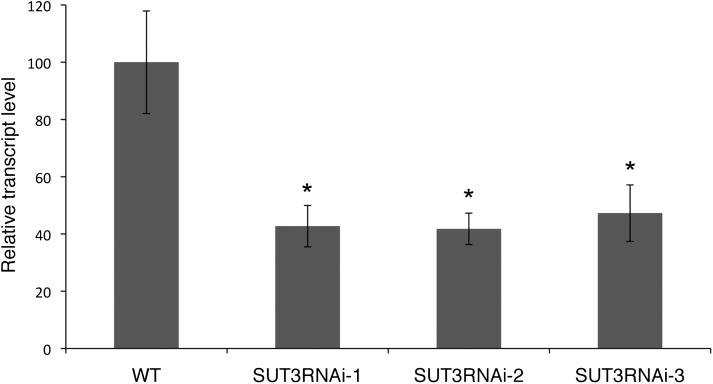
SUT3RNAi lines and the corresponding wild type were grown on soil under greenhouse conditions for 8 weeks. qPCR analysis of PttSUT3 transcript levels in developing wood showed that the expression of PttSUT3 was reduced to 40% to 46% of the wild-type level in the transgenic trees (Fig. 3). The developing wood used for RNA isolation also included cambium, where the SUT3 expression is expected to be high (Fig. 1) but where GT43B::SUT3RNAi was expected not to be expressed. Hence, the reduction in PttSUT3 expression during secondary cell wall formation may be more pronounced than indicated by the qPCR results.
Figure 3.
PttSUT3 transcript levels in developing wood of the wild type (WT) and SUT3RNAi lines. Error bars represent se of four biological replicates. Asterisks indicate P value comparison with the wild type: *P < 0.05 (Student’s t test).
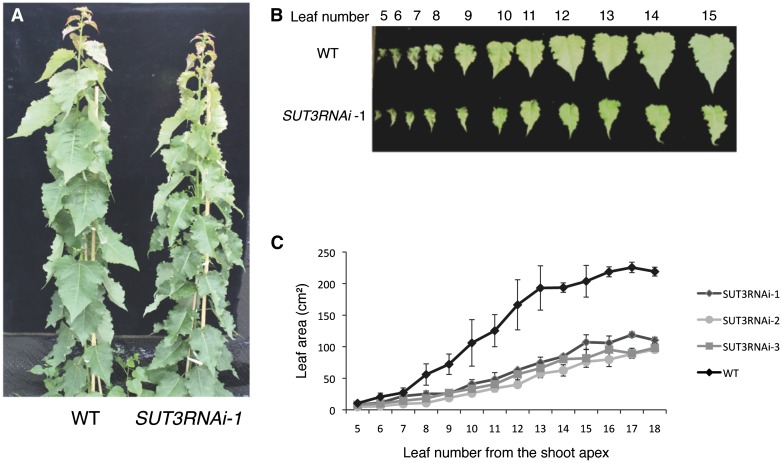
The greenhouse-grown 2-month-old SUT3RNAi lines showed a moderate but significant reduction in height as well as stem thickness compared with the wild type (Fig. 4A; Table I). There was also a clear decrease in the rate of leaf growth in the SUT3RNAi lines, resulting in approximately 50% reduction in final leaf size (Fig. 4C). The difference in leaf size was less pronounced in young leaves but started to increase after leaf 7 counted from the top (Fig. 4C). The linear leaf expansion phase had shifted from leaf 7 to leaf 13 in the wild type from leaf 9 to leaf 15 in SUT3RNAi (Fig. 4C). Hence, the duration of the leaf expansion phase was similar between the wild type and SUT3RNAi, but the rate of leaf expansion was decreased, resulting in smaller leaves. The average number of internodes per stem length increased from 0.3 internodes per centimeter in the wild type to 0.4 internodes per centimeter in the SUT3RNAi lines (Table I). Hence, the effect of smaller leaves on the total photosynthetic area was partly alleviated by the increase in internode (leaf) number.
Figure 4.
Phenotype of SUT3RNAi lines. A, Two-month-old greenhouse-grown wild-type (WT) and SUT3RNAi trees. B, Comparison of wild-type and SUT3RNAi leaves. C, Leaf area in the wild type and SUT3RNAi. Error bars represent se of three biological replicates.
Table I. Diameter, height, and internode numbers of the wild type and SUT3RNAi lines at harvest.
Values shown are means ± se (n = 7 biological replicates). Student’s t test P values are denoted with asterisks: *P < 0.05, **P < 0.01.
| Parameter | Wild Type | SUT3RNAi-1 | SUT3RNAi-2 | SUT3RNAi-3 |
|---|---|---|---|---|
| Stem diameter (mm) | 12.3 ± 0.3 | 11.3 ± 0.4* | 10.6 ± 0.1** | 11.3 ± 0.3* |
| Stem height (cm) | 178 ± 1.7 | 167 ± 2.3** | 153 ± 2.8** | 161 ± 1.7** |
| Internode number | 58 ± 2 | 67 ± 2** | 59 ± 3 | 63 ± 2** |
| Average number of internodes per cm | 0.3 ± 0.005 | 0.4 ± 0.007** | 0.4 ± 0.004** | 0.4 ± 0.004** |
SUT3RNAi Trees Had Thinner Wood Fiber Walls
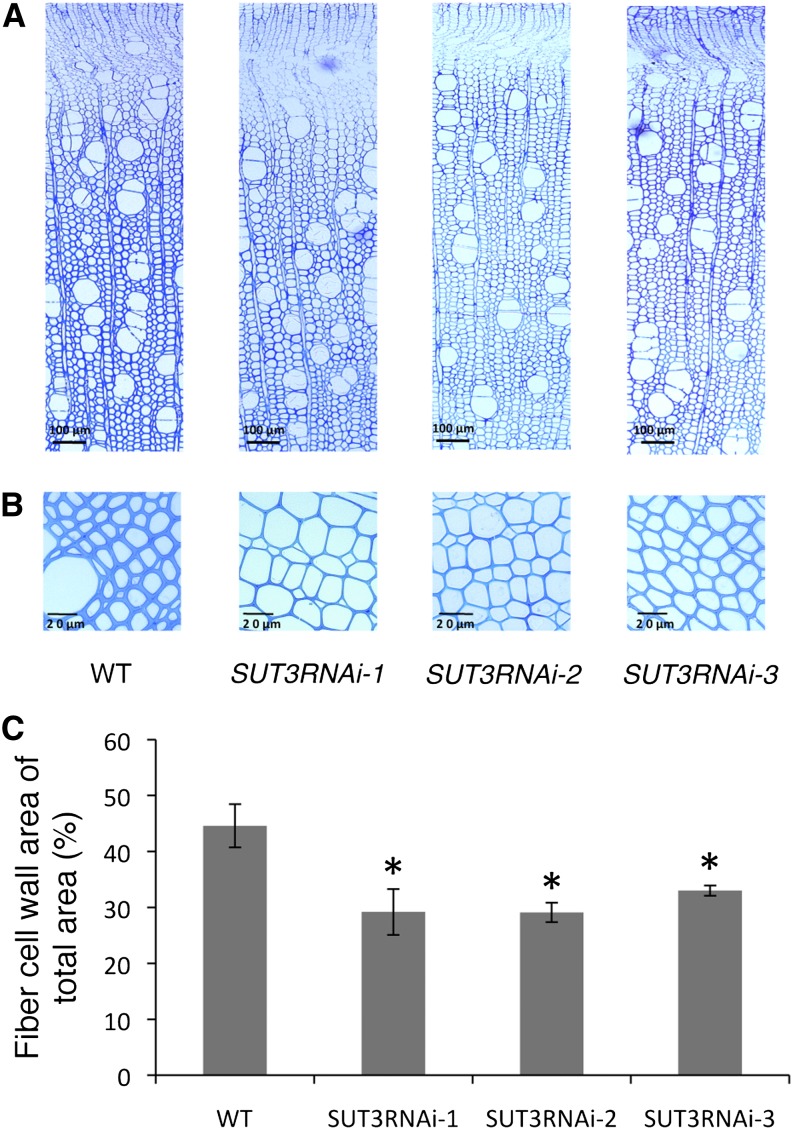
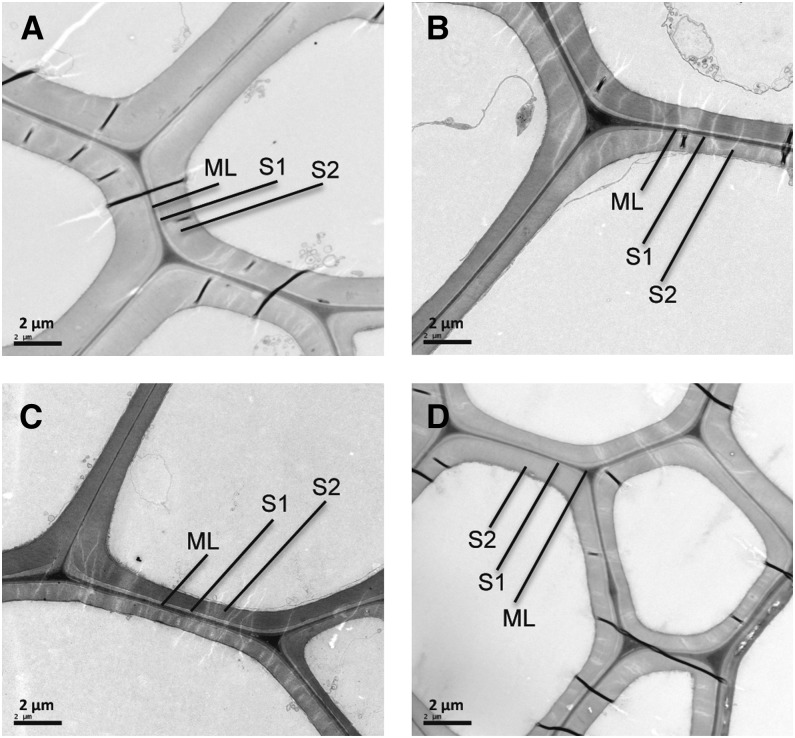
Light microscopy and transmission electron microscopy analyses were used to investigate the effect of SUT3RNAi on wood anatomy. Visual inspection of transverse sections of stem 20 cm above soil revealed no obvious change in the overall anatomy of SUT3RNAi (Fig. 5A). All SUT3RNAi lines showed clearly thinner mature fiber walls compared with the wild type (Fig. 5B). Quantification of the fiber wall area in four biological replicates per line confirmed this phenotype (Fig. 5C). Transmission electron microscopy images of mature fiber walls showed the difference in wall thickness to be due to thinner secondary cell wall (Fig. 6).
Figure 5.
Wood anatomy and fiber wall area in the wild type (WT) and SUT3RNAi lines. A and B, Light microscopy images of representative stem sections. C, Fiber cell wall area of mature xylem fiber cells. Error bars represent se of four biological replicates. Asterisks indicate P value comparison with the wild type: *P < 0.05 (Student’s t test). [See online article for color version of this figure.]
Figure 6.
Transmission electron microscopy images of representative mature wood fiber walls in the wild type (A), SUT3RNAi-1 (B), SUT3RNAi-2 (C), and SUT3RNAi-3 (D). Cell wall layers are indicated as middle lamella (ML), S1, and S2.
Comparison of mature wood fiber walls between SUT3RNAi and the wild type using cell-specific Fourier transform/infrared (FT-IR) microspectroscopy combined with orthogonal projection to latent structures discriminant analysis (Gorzsás et al., 2011) showed a difference in the fiber wall chemotype in all lines (Supplemental Fig. S3). The major differences in the FT-IR spectra of the SUT3RNAi lines included a decrease in the intensity of the –C=O vibration at around 1,740 cm−1 (Supplemental Fig. S3). Since cellulose does not contain –C=O bonds, the source of this change is likely to be derived from hemicelluloses and/or pectins. Considering the relative amounts of major biopolymers in secondary cell walls, these changes are more likely to originate from hemicelluloses than from pectins. This was further supported by the changes observed in the spectral region of 900 to 1,100 cm−1, which is dominated by various vibrations associated with carbohydrates. There was also a shift of the –C-O band from around 1,250 to 1,210 cm−1, indicating more flexible, possibly less cross-linked, cell wall polymers. Moreover, bands associated with lignin (aromatic -C=C- vibrations at 1,510 and 1,595 cm−1) showed significant changes, also pointing toward a less cross-linked structure in the SUT3RNAi lines (decreased 1,510:1,595 band ratio; Zhong et al., 2000). However, it is unclear from the FT-IR spectra whether the observed cross-linking changes are attributable to lignin alone or originate from changes in the cross links between lignin and cell wall carbohydrates.
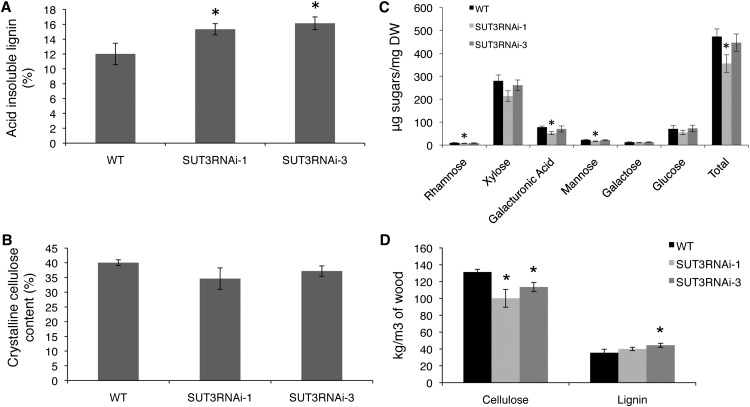
To further investigate how cell wall biosynthesis was affected in SUT3RNAi lines, the proportions of the main wall polymers in extractive and starch-free wood were quantified in lines 1 and 3. Klason lignin analysis revealed a small but significant increase in the proportion of lignin in both RNA interference lines (Fig. 7A). Updegraff cellulose analysis (Updegraff, 1969) showed a slight, albeit statistically nonsignificant, decrease in the proportion of cellulose for lines 1 and 3 (Fig. 7B). Analysis of cell wall monosugars revealed a significant decrease in total cell wall monosugars in line 1, which was due to a decrease in mannose and galacturonic acid (Fig. 7C). However, this decrease was not observed in line 3. When estimating the amount of carbon allocated to wood, it is often more meaningful to normalize cell wall data against wood volume rather than dry weight. Hence, to estimate whether the amount of cellulose and lignin per volume of wood was reduced, the wood bulk density was first measured and defined as dry weight per wet volume. Wood density was decreased in line 1 by approximately 12% and in line 3 by approximately 7% compared with the wild type (Table II). Using the density values to derive the cellulose and lignin amounts per volume of wood revealed a clear cellulose reduction in both transgenic lines, while lignin was slightly increased (Fig. 7D).
Figure 7.
Analysis of extractive and starch-free wood in the wild type (WT) and SUT3RNAi lines. A, Acid-insoluble lignin. B, Crystalline cellulose. C, Cell wall monosugars. DW, Dry weight. D, Estimation of cellulose and lignin content per volume of wood. Error bars represent se of four biological replicates. Asterisks indicate P value comparison with the wild type: *P < 0.05 (Student’s t test).
Table II. Wood bulk density, fiber area, and number of fiber cells per 10,000 μm2 in the wild type and SUT3RNAi lines.
Values shown are means ± se (n = 4 biological replicates). Student’s t test P values are denoted with asterisks: *P < 0.05.
| Parameter | Wild Type | SUT3RNAi-1 | SUT3RNAi-3 |
|---|---|---|---|
| Bulk density (kg m−3) | 295 ± 6 | 260 ± 11* | 275 ± 10 |
| Fiber area of total area (%) | 80 ± 0.9 | 78 ± 0.6 | 79 ± 0.4 |
| Number of fiber cells per 10,000 μm2 | 58 ± 3 | 58 ± 3 | 59 ± 3 |
Differences in wood density may be caused by changes in overall lumen-to-cell wall ratio. Such changes, for example, may occur as a result of altered vessel-to-fiber ratio, differences in cell number, or the morphology of xylem cells. No difference in the number of fibers or in the relative fiber area between the wild type and SUT3RNAi lines 1 and 3 was observed (Table II). Hence, the reduced wood density in SUT3RNAi was most likely due to a reduction in the fiber cell wall thickness and a corresponding increase in fiber lumen size.
In summary, SUT3RNAi reduced the wood density and thickness of the secondary cell walls of wood fibers, and this was accompanied by a decrease in cellulose and an increase in lignin. In addition, the FT-IR analysis indicated a changed fiber wall structure in all transgenic lines.
SUT3RNAi Had No Effect on CO2 Assimilation
Reduced levels of group II SUT transcripts have been associated with reduced photosynthesis in tobacco (Burkle et al., 1998). Several reports have also shown a positive correlation between sink strength and the photosynthetic efficiency of source leaves in several plant species, including soybean (Glycine max), sugarcane (Saccharum officinarum), and Populus spp. (Clough et al., 1981; McCormick et al., 2006; Coleman et al., 2008). These observations raised the possibility that the SUT3RNAi wood phenotype could be due to general carbon limitation. To investigate this, we measured the source leaf CO2 assimilation rate under different photosynthetic active-light intensities. No difference between SUT3RNAi lines and the wild type was observed (Supplemental Fig. S4), establishing that reduced photosynthetic efficiency was not the cause of the observed wood phenotype. However, it remained possible that the reduction in source leaf size in SUT3RNAi (Fig. 4) may have reduced the amount of carbon available for wood biosynthesis.
Specific Reduction of Carbon Allocation to Fiber Walls in SUT3RNAi
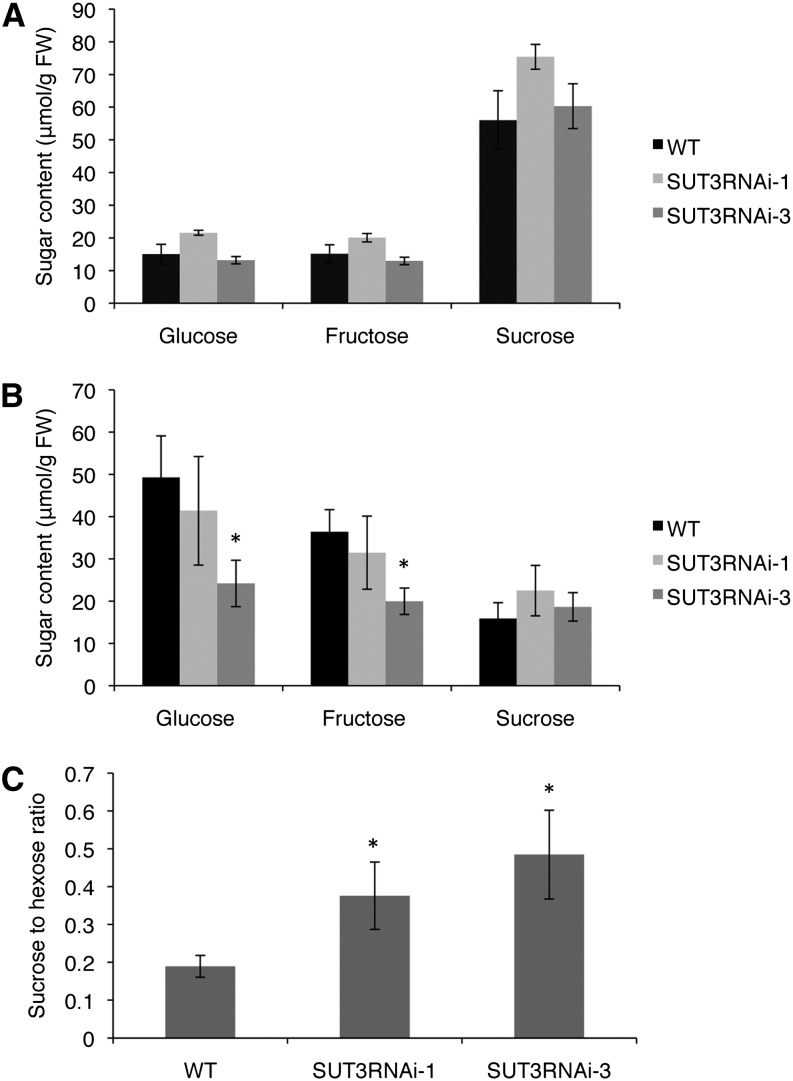
To further elucidate how SUT3RNAi was inhibiting carbon allocation to wood secondary cell walls, we first measured the levels of Suc, Glc, and Fru in phloem and developing wood. No significant difference in any of the sugars was observed in the phloem (Fig. 8A). In developing wood, line 3 exhibited decreased Glc and Fru levels (Fig. 8B), which could suggest reduced carbon flux from Suc to the hexose pools. Line 1 showed an increase in the Suc level in developing wood, and although not significant, this may explain why no reduction in the total Glc and Fru pool was observed in this line. When the Suc-to-hexose ratio was compared, all of the SUT3RNAi lines showed an increase in developing wood (Fig. 8C).
Figure 8.
A and B, Analysis of Suc, Glc, and Fru content in phloem (A) and in developing wood (B) of the wild type (WT) and SUT3RNAi lines. FW, Fresh weight. C, Suc-to-hexose ratio in developing wood. Error bars represent se of four biological replicates. Asterisks indicate P value comparison with the wild type: *P < 0.05 (Student’s t test).
Analysis of the soluble sugar pool sizes gives limited information on the status of carbon flux into developing wood. Therefore, to gain a better understanding of how SUT3RNAi is affecting carbon allocation at the whole-tree level, we developed a 13CO2 isotope-labeling system to study carbon allocation from photosynthetic tissues to developing wood. In this experiment, 8-week-old greenhouse-grown trees were placed in a sealed transparent plastic tent with controlled temperature and supplied a pulse of 13CO2 followed by sampling in ambient CO2. After 13CO2 assimilation, part of the 13C is exported to the developing wood, presumably mostly in the form of Suc. Hence, the measurement of 13C amount in developing wood after 13CO2 assimilation can be used to estimate carbon import to developing wood. To do this, the amount of 13C in the total ethanol-soluble fraction of developing wood was quantified using elemental analyzer-isotope ratio mass spectrometry. We first established a suitable 13CO2 incubation time and the time it took for 13C isotope label to reach the developing wood in wild-type trees. A 4-h 13CO2 pulse and sampling at 0, 4, 8, and 12 h showed that the 13C was detected in the developing wood after 4 h and continued to accumulate at least until 12 h (data not shown). An 8-h time frame, therefore, was deemed suitable for the comparison of 13C translocation rate between wild-type and SUT3RNAi trees.
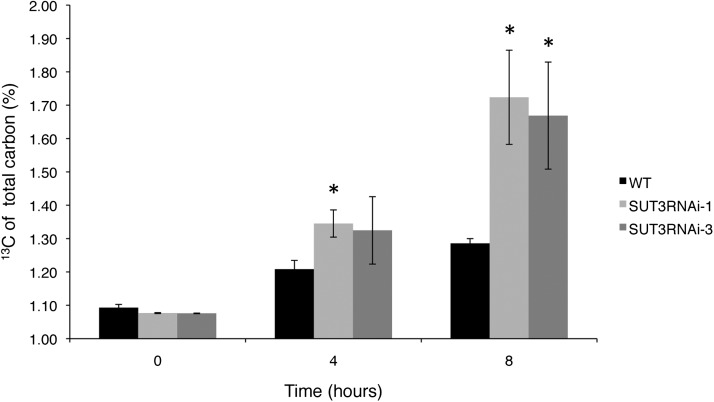
SUT3RNAi and wild-type trees were given a 4-h pulse of 13CO2, and samples were harvested at 0, 4, and 8 h. Interestingly, all of the SUT3RNAi lines accumulated more 13C in the soluble fraction of developing wood compared with the wild type. This 13C accumulation was apparent in lines 1 and 3 after 4 h and in all lines after 8 h, with lines 1 and 3 showing significant label accumulation (Fig. 9).
Figure 9.
Accumulation of 13C in the ethanol-soluble fraction of developing wood in 2-month-old trees labeled with 13CO2. 13CO2 was supplied for 4 h, and samples were harvested at 0, 4, and 8 h after the start of the labeling. Error bars represent se of three biological replicates. Asterisks indicate P value comparison with the wild type (WT): *P < 0.05 (Student’s t test).
In summary, the unchanged total Suc pool in developing wood and the 13C accumulation in the ethanol-soluble fraction suggested that Suc transport into the developing wood of the SUT3RNAi lines was not limiting. Instead, the incorporation of carbon from the soluble fraction into secondary cell walls was reduced, as shown by the thinner wood fiber walls. A likely explanation for this observation is that the Suc import into the secondary cell wall-forming cells was inhibited in the SUT3RNAi lines.
DISCUSSION
Molecular mechanisms of carbon allocation to wood are poorly understood, but they are likely to involve active transport of sugars. Suc is the main transported form of carbon in several trees, and SUTs responsible for the proton gradient-driven transport of Suc have been identified from several tree species, including Betula pendula (Wright et al., 2000), Juglans regia (Decourteix et al., 2006), and Populus spp. (Payyavula et al., 2011). Here, we investigated the role of SUTs in carbon import into secondary cell wall-forming wood fibers of aspen.
Transcript profiling of the SUT gene family across developing wood indicated a role for PtSUT3 in cambium and during secondary cell wall formation (Fig. 1). The high cambial PtSUT3 transcript levels correlated with fast-dividing cambial cells requiring Suc for the biogenesis of new cells. In the early and late expansion zones, xylem cells undergo primary wall biosynthesis and turgor pressure-driven growth (Mellerowicz et al., 2001), and during this stage, the PtSUT3 transcript levels decreased relative to cambium. A clear increase in PtSUT3 transcript levels was observed during secondary cell wall formation, when the majority of the wood biomass is formed, and the levels decreased again toward the maturation and cell death zone (Fig. 1). Thus, PtSUT3 transcript levels in developing wood correlated with carbon demand for radial growth.
To investigate the function of PttSUT3 during secondary cell wall biosynthesis in wood, we used the promoter of GT43B to drive the expression of a SUT3RNAi construct. We reasoned that the use of the GT43B promoter for SUT3RNAi expression was likely to prevent substantial effects on cambial PttSUT3 expression, which may have led to severe growth phenotypes. Three independent SUT3RNAi lines with 40% to 46% remaining PttSUT3 transcript in developing wood were selected for characterization. The reduction in PttSUT3 transcripts correlated with the reduced fiber wall area in all SUT3RNAi lines (Fig. 5). Thinner secondary walls of fibers are a reliable indicator of reduced carbon allocation to wood. A similar phenotype was observed in transgenic hybrid aspen with reduced wood fructokinase activity, which led to a reduction in cellulose (Roach et al., 2012). We also observed reduced cross-linking of fiber wall polymers in SUT3RNAi by FT-IR, possibly caused by changes in the cell wall polymer proportions.
Quantification of extractive free wood polymer proportions per dry weight showed a significant increase in lignin accompanied by a tendency to decreased cellulose in SUT3RNAi (Fig. 7, A and B). The changes in the proportions of wood cell wall polymers were most likely reflecting the primary effect of SUT3RNAi on the carbohydrate fraction of secondary cell walls: the amount of lignin per gram of dry weight increased when cellulose decreased. The nature of cell wall changes became more obvious when the decrease in the SUT3RNAi wood density was taken into consideration. Per volume of wood, SUT3RNAi lines clearly contained less cellulose, whereas lignin content was modestly increased (Fig. 7D). Carbon for lignin biosynthesis is also derived from the imported Suc; however, lignification continues in the maturation/cell death zone, where SUT3 expression is low and SUT3RNAi is expected not to be active (Fig. 1; Supplemental Fig. S2). At this stage, carbon for lignin may be supplied by ray cells, which remain alive in the maturation/cell death zone. This hypothesis is supported by recent evidence from Zinnia elegans cell culture and Arabidopsis ex periments showing that lignification continues after cell death and that this process is supported by the adjacent living parenchymatic cells (Pesquet et al., 2013).
In addition to the wood fiber wall phenotypes, the height and diameter growth of SUT3RNAi lines was modestly affected (Table I). All lines also showed a clear increase in the average number of internodes per centimeter of stem (from 0.3 to 0.4), accompanied by an approximately 50% decrease in mature leaf size (Table I; Fig. 4). Although SUT3RNAi was expected to be primarily active in secondary cell wall-forming cells, a direct effect on young leaves and shoot tip cannot be excluded. A general sink role for the J. regia group II SUT (JrSUT1) was postulated based on high JrSUT1 transcript levels in diverse sink tissues such as roots, female flowers, and stem, while the transcripts were barely detected in source leaves (Decourteix et al., 2006). However, qPCR analysis detected no PtaSUT1 transcripts in shoot tip and developing leaves and only very low levels of PtaSUT3, arguing against a function of Populus spp. group II SUTs in these sink tissues (Payyavula et al., 2011). Hence, it is possible that the leaf area and number were influenced indirectly by the reduction of PttSUT3 in developing wood. In this context, it is interesting that woody species transport significant amounts of carbon in xylem; for example, 9% to 28% of the carbon delivered to leaves in 3-month-old Populus spp. trees over a diurnal cycle was derived from sugars transported by the transpiration stream (Mayrhofer et al., 2004). It is possible that SUT3RNAi reduced the amount of carbon transported to shoot tips and growing leaves in the transpiration stream. However, further experiments are needed to investigate how SUT3RNAi affected internode number and leaf area.
The shoot growth phenotypes complicated the interpretation of the SUT3RNAi effect, since a decrease in photosynthetic area may have reduced the amount of carbon available for wood secondary cell wall biosynthesis. However, we did not observe significant differences in Suc levels in the developing wood (Fig. 8), suggesting that Suc was not limiting. Reduced group II SUT expression has been shown to result in reduced CO2 assimilation in tobacco (Burkle et al., 1998), raising the possibility that the carbon flux to wood may have been reduced in SUT3RNAi, even though the wood Suc pool size was similar to that in the wild type. However SUT3RNAi had no effect on the rate of CO2 assimilation (Supplemental Fig. S4), and 13CO2 pulse-chase experiments showed increased 13C accumulation in developing wood in the SUT3RNAi lines, showing that Suc movement from photosynthetic tissues into developing wood was not constrained (Fig. 9). Together with the observed thinner fiber walls and reduced wood density, the accumulation of 13C in the soluble extract of the SUT3RNAi wood was likely due to reduced Suc transport into secondary cell wall-forming cells.
Lateral Suc transport in developing wood is thought to occur symplasmically in the ray cells, as discussed in the introduction. Solute transport in rays has been hypothesized to be facilitated by cytoplasmic streaming propelled by cytoskeletal components, including microtubules, microfilaments, and myosin (Chaffey and Barlow, 2001), and therefore may be independent of SUT activity. The YFP:PttSUT3 localized to the plasma membrane in epidermal cells of tobacco leaves in a transient expression assay (Fig. 2), supporting a model where PttSUT3 is responsible for Suc import across the plasma membrane during secondary cell wall formation in developing wood. The mechanism of Suc export from plant cells was recently revealed by the identification of SUCROSE EFFLUX CARRIERS (SWEETs) in Arabidopsis (Chen et al., 2012). The Populus spp. genome encodes for 31 SWEETs, some of which are expressed in developing wood (A. Mahboubi and T. Niittylä, unpublished data). Hence, the current model of apoplasmic Suc transport between neighboring cells (Braun, 2012) suggested that the Populus spp. SWEETs are responsible for Suc export from ray cells followed by SUT3-mediated Suc import into fibers undergoing secondary cell wall formation. In the future, it will be important to localize the PttSUT3 in developing wood to test this hypothesis. The possibility of symplasmic connections between ray cells and developing vessels/fibers also needs further investigation to assess the possible contribution of symplasmic transport.
Nonetheless, our results suggested that symplasmic transport or apoplasmic Suc cleavage followed by hexose sugar import into the secondary cell wall-forming wood fibers was unable to compensate for the reduction in PttSUT3 levels. Hence, based on the presented data, it is concluded that PttSUT3 imports carbon into the secondary cell wall-forming wood fibers, making this SUT a critical component in the wood formation of trees.
MATERIALS AND METHODS
Plant Material and Growth Conditions
Transgenic and wild-type hybrid aspen (Populus tremula × Populus tremuloides) trees were micropropagated, grown in vitro for 4 weeks, and then transferred to soil. Trees were grown in the greenhouse at 20°C/15°C (light/dark) with 50% to 70% humidity and an 18-h-light/6-h-dark photoperiod. Approximately 1 L of 0.2% Rika-S fertilizer (nitrogen:phosphorus:potassium, 7:1:5; Weibulls Horto; http://www.weibullshorto.se) was applied every 7 d. Trees were harvested after 10 weeks in the greenhouse, and samples were frozen in liquid nitrogen and stored in −80°C. Developing wood used for gene expression, soluble sugar, and 13C isotope analyses was obtained by peeling the bark and scraping the wood tissues from the bottom one-third of the stem excluding the section 0 to 20 cm above the soil. The phloem sample for sugar analysis was collected by scraping the inside of the pealed bark from the same stem section. The remaining wood was cleaved to remove the pith, freeze dried, and used for wet chemistry analysis. Sections for anatomy, fiber wall area, and FT-IR measurements were prepared from stem 20 cm above the soil.
Samples for SUT family transcript level analysis in different wood developmental zones were harvested from three 45-year-old aspen (Populus tremula) trees on July 7, 2010, at Mullkälen, Sweden. Trees were cut with a motor saw, and stem pieces were frozen in liquid nitrogen. Sections were made from different wood developmental zones (cambial, early expansion, late expansion, developing xylem, and maturation/cell death zones) as described previously (Hertzberg et al., 2001).
SUT3RNAi Vector Construction and Hybrid Aspen Transformation
The RNA interference cassette was created in the pBluescript SK+ vector using a 140-bp fragment of PttSUT3 in the sense and antisense orientations. The RNA interference cassette was then inserted into the pENTR-D-TOPO entry vector (Invitrogen; www.invitrogen.com) and moved into the pK2GW7 destination vector (Karimi et al., 2002), where the 35S promoter was replaced by a 1,490-bp promoter fragment of Populus trichocarpa GL43B. Hybrid aspen was transformed as described by Nilsson et al. (1992).
Subcellular Localization of PttSUT3
The coding sequence of PttSUT3 was cloned into the pB7WGY2 binary vector (Karimi et al., 2002). Transient tobacco (Nicotiana tabacum) leaf Agrobacterium tumefaciens-mediated transformation was performed as described (Sparkes et al., 2006), and yellow fluorescent protein fluorescence was imaged with a Leica SP2 confocal microscope (http://www.leica-microsystems.com).
Growth Analysis
For stem height, the distance from the bottom of the stem to the shoot tip was measured. The stem diameter was measured 20 cm above the soil. The number of internodes was counted from the first visible internode to the internode 20 cm above the soil. The leaf area was measured using ImageJ software (rsbweb.nih.gov) from scaled leaf photographs.
Transcript Analysis
Quantitative real-time PCR was used for transcript abundance analysis. To assess the transcript levels of all hybrid aspen SUTs along the wood developmental zones, tangential sections were made from different wood developmental stages using a cryotome. Total RNA was extracted from the sections using the miRNeasy Micro Kit (Qiagen; www.qiagen.com) with on-column DNase (Qiagen) treatment. One hundred nanograms of total RNA was amplified using the MessageAmp Premier RNA Amplification Kit (Ambion; http://www.invitrogen.com/ambion). The concentration of amplified RNA was adjusted to 250 ng µL−1. To analyze the SUT3 transcript abundance in developing wood of greenhouse-grown wild-type and SUT3RNAi lines, developing wood including the tissue from the cambium to the cell death/maturation zone was scraped into liquid nitrogen and homogenized. RNA was isolated from the homogenized scrapings using the Plant RNeasy kit (Qiagen). qPCR was performed using the CFX96 real-time system (Bio-Rad; http://www.bio-rad.com/), and double-stranded DNA was detected with SYBRGreen (Bio-Rad). Based on the stability of expression, the 26S proteasome transcript level was used for normalization in the wood developmental series. Actin and ubiquitin transcript levels were used as reference genes in total developing wood samples. Relative transcript level was calculated using the delta quantification cycle method (Pfaffl, 2001). Gene-specific primers used for SUT transcript analysis are listed in Supplemental Table S1.
Wood Anatomy and Wet Chemical Analysis
For wood anatomy analysis, 1-mm cross sections were prepared from the middle of the internode located 20 cm above the ground. Sections were fixed in 3% (v/v) glutaraldehyde containing 2% (v/v) paraformaldehyde in sodium cacodylate buffer (0.1 m; pH 7.2). Fixed sections were then dehydrated through an ethanol series and embedded in LR White resin (www.agarscientific.com). Cross sections (0.5 μm) were cut using a microtome, and the sections were stained with toluidine blue. Mature wood cell wall images were recorded approximately 1 mm from the cambium using a Leica DMLB light microscope and a Leica DC300 camera (www.leicamicrosystems.com). Fiber cell wall area was calculated from the images using ImageJ software (rsbweb.nih.gov). Fiber cell number in mature wood was counted from the same images.
For cell wall polymer analysis, freeze-dried mature wood was ground to powder using a ball mill. Extractive free wood was then prepared by extraction with 70% ethanol for 30 min at 95°C, followed by chloroform:methanol (1:1) for 5 min at room temperature and two washes with acetone. To remove starch, the wood powder was then treated overnight at 37°C with 1,000 units of α-amylase (Roche; http://www.roche.com) in 0.1 m potassium phosphate buffer, pH 7. Crystalline cellulose content was determined using the Updegraff method (Updegraff, 1969) followed by an anthrone assay for the detection of released Glc (Melvin, 1953). Lignin content was measured by the Klason lignin method (Fengel and Wegener, 2003). For the quantification of hemicellulose sugars, 0.5 mg of extractive free wood was methanolyzed using 2 m HCl/methanol followed by trisil reagent (1,1,3,3,3-hexamethyldisilazane + trimethylchlorosilane + pyridine, 3:1:9) derivatization using the Sylon HTP kit (Supelco; http://www.sigmaaldrich.com) as described (Sweeley et al., 1963). The monosugar contents were then determined on a gas chromatograph-mass spectrometer (7890A/5975C; Agilent Technologies; www.agilent.com).
Wood Density Measurement
Wood density was measured on an oven dry weight per wet volume basis. Wood pieces were placed in water on an XA105 analytical balance with precision of 0.01 mg (Mettler Toledo; www.mt.com) and pushed under water to measure the sample volume based on displaced water weight. Samples were then oven dried at 102°C for 24 h and weighed again to obtain the dry mass weight. The wood density was then estimated from the dry weight-to-wet volume ratio.
Soluble Sugar Analysis
Glc, Fru, and Suc were extracted and measured as described previously by Stitt et al. (1989) and Roach et al. (2012).
13CO2 Labeling and 13C Analysis
Two-month-old trees were enclosed in a transparent tent and labeled with 0.3 mol of 13CO2 for 4 h at 25°C and relative humidity of 65% to 75%. The CO2 concentration inside the chamber was between 400 and 500 µL L−1, as determined by a WMA-4 CO2 analyzer (www.ppsystems.com) calibrated for 13CO2. The labeled trees were harvested, and the developing wood was scraped and ground in liquid nitrogen. Ethanol-soluble extract from the developing wood was dried and analyzed with an elemental analyzer isotope ratio mass spectrometer (www.thermofisher.com) to determine the 13C content.
Photosynthesis Rate Measurement
The light-response curve of the photosynthesis rate was measured for wild-type and SUT3RNAi lines at different photon irradiances (0, 50, 100, 300, 700, 1,200, 1,500, and 1,800 μmol s−1 m−2) using the Li-Cor portable gas exchange system (LI-COR 6400; http://www.licor.com).
Supplemental Data
The following materials are available in the online version of this article.
Supplemental Figure S1. Anatomy and viability staining of developing wood used for transcript profiling of PtSUTs.
Supplemental Figure S2. Expression of GT43B in hybrid aspen.
Supplemental Figure S3. FT-IR analysis of mature wood fiber walls.
Supplemental Figure S4. Analysis of the photosynthesis rate in the wild type and SUT3RNAi.
Supplemental Table S1. List of primers and the SUT3RNAi sequence.
Supplementary Material
Acknowledgments
We thank Kjell Olofsson and Lenore Johansson for help with sample preparation and microscopy, Junko Takahashi-Schmidt for help with the wood wet chemistry analysis, and Stephanie Robert for assistance with the confocal microscope.
Glossary
- qPCR
quantitative reverse transcription-PCR
- FT-IR
Fourier transform/infrared
References
- Aspeborg H, Schrader J, Coutinho PM, Stam M, Kallas A, Djerbi S, Nilsson P, Denman S, Amini B, Sterky F, et al. (2005) Carbohydrate-active enzymes involved in the secondary cell wall biogenesis in hybrid aspen. Plant Physiol 137: 983–997 [DOI] [PMC free article] [PubMed] [Google Scholar]
- Barnett JR (1981) Secondary xylem development. In JR Barnett, ed, Xylem Cell Development. Castle House Publications, Tunbridge Wells, England, pp 47–95 [Google Scholar]
- Barnett JR, Harris JM. (1975) Early stages of bordered pit formation in radiata pine. Wood Sci Technol 9: 233–241 [Google Scholar]
- Braun DM. (2012) SWEET! The pathway is complete. Science 335: 173–174 [DOI] [PubMed] [Google Scholar]
- Burkle L, Hibberd JM, Quick WP, Kuhn C, Hirner B, Frommer WB. (1998) The H+-sucrose cotransporter NtSUT1 is essential for sugar export from tobacco leaves. Plant Physiol 118: 59–68 [DOI] [PMC free article] [PubMed] [Google Scholar]
- Chaffey N, Barlow P. (2001) The cytoskeleton facilitates a three-dimensional symplasmic continuum in the long-lived ray and axial parenchyma cells of angiosperm trees. Planta 213: 811–823 [DOI] [PubMed] [Google Scholar]
- Chen LQ, Qu XQ, Hou BH, Sosso D, Osorio S, Fernie AR, Frommer WB. (2012) Sucrose efflux mediated by SWEET proteins as a key step for phloem transport. Science 335: 207–211 [DOI] [PubMed] [Google Scholar]
- Clough JM, Peet MM, Kramer PJ. (1981) Effects of high atmospheric CO2 and sink size on rates of photosynthesis of a soybean cultivar. Plant Physiol 67: 1007–1010 [DOI] [PMC free article] [PubMed] [Google Scholar]
- Coleman HD, Samuels AL, Guy RD, Mansfield SD. (2008) Perturbed lignification impacts tree growth in hybrid poplar: a function of sink strength, vascular integrity, and photosynthetic assimilation. Plant Physiol 148: 1229–1237 [DOI] [PMC free article] [PubMed] [Google Scholar]
- Davidson A, Keller F, Turgeon R. (2011) Phloem loading, plant growth form, and climate. Protoplasma 248: 153–163 [DOI] [PubMed] [Google Scholar]
- Decourteix M, Alves G, Brunel N, Améglio T, Guillio A, Lemoine R, Pétel G, Sakr S. (2006) JrSUT1, a putative xylem sucrose transporter, could mediate sucrose influx into xylem parenchyma cells and be up-regulated by freeze-thaw cycles over the autumn-winter period in walnut tree (Juglans regia L.). Plant Cell Environ 29: 36–47 [DOI] [PubMed] [Google Scholar]
- Endler A, Meyer S, Schelbert S, Schneider T, Weschke W, Peters SW, Keller F, Baginsky S, Martinoia E, Schmidt UG. (2006) Identification of a vacuolar sucrose transporter in barley and Arabidopsis mesophyll cells by a tonoplast proteomic approach. Plant Physiol 141: 196–207 [DOI] [PMC free article] [PubMed] [Google Scholar]
- Fengel D, Wegener G (2003) Wood: Chemistry, Ultrastructure, Reactions. Reprint Kessel, Remagen, Germany [Google Scholar]
- Fu QS, Cheng LL, Guo YD, Turgeon R. (2011) Phloem loading strategies and water relations in trees and herbaceous plants. Plant Physiol 157: 1518–1527 [DOI] [PMC free article] [PubMed] [Google Scholar]
- Gorzsás A, Stenlund H, Persson P, Trygg J, Sundberg B. (2011) Cell-specific chemotyping and multivariate imaging by combined FT-IR microspectroscopy and orthogonal projections to latent structures (OPLS) analysis reveals the chemical landscape of secondary xylem. Plant J 66: 903–914 [DOI] [PubMed] [Google Scholar]
- Gottwald JR, Krysan PJ, Young JC, Evert RF, Sussman MR. (2000) Genetic evidence for the in planta role of phloem-specific plasma membrane sucrose transporters. Proc Natl Acad Sci USA 97: 13979–13984 [DOI] [PMC free article] [PubMed] [Google Scholar]
- Hertzberg M, Aspeborg H, Schrader J, Andersson A, Erlandsson R, Blomqvist K, Bhalerao R, Uhlén M, Teeri TT, Lundeberg J, et al. (2001) A transcriptional roadmap to wood formation. Proc Natl Acad Sci USA 98: 14732–14737 [DOI] [PMC free article] [PubMed] [Google Scholar]
- Karimi M, Inzé D, Depicker A. (2002) Gateway vectors for Agrobacterium-mediated plant transformation. Trends Plant Sci 7: 193–195 [DOI] [PubMed] [Google Scholar]
- Knoblauch M, Peters WS. (2010) Münch, morphology, microfluidics: our structural problem with the phloem. Plant Cell Environ 33: 1439–1452 [DOI] [PubMed] [Google Scholar]
- Kühn C, Grof CPL. (2010) Sucrose transporters of higher plants. Curr Opin Plant Biol 13: 288–298 [DOI] [PubMed] [Google Scholar]
- Lalonde S, Wipf D, Frommer WB. (2004) Transport mechanisms for organic forms of carbon and nitrogen between source and sink. Annu Rev Plant Biol 55: 341–372 [DOI] [PubMed] [Google Scholar]
- Langenfeld-Heyser R. (1987) Distribution of leaf assimilates in the stem of Picea abies L. Trees Struct Funct 1: 102–109 [Google Scholar]
- Lee CH, Teng QC, Zhong RQ, Ye ZH. (2011) Molecular dissection of xylan biosynthesis during wood formation in poplar. Mol Plant 4: 730–747 [DOI] [PubMed] [Google Scholar]
- Mayrhofer S, Heizmann U, Magel E, Eiblmeier M, Müller A, Rennenberg H, Hampp R, Schnitzler JP, Kreuzwieser J. (2004) Carbon balance in leaves of young poplar trees. Plant Biol (Stuttg) 6: 730–739 [DOI] [PubMed] [Google Scholar]
- McCormick AJ, Cramer MD, Watt DA. (2006) Sink strength regulates photosynthesis in sugarcane. New Phytol 171: 759–770 [DOI] [PubMed] [Google Scholar]
- Mellerowicz EJ, Baucher M, Sundberg B, Boerjan W. (2001) Unravelling cell wall formation in the woody dicot stem. Plant Mol Biol 47: 239–274 [PubMed] [Google Scholar]
- Melvin SA. (1953) Determination of dextran with anthrone. Anal Chem 25: 1656–1661 [Google Scholar]
- Münch E (1930) Die Stoffbewegungen in der Pflanze. Gustav Fischer, Jena, Germany [Google Scholar]
- Nilsson O, Alden T, Sitbon F, Little CHA, Chalupa V, Sandberg G, Olsson O. (1992) Spatial pattern of cauliflower mosaic virus 35S promoter luciferase expression in transgenic hybrid aspen trees monitored by enzymatic assay and non-destructive imaging. Transgenic Res 1: 209–220 [Google Scholar]
- Payyavula RS, Tay KHC, Tsai CJ, Harding SA. (2011) The sucrose transporter family in Populus: the importance of a tonoplast PtaSUT4 to biomass and carbon partitioning. Plant J 65: 757–770 [DOI] [PubMed] [Google Scholar]
- Pesquet E, Zhang B, Gorzsás A, Puhakainen T, Serk H, Escamez S, Barbier O, Gerber L, Courtois-Moreau C, Alatalo E, et al. (2013) Non-cell-autonomous postmortem lignification of tracheary elements in Zinnia elegans. Plant Cell 25: 1314–1328 [DOI] [PMC free article] [PubMed] [Google Scholar]
- Pfaffl MW. (2001) A new mathematical model for relative quantification in real-time RT-PCR. Nucleic Acids Res 29: e45. [DOI] [PMC free article] [PubMed] [Google Scholar]
- Riesmeier JW, Willmitzer L, Frommer WB. (1994) Evidence for an essential role of the sucrose transporter in phloem loading and assimilate partitioning. EMBO J 13: 1–7 [DOI] [PMC free article] [PubMed] [Google Scholar]
- Roach M, Gerber L, Sandquist D, Gorzsás A, Hedenström M, Kumar M, Steinhauser MC, Feil R, Daniel G, Stitt M, et al (2012) Fructokinase is required for carbon partitioning to cellulose in aspen wood. Plant J 70: 967–977 [DOI] [PubMed] [Google Scholar]
- Sauer N. (2007) Molecular physiology of higher plant sucrose transporters. FEBS Lett 581: 2309–2317 [DOI] [PubMed] [Google Scholar]
- Sauter JJ, Kloth S. (1986) Plasmodesmatal frequency and radial translocation rates in ray cells of poplar (Populus × canadensis Moench Robusta). Planta 168: 377–380 [DOI] [PubMed] [Google Scholar]
- Schneider S, Hulpke S, Schulz A, Yaron I, Höll J, Imlau A, Schmitt B, Batz S, Wolf S, Hedrich R, et al (2012) Vacuoles release sucrose via tonoplast-localised SUC4-type transporters. Plant Biol (Stuttg) 14: 325–336 [DOI] [PubMed] [Google Scholar]
- Sokołowska K, Zagórska-Marek B. (2012) Symplasmic, long-distance transport in xylem and cambial regions in branches of Acer pseudoplatanus (Aceraceae) and Populus tremula × P. tremuloides (Salicaceae). Am J Bot 99: 1745–1755 [DOI] [PubMed] [Google Scholar]
- Sparkes IA, Runions J, Kearns A, Hawes C. (2006) Rapid, transient expression of fluorescent fusion proteins in tobacco plants and generation of stably transformed plants. Nat Protoc 1: 2019–2025 [DOI] [PubMed] [Google Scholar]
- Stitt M, Lilley RM, Gerhardt R, Heldt HW. (1989) Metabolite levels in specific cells and subcellular compartments of plant leaves. Methods Enzymol 174: 518–552 [Google Scholar]
- Sweeley CC, Bentley R, Makita M, Wells WW. (1963) Gas-liquid chromatography of trimethylsilyl derivatives of sugars and related substances. J Am Chem Soc 85: 2497–2507 [Google Scholar]
- Turgeon R. (1996) Phloem loading and plasmodesmata. Trends Plant Sci 1: 418–423 [Google Scholar]
- Updegraff DM. (1969) Semimicro determination of cellulose in biological materials. Anal Biochem 32: 420–424 [DOI] [PubMed] [Google Scholar]
- Van Bel AJE. (1990) Xylem-phloem exchange via the rays: the undervalued route of transport. J Exp Bot 41: 631–644 [Google Scholar]
- Van Bel AJE. (2003) The phloem, a miracle of ingenuity. Plant Cell Environ 26: 125–149 [Google Scholar]
- Wright DP, Scholes JD, Read DJ, Rolfe SA. (2000) Changes in carbon allocation and expression of carbon transporter genes in Betula pendula Roth. colonized by the ectomycorrhizal fungus Paxillus involutus (Batsch) Fr. Plant Cell Environ 23: 39–49 [Google Scholar]
- Zhong RQ, Morrison WH , III, Himmelsbach DS, Poole FL , II, Ye ZH. (2000) Essential role of caffeoyl coenzyme A O-methyltransferase in lignin biosynthesis in woody poplar plants. Plant Physiol 124: 563–578 [DOI] [PMC free article] [PubMed] [Google Scholar]
- Zhou GK, Zhong RQ, Himmelsbach DS, McPhail BT, Ye ZH. (2007) Molecular characterization of PoGT8D and PoGT43B, two secondary wall-associated glycosyltransferases in poplar. Plant Cell Physiol 48: 689–699 [DOI] [PubMed] [Google Scholar]
Associated Data
This section collects any data citations, data availability statements, or supplementary materials included in this article.


