Abstract
We describe here the use of nonnegative matrix factorization (NMF), an algorithm based on decomposition by parts that can reduce the dimension of expression data from thousands of genes to a handful of metagenes. Coupled with a model selection mechanism, adapted to work for any stochastic clustering algorithm, NMF is an efficient method for identification of distinct molecular patterns and provides a powerful method for class discovery. We demonstrate the ability of NMF to recover meaningful biological information from cancer-related microarray data. NMF appears to have advantages over other methods such as hierarchical clustering or self-organizing maps. We found it less sensitive to a priori selection of genes or initial conditions and able to detect alternative or context-dependent patterns of gene expression in complex biological systems. This ability, similar to semantic polysemy in text, provides a general method for robust molecular pattern discovery.
With the advent of DNA microarrays, it is now possible to simultaneously monitor expression of all genes in the genome. Increasingly, the challenge is to interpret such data to gain insight into biological processes and the mechanisms of human disease.
Various methods have been developed for clustering genes or samples that show similar expression patterns (1–5). However, these methods have serious limitations in their ability to capture the full structure inherent in the data. They typically focus on the predominant structures in a data set and fail to capture alternative structures and local behavior.
Hierarchical clustering (HC) is a frequently used and valuable approach. It has been successfully used to analyze temporal expression patterns (1), to predict patient outcome among lymphoma patients (2), and to provide molecular portraits of breast tumors (3). However, HC has the disadvantages that it imposes a stringent tree structure on the data, is highly sensitive to the metric used to assess similarity, and typically requires subjective evaluation to define clusters. Self-organizing maps (SOM) provide another powerful approach (4). They have been successfully used in similar applications, including identification of pathways involved in differentiation of hematopoietic cells and recognition of subtypes of leukemia (5). SOMs, however, can be unstable, yielding different decompositions of the data depending on the choice of initial conditions. Recently, various dimensionality reduction and matrix decomposition methods have been introduced (6–8). However, many questions remain to be resolved about such methods. These include the key issue of model selection (that is, how to select the dimensionality of the reduced representation) and the accuracy and robustness of the representation.
Here, we describe a technique for extracting relevant biological correlations, or “molecular logic,” in gene expression data. The method is designed to capture alternative structures inherent in the data and, by organizing both the genes and samples, to provide biological insight. The method is based on nonnegative matrix factorization (NMF). Lee and Seung (9) introduced NMF in its modern formulation as a method to decompose images. In this context, NMF yielded a decomposition of human faces into parts reminiscent of features such as eyes, nose, etc. By contrast, they noted that the application of traditional factorization methods, such as principal component analysis, to image data yielded components with no obvious visual interpretation. When applied to text, NMF gave some evidence of differentiating meanings of the same word depending on context (semantic polysemy) (9).
Here, we use NMF to describe the tens of thousands of genes in a genome in terms of a small number of metagenes. Samples can then be analyzed by summarizing their gene expression patterns in terms of expression patterns of the metagenes. The metagenes provide an interesting decomposition of genes, analogous to facial features in Lee and Seung's work (9) on images. The metagene expression patterns provide a robust clustering of samples. Importantly, we also introduce a methodology for model selection that highlights alternative decompositions and assesses their robustness.
We apply NMF and our model selection criterion to the problem of elucidating cancer subtypes by clustering tumor samples. We are able to demonstrate multiple robust decompositions of leukemia and brain cancer data sets.
Methods
Description of NMF Method. We consider a data set consisting of the expression levels of N genes in M samples (which may represent distinct tissues, experiments, or time points). For gene expression studies, the number N of genes is typically in the thousands, and the number M of experiments is typically <100. The data are represented by an expression matrix A of size N × M, whose rows contain the expression levels of the N genes in the M samples.
Our goal is to find a small number of metagenes, each defined as a positive linear combination of the N genes. We can then approximate the gene expression pattern of samples as positive linear combinations of these metagenes.
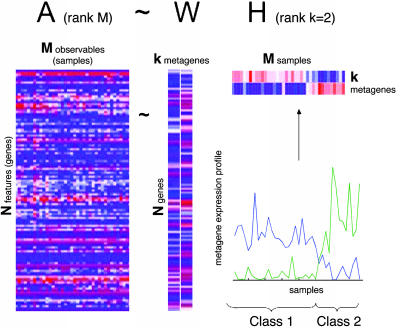
Mathematically, this corresponds to factoring matrix A into two matrices with positive entries, A ∼ WH. Matrix W has size N × k, with each of the k columns defining a metagene; entry wij is the coefficient of gene i in metagene j. Matrix H has size k × M, with each of the M columns representing the metagene expression pattern of the corresponding sample; entry hij represents the expression level of metagene i in sample j. Fig. 1 shows the simple case corresponding to k = 2.
Fig. 1.
A rank-2 reduction of a DNA microarray of N genes and M samples is obtained by NMF, A ∼ WH. For better visibility, H and W are shown with exaggerated width compared with original data in A, and a white line separates the two columns of W. Metagene expression levels (rows of H) are color coded by using a heat color map, from dark blue (minimum) to dark red (maximum). The same data are shown as continuous profiles below. The relative amplitudes of the two metagenes determine two classes of samples, class 1 and class 2. Here, samples have been ordered to better expose the class distinction.
Given a factorization A ∼ WH, we can use matrix H to group the M samples into k clusters. Each sample is placed into a cluster corresponding to the most highly expressed metagene in the sample; that is, sample j is placed in cluster i if the hij is the largest entry in column j (Fig. 1).
We note that there is a dual view of decomposition A ∼ WH, which defines metasamples (rather than metagenes) and clusters the genes (rather than the samples) according to the entries of W. We do not focus on this view here, but it is clearly of great interest.
NMF provides a natural way to cluster genes and samples, because it involves factorization into matrices with nonnegative entries. By contrast, principal component analysis provides a simple way to reduce dimensionality but requires that the matrices be orthogonal, which typically requires linear combination of components with arbitrary signs. NMF is more difficult algorithmically because of the nonnegativity requirement but provides a more intuitive decomposition of the data.
NMF Algorithm. Given a positive matrix A of size N × M and a desired rank k, the NMF algorithm iteratively computes an approximation A ∼ WH, where W and H are nonnegative matrices with respective sizes N × k and k × M. The method starts by randomly initializing matrices W and H, which are iteratively updated to minimize a divergence functional. The functional is related to the Poisson likelihood of generating A from W and H, D = Σi,j Ai,jlog(Ai,j/(WH)i,j) – Ai,j + (WH)i,j. At each step, W and H are updated by using the coupled divergence equations (10):
 |
A simpler version of the NMF update equations that minimizes the norm of the residual ||A-WH||2 has also been derived in ref. 10. When applying the method to a medulloblastoma dataset (see Results), where we knew the underlying substructure, we observed that the divergence-based update equations were able to capture a subclass that the norm-based update equations did not. This is why our implementation of NMF uses the divergence form (see Data Sets and software).
Model Selection. For any rank k, the NMF algorithm groups the samples into clusters. The key issue is to tell whether a given rank k decomposes the samples into “meaningful” clusters. For this purpose, we developed an approach to model selection that exploits the stochastic nature of the NMF algorithm. It is based on our group's previous work on consensus clustering (11) but adds a quantitative evaluation for robustness of the decomposition.
The NMF algorithm may or may not converge to the same solution on each run, depending on the random initial conditions. If a clustering into k classes is strong, we would expect that sample assignment to clusters would vary little from run to run. (Note that sample assignment depends only on the relative values in each column of H.)
For each run, the sample assignment can be defined by a connectivity matrix C of size M × M, with entry cij = 1 if samples i and j belong to the same cluster, and cij = 0 if they belong to different clusters. We can then compute the consensus matrix, C̄, defined as the average connectivity matrix over many clustering runs. (We select the number of runs by continuing until C̄ appears to stabilize; we typically find that 20–100 runs suffice in the applications below.) The entries of C̄ range from 0 to 1 and reflect the probability that samples i and j cluster together. If a clustering is stable, we would expect that C will tend not to vary among runs, and that the entries of C̄ will be close to 0 or 1. The dispersion between 0 and 1 thus measures the reproducibility of the class assignments with respect to random initial conditions. By using the off-diagonal entries of C̄ as a measure of similarity among samples, we can use average linkage HC to reorder the samples and thus the rows and columns of C̄.
We then evaluate the stability of clustering associated with a given rank k. Although visual inspection of the reordered matrix C̄ can provide substantial insight (see Fig. 3), it is important to have quantitative measure of stability for each value of k. We propose a measure based on the cophenetic correlation coefficient, ρk(C̄), which indicates the dispersion of the consensus matrix C̄. ρk is computed as the Pearson correlation of two distance matrices: the first, I-C̄, is the distance between samples induced by the consensus matrix, and the second is the distance between samples induced by the linkage used in the reordering of C̄. In a perfect consensus matrix (all entries = 0 or 1), the cophenetic correlation coefficient equals 1. When the entries are scattered between 0 and 1, the cophenetic correlation coefficient is <1. We observe how ρk changes as k increases. We select values of k where the magnitude of the cophenetic correlation coefficient begins to fall (see below).
Fig. 3.
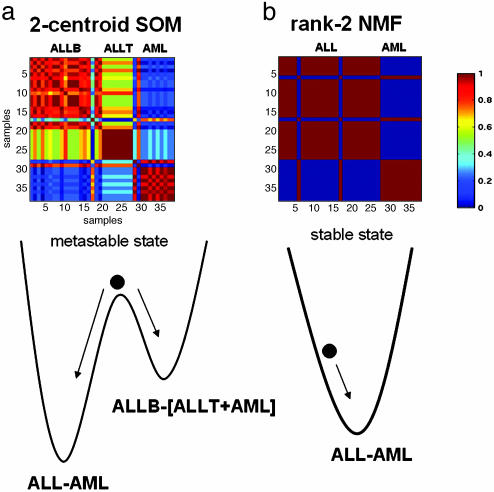
Consensus clustering matrices without reordering for data from leukemia samples averaged over 50 connectivity matrices using 5,000 of the most highly varying genes according to their coefficient of variation. (a) Consensus matrix for a two-centroid SOM shows superposition of two clustering solutions, ALL-AML and ALLB-[ALLT+AML]. A relative probability of about two-thirds is estimated by looking at the color-coded consensus: yellow (≈70%) for the first pattern and light blue (≈30%) for the second. Metastability of the two-centroid SOM with respect to random initial conditions is illustrated by the motion of a rolling ball on a double-well potential. (b) Consensus matrix for a rank-2 NMF. The 0–1 pattern indicates highly robust classification. NMF stable attractor leads to ALL-AML partition irrespective of random initial condition. The lack of reordering ordering highlights the two ALL samples that consistently cluster with the AMLs (discussed in more detail in ref. 5).
Results
We illustrate the use of NMF and our model selection criteria with three problems in elucidating cancer subtypes. The first involves acute leukemia, the second medulloblastoma, and the third a collection of central nervous system tumors.
Leukemia Data Set. The distinction between acute myelogenous leukemia (AML) and acute lymphoblastic leukemia (ALL), as well as the division of ALL into T and B cell subtypes, is well known. In an early gene expression analysis of cancer (5), we explored how SOM could rediscover these distinctions in a data set of 38 bone marrow samples (12). Here, we reuse this data set to compare various clustering methods with respect to their efficacy and stability in recovering these three subtypes and their hierarchy. We note that this data set has become a benchmark in the cancer classification community. It contains two ALL samples that are consistently misclassified or classified with low confidence by most methods. There are a number of possible explanations for this, including incorrect diagnosis of the samples. We have included them in our analysis but expect them to behave as outliers.
We first applied HC to the leukemia data. The tree structure produced by HC depends on the choice of linkage metric used to determine which groups of data points to join as the tree, or dendrogram, is constructed from the leaves upward. We used two metrics: the average linkage and average-group or centroid linkage methods. Given a tree, we obtained two clusters by cutting the tree at its top branching point. To test the stability of the clusters, we ran HC for various numbers of input genes.
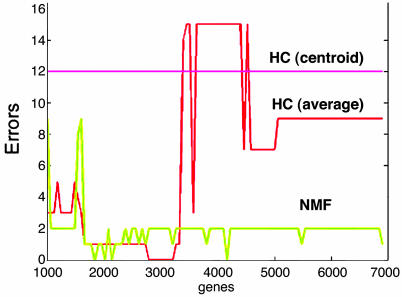
HC proved unstable in that its performance varied substantially with respect to the number of input genes (Fig. 2). It correctly found the AML–ALL distinction only when using the average linkage metric and only in the range of 1,800–3,200 input genes (the only incorrect assignments involve one of the known outlier samples). We then examined whether the tree correctly found the next important distinction: between ALL-T and -B. In fact, inspection of the trees for various numbers of genes showed that ALL-T, ALL-B, and AML samples tend to be intermingled at lower levels, and that ALL-B samples split into two groups in a more or less consistent fashion. For example, at n = 3,000 input genes (see supporting information, which is published on the PNAS web site), looking further down the tree, the ALL branch splits into two groups, with one group containing only B cell samples and the other containing B and T cell samples. The latter group finally splits at the next level into a B and a T cell group (exposing a second B cell subclass). Thus, the distinction between ALL-B and -T is not recovered a priori, inasmuch as the B cells never appear together by themselves in one branch.
Fig. 2.
Number of ALL or AML samples improperly clustered by agglomerative HC and NMF as a function of the number of features (genes). One hundred clustering computations were performed at intervals equally spaced between 1,000 and 6,913 of the most highly varying genes. Results are shown as continuous lines for clarity. HC, agglomerative HC using Pearson correlation and two different linkage methods [average and average-group (or centroid)]. NMF, a rank-2 factorization is performed with a fixed random initial condition.
We next examined the stability of SOM, which (like NMF) are defined by a stochastic procedure depending on initial conditions. We have previously shown SOM are capable of distinguishing between AML and ALL (5). However, the consensus matrix for the SOM with k = 2 classes reveals the classification is not stable. Depending on the initial conditions, SOM may split the data as [AML] vs. [ALL-T + ALL-B] or as [AML + ALL-T] vs. [ALL-B]. This ambiguity is reflected in an interference pattern in the consensus matrix (Fig. 3a). The metastability can be illustrated by a double-well potential; the SOM follows one of the two trajectories depending on the initial conditions.
We might conjecture that a SOM with k = 3 classes would distinguish ALL-T and -B, but it does not. Instead, a similar metastable situation arises (see supporting information). Rather than converging only to the expected three-class partition (ALL-T, ALL-B, AML), SOM also finds another minimum in which B and T cell ALL are mixed. As a result, the leukemias cannot be robustly clustered into the three main biological classes by a SOM with k = 3 classes. Only with four classes can SOM distinguish ALL-T and -B, with the latter split into two groups as we previously reported (5).
We then applied NMF to the data set. With rank k = 2, NMF consistently recovered the ALL-AML biological distinction with high accuracy and robustness, with respect to the number of features or genes (Fig. 2). Moreover, NMF always converges toward the same attractor, ALL-AML, regardless of initial condition (Fig. 3b).
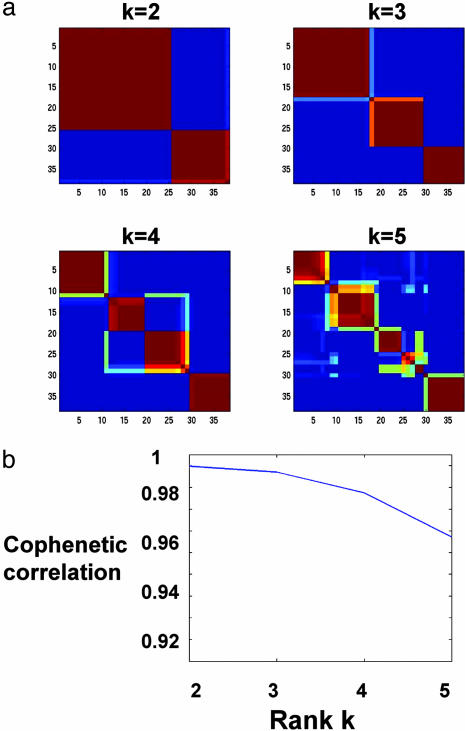
Higher ranks k reveal further partitioning of the samples. Fig. 4a shows the consensus matrices generated for ranks k = 2, 3, 4, 5. Clear block diagonal patterns attest to the robustness of models with 2, 3, and 4 classes, whereas a rank-5 factorization shows increased dispersion. This qualitative observation is reflected quantitatively in the decreased value of the cophenetic correlation ρ4 (Fig. 4b).
Fig. 4.
(a) Reordered consensus matrices averaging 50 connectivity matrices computed at k = 2–5 for the leukemia data set with the 5,000 most highly varying genes according to their coefficient of variation. Samples are hierarchically clustered by using distances derived from consensus clustering matrix entries, colored from 0 (deep blue, samples are never in the same cluster) to 1 (dark red, samples are always in the same cluster). Compositions of the leukemia clusters determined by HC of consensus matrices are as follows: for k = 2: {(25 ALL), (11 AML and 2 ALL)}, k = 3: {(17 ALL-B), (8 ALL-T and 1 ALL-B), (11 AML and 1 ALL-B)}, k = 4: {(11 ALL-B), (7 ALL-B and 1 AML), (8 ALL-T and 1 ALL-B), (10 AML)}. (b) Cophenetic correlation coefficients for hierarchically clustered matrices in a.
The clusters show a nested structure as k increases from 2 to 4, and the nesting captures the known subtypes. For k = 2, the classes correspond to ALL and AML samples. For k = 3, the partition reflects the ALL-T and -B distinction within the ALL class. For k = 4, a fourth class appears which is deemed robust by our model selection; its biological significance is unclear.
NMF has a number of strengths compared to HC and SOM in these studies. NMF appears to be more stable than HC with respect to the number of features or genes in the data set. It appears to be more stable than SOM in finding two clusters and in showing robust convergence to the three known biological classes for rank 3. Finally, NMF best elucidated the nested substructure of the data.
Medulloblastoma Data Set. We next analyzed gene expression data from childhood brain tumors known as medulloblastomas. The pathogenesis of these tumors is not well understood, but it is generally accepted that there are two known histological subclasses: classic and desmoplastic, whose differences can clearly be seen under the microscope. In previous work, we found genes whose expression was statistically correlated with those two histological classes (13).
We applied both HC and SOM to these data to see whether the desmoplastic subclass ever cleanly clustered by itself. Fig. 5 shows the dendrogram of the hierarchical structure obtained for the medulloblastoma data set. The desmoplastic samples are scattered among the leaves. There is no level of the tree where we can split the branches and expose a clear desmoplastic cluster. We applied SOM to the same data by using two to eight centroids and again were unable to find a distinct desmoplastic class.
Fig. 5.
Illustration of model selection with NMF on the medulloblastoma data set. HC used dchip's analyzer (www.biostat.harvard.edu/complab/dchip) and centroid linkage. The NMF class assignments for k = 2, 3, and 5 are shown color-coded. At k = 5, seven of nine desmoplastic samples (highlighted in red on dendrogram) fall into the same NMF class. More detailed sample class assignments are given in supporting information.
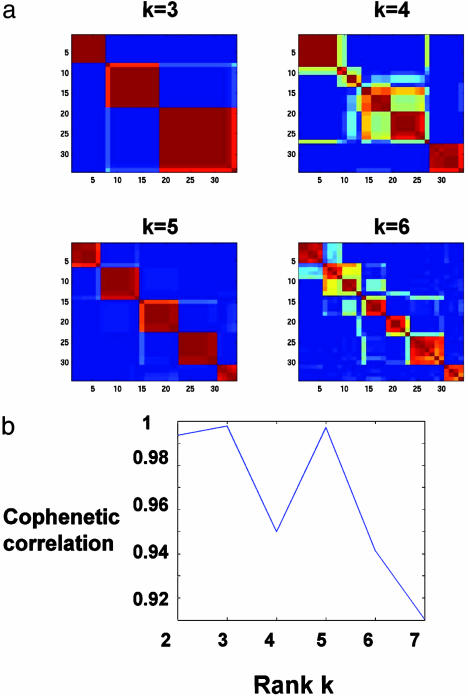
When we applied NMF to the medulloblastoma data, we were able to expose a separate desmoplastic class. NMF predicted the existence of robust classes for k = 2, 3, and 5 (Fig. 6). The desmoplastic subtype cluster appears at k = 5, where one of the discovered classes is almost entirely made up of desmoplastic samples. Even if one were unaware of the underlying biology, this clustering would stand out because of the steep drop off in the cophenetic coefficient for k > 5. NMF sample assignments for k = 2, 3, and 5, display an approximate nesting of putative medulloblastoma classes, similar to that seen in the leukemia data set (see supporting information).
Fig. 6.
(a) NMF model selection for a data set of 25 classic and 9 desmoplastic medulloblastoma tumors [n = 5,893; M = 34 (14)]. At each rank k, a consensus matrix, averaging 50 connectivity matrices, is reordered by using HC (color map as Fig. 4). In addition to a robust two-class partition (not shown), the consensus is strong for k = 3, 5, indicating reproducible partitioning of samples into two, three, and five classes but not four or six. (b) Cophenetic correlation coefficients corresponding to the HC of consensus matrices for k = 2–7 shows a dip at k = 4, where reproducibility is poor, and suggests k = 5as the largest number of classes recognized by NMF for this data set.
Central Nervous System Tumors. Finally, we present an analysis of four types of central nervous system embryonal tumors. The data set comes from our previous work (13) and consists of a total of 34 samples: 10 classic medulloblastomas, 10 malignant gliomas, 10 rhabdoids, and 4 normals, representing four distinct morphologies. The original paper (13) also analyzed eight samples from primitive nueroectodermal tumors; these did not form a distinct tight class or subclass using either supervised or unsupervised clustering and were not studied in this analysis.
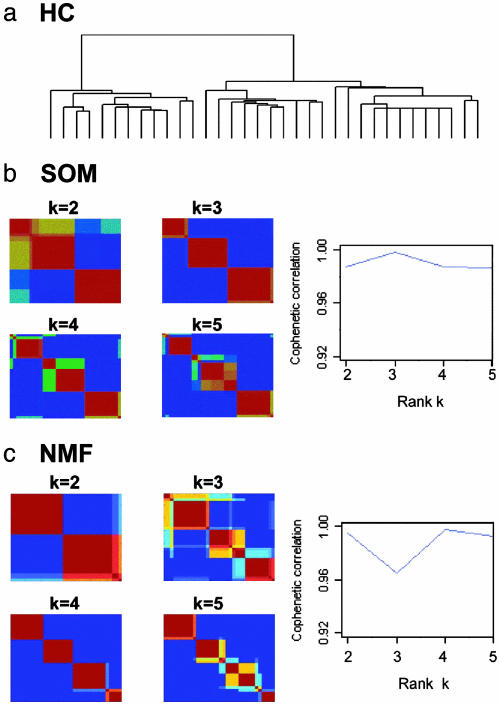
Unsupervised HC does not give a clear four-class split of the data (Fig. 7a). The dendrogram seems to suggest a split into two or three classes. Examining the actual tumor types, we find the split into two classes groups the normals and malignant gliomas on one branch and the medulloblastomas and rhabdoids on the other. At the next level, the medulloblastomas and rhabdoids are split in two subbranches, but the normal samples and gliomas stay largely clustered (see supporting information). The hierarchical dendrogram does not seem to suggest a preferred substructure consistent with the known four classes in the data.
Fig. 7.
Analysis of central nervous system embryonal tumors using 5,560 genes. The data set consists of 34 samples, including 10 classic medulloblastomas, 10 malignant gliomas, 10 rhabdoids, and 4 normals. (a) The dendrogram from HC indicates two or three major subclasses but gives no clear indication of a four-class split. (b) Reordered consensus matrices for k = 2–5 centroid SOM clusterings from 20 initial conditions. Cophenetic correlation argues for a three-class decomposition. (c) Reordered consensus matrices for 20 NMF initial conditions (50 NMF iterations each), for k = 2–5 (color scale same as Fig. 2). Cophenetic correlation coefficient suggests the existence of at most four robust classes.
SOM clustering of this data set (Fig. 7b) indicates that a three-centroid clustering is the most robust, with the highest cophenetic coefficient. As in the case of HC, the normal and malignant glioma samples consistently cluster together in this case (see supporting information). The four-centroid clustering shows instability with a corresponding drop in ρk. We do not recover the correct split into four tumor types using a SOM approach.
NMF, together with consensus clustering, gave strong evidence for a four-class split of the data with a correspondingly high cophenetic coefficient (Fig. 7c). Examining the tumor types of the samples (see supporting information), we find that only two of them are placed in the incorrect cluster. Thus, we see that NMF gives a more accurate clustering of this data set.
Discussion
We describe here the use of NMF to reduce the dimensionality of expression data from thousands of genes to a handful of metagenes. In addition, we describe a model selection methodology based on the consensus of sample assignment across random initial conditions. Although NMF is not hierarchical per se (9), we show that as the rank k increases the method uncovers substructures, whose robustness can be evaluated by a cophenetic correlation coefficient. These substructures may also give evidence of nesting subtypes. Thus, NMF can reveal hierarchical structure when it exists but does not force such structure on the data like HC does. In addition, agglomerative techniques like HC sometimes struggle to properly merge clusters with many samples. Thus, NMF may have an advantage in exposing meaningful global hierarchy.
In application to three cancer data sets, we show that NMF is able to recover biologically significant phenotypes and identify the known nested structure of leukemia classes. The use of consensus clustering with the NMF approach makes the selection of the number of classes an objective consideration of the quantitative cophenetic coefficient rather than a subjective evaluation. In the cases studied, NMF appears to be more accurate and robust to the choice of input genes than HC and more stable than SOM.
In ref. 9, Lee and Seung observed that NMF (in contrast to principal component analysis) yields a sparse parts-based representation of data useful for the recognition of features in human faces and in text. Parts are sets of elements that tend to cooccur in samples. The parts provide components or visible variables as a reduced representation of the original hidden variables. In our application to gene expression, parts refer to metagenes representing genes that tend to be coexpressed in samples. NMF decomposes gene expression patterns as an additive combination of a few metagene patterns. Just as NMF is able to distinguish different meanings of words used in different contexts (polysemy), NMF metagenes can overlap and thus expose the participation of a single gene in multiple pathways or processes. Such context dependency is not captured by standard two-way clustering methods or by supervised marker analysis that insists on mutual exclusion of features.
Whereas the original application of NMF focused on grouping elements into parts (using the matrix W), we take the dual viewpoint by focusing primarily on grouping samples into clusters using the metagene expression profiles given by the matrix H. The utility of NMF for gene expression sample clustering stems from its nonnegativity constraint, which facilitates the detection of sharp boundaries among classes. We observed that as more NMF iterations are performed, the metagene profiles become more localized in sample space and their supports overlap less (i.e., decreasing the off-diagonal portion of HHt). At the end the metagene profiles are positive, sparse, localized, and relatively independent, which makes a natural compact decomposition for interpretation. In contrast, spectral decomposition (principal component analysis or singular value decomposition) of expression data produces eigengene profiles that are completely independent but complex, dense, and globally supported.
Despite its promising features, NMF has the limitation of somewhat greater algorithmic complexity, especially compared with the simplicity of HC. This can be addressed by casting the NMF update equations in a computationally efficient matrix form. Stabilization of connectivity matrices can also be used to monitor convergence and minimize the number of NMF iterations. This forms the basis of our implementation (see Data Sets and Software)
We note that Kim and Tidor, in a recent independent study (14), have applied NMF applications to cluster genes (rather than samples) and to predict functional relationships in yeast. Heger and Holm (15) have also recently applied NMF to a different biological problem: recognition of sequence patterns among related proteins.
In summary, NMF is a powerful technique for clustering expression data and can be combined with a quantitative evaluation of the robustness of the number of clusters. When applied to data where subtypes were known, but hidden from the algorithm, it performed well and captured the hierarchical nature of the data as the number of clusters was increased. The challenge that remains is to provide a meaningful biological interpretation to the NMF discovered classes when the class labels and substructure of the data set are unknown.
Data Sets and Software. Data sets are published as supporting information. The leukemia data, containing 38 bone marrow samples hybridized on Affymetrix Hu6800 chips, is a reduced version of the original data used in ref. 5. The medulloblastoma data with 34 tumors hybridized on Affymetrix HuGeneFL is data set B from ref. 13. Codes for NMF divergence reducing equations, as well as for model selection and reordering of the consensus matrices, are provided on our website as matlab (Mathworks, Natick, MA) m-files.
Supplementary Material
Acknowledgments
We acknowledge useful discussions with members of the Cancer Genomics program (The Eli and Edythe L. Broad Institute, Massachusetts Institute of Technology and Harvard University), in particular Stefano Monti. This work was funded by grants from the National Institutes of Health. J.-Ph.B. is funded by an Informatics Fellowship grant from AstraZeneca.
Abbreviations: NMF, nonnegative matrix factorization; HC, hierarchical clustering; SOM, self-organizing maps; AML, acute myelogenous leukemia; ALL, acute lymphoblastic leukemia.
References
- 1.Eisen, M., Spellman, P., Brown, P. & Botstein, D. (1998) Proc. Natl. Acad. Sci. USA 95, 14863–14868. [DOI] [PMC free article] [PubMed] [Google Scholar]
- 2.Alizadeh, A. A., Eisen, M. B., Davis, R. E., Ma, C., Lossos, I. S., Rosenwald, A., Boldrick, J. C., Sabet, H., Tran, T., Yu, X., et al. (2000) Nature 403, 503–511. [DOI] [PubMed] [Google Scholar]
- 3.Perou, C. M., Sorlie, T., Eisen, M. B., van de Rijn, M., Jeffrey, S. S., Rees, C. A., Pollack, J. R., Ross, D. T., Johnsen, H., Akslen, L. A., et al. (2000) Nature 406, 747–752. [DOI] [PubMed] [Google Scholar]
- 4.Tamayo, P., Slonim, D., Mesirov, J., Zhu, Q., Dmitrovsky, E., Lander, E. S. & Golub, T. R. (1999) Proc. Natl. Acad. Sci. USA 96, 2907–2912. [DOI] [PMC free article] [PubMed] [Google Scholar]
- 5.Golub, T. R., Slonim, D. K., Tamayo, P., Huard, C., Gaasenbeek, M., Mesirov, J. P., Coller, H., Loh, M. L., Downing, J. R., Caligiuri, M. A., et al. (1999) Science 286, 531–537. [DOI] [PubMed] [Google Scholar]
- 6.Moloshok, T. D., Klevecz, R. R., Grant, J. D., Manion, F. J., Speier, W. F. 4th, & Ochs, M. F. (2002) Bioinformatics 18, 566–575. [DOI] [PubMed] [Google Scholar]
- 7.Gasch, A. P. & Eisen, M. B. (2002) Genome Biol. 3, research0059.1–0059.22. [DOI] [PMC free article] [PubMed] [Google Scholar]
- 8.Alter, O., Brown, P. O. & Botstein, D. (2000) Proc. Natl. Acad. Sci. USA 97, 10101–10106. [DOI] [PMC free article] [PubMed] [Google Scholar]
- 9.Lee, D. D. & Seung, H. S. (1999) Nature 401, 788–793. [DOI] [PubMed] [Google Scholar]
- 10.Lee, D. D. & Seung, H. S. (2001) Adv. Neural Info. Proc. Syst. 13, 556–562. [Google Scholar]
- 11.Monti, S., Tamayo, P., Golub, T. R. & Mesirov, J. P. (2003) Machine Learn. J. 52, 91–118. [Google Scholar]
- 12.Slonim, D. K., Tamayo, P., Mesirov, J. P., Golub, T. R. & Lander, E. S. (2000) Proceedings of the Fourth Annual International Conference on Computational Molecular Biology, RECOMB 2000, 263–272.
- 13.Pomeroy, S. L., Tamayo, P., Gaasenbeek, M., Sturla, L. M., Angelo, M., McLaughlin, M. E., Kim, J. Y., Goumnerova, L. C., Black, P. M., Lau, C., et al. (2002) Nature 415, 436–442. [DOI] [PubMed] [Google Scholar]
- 14.Kim, P. M. & Tidor, B. (2003) Genome Res. 13, 1706–1718. [DOI] [PMC free article] [PubMed] [Google Scholar]
- 15.Heger, A. & Holm, L. (2003) Bioinformatics 19, Suppl., i130–i137. [DOI] [PubMed] [Google Scholar]
Associated Data
This section collects any data citations, data availability statements, or supplementary materials included in this article.


