

Abstract
Variation in the angiotensinogen gene, AGT, has been associated with variation in plasma angiotensinogen levels. In addition, the T235M polymorphism in the AGT product is associated with an increased risk of essential hypertension in multiple populations, making AGT a good example of a quantitative-trait locus underlying susceptibility to a common disease. To better understand genetic variation in AGT, we sequenced a 14.4-kb genomic region spanning the entire AGT and identified 44 single-nucleotide polymorphisms (SNPs). Forty-two SNPs were observed both in 88 white and in 77 Japanese unselected subjects. Six major haplotypes accounted for most of the variation in this region, indicating less allelic complexity than in many other genomic regions. Although the two populations were found to share all of the major AGT haplotypes, there were substantial differences in haplotype frequencies. Pairwise linkage disequilibrium (LD), measured by the D′, r2, and d2 statistics, demonstrated a general pattern of decline with increasing distance, but, as expected in a small genomic region, individual LD values were highly variable. LD between T235M and each of the other 39 SNPs was assessed in order to model the usefulness of LD to detect a disease-associated mutation. Among the Japanese subjects, 13 (33%) of the SNPs had r2 values >0.1, whereas this statistic was substantially higher for the white subjects (occurring in 35/39 [90%]). LD between a hypertension-associated promoter mutation, A-6G, and 39 SNPs was also measured. Similar results were obtained, with 33% of the SNPs showing r2>0.1 in the Japanese subjects and 92% of the SNPs showing r2>0.1 in the white subjects. This difference, which occurs despite an overall similarity in LD patterns in the two populations, reflects a much higher frequency of the M235-associated haplotype in the white sample. These results have important implications for the usefulness of LD approaches in the mapping of genes underlying susceptibility to complex diseases.
Introduction
Much attention is now focused on the identification of susceptibility genes underlying complex diseases, through whole-genome linkage disequilibrium (LD) mapping with single-nucleotide polymorphisms (SNPs). The feasibility of such studies is currently under debate and depends explicitly on the persistence of LD between SNPs and causal mutations (Risch and Merikangas 1996; Collins et al. 1997; Kruglyak 1999; Jorde 2000; Risch 2000; Pritchard and Przeworski 2001). The ability to detect LD within a given genomic region depends on several factors. Recombination rates vary by more than an order of magnitude across the genome (Yu et al. 2001), creating substantial variation in LD levels in different genomic regions (Huttley et al. 1999; Taillon-Miller et al. 2000; Pritchard and Przeworski 2001; Reich et al. 2001). Furthermore, the extent of LD varies considerably among different populations, reflecting the effects of population structure and history (Laan and Pääbo 1997; Kidd et al. 1998, 2000; Tishkoff et al. 1998, 2000b; Zavattari et al. 2000). Finally, the presence of several disease-predisposing alleles within a susceptibility locus, each in association with a different background haplotype, can seriously compromise the ability of LD to locate the susceptibility locus (Xiong and Guo 1998). Considering the potential effects of these and other factors, it is not surprising that simulations and empirical studies have arrived at highly disparate results regarding both the expected extent of LD in the human genome and the resultant SNP density required for successful LD studies (Jorde 1995; Collins et al. 1999; Kruglyak 1999; Bonnen et al. 2000; Eaves et al. 2000; Moffatt et al. 2000; Abecasis et al. 2001; Reich et al. 2001; Stephens et al. 2001). Because of their important implications for the design of gene-mapping studies, these issues need to be resolved by additional empirical data.
AGT (MIM 106150) represents one of the few genes in which genetic variation has been shown to be associated with measurable variation in an endophenotype (plasma angiotensinogen) and in a biomedically relevant phenotype, hypertension (Jeunemaitre et al. 1992). In previous studies, we have reported that two common polymorphisms, T235M and A-6G, are significantly associated with essential hypertension (EHT) (MIM 145500) (Inoue et al. 1997; Jeunemaitre et al. 1997). The T235 allele is in nearly complete LD with A(-6) and is associated with higher plasma angiotensinogen levels than are the M235 and G(-6) alleles. These results have been replicated in many other studies (Iso et al. 2000; Pan et al. 2000; Rankinen et al. 2000; Rice et al. 2000; Sato et al. 2000), but not all (Brand et al. 1998; Bengtsson et al. 1999; Niu et al. 1999; Taittonen et al. 1999; Kato et al. 2000; Larson et al. 2000; Province et al. 2000). This inconsistency may reflect differences in phenotype definition, lack of statistical power, population history or structure, the effects of other loci, and the varying effects of several disease-predisposing variants within AGT (Corvol et al. 1999; Lalouel 2001). Nevertheless, several major meta-analyses have confirmed a significant association between AGT variation and hypertension, with a combined relative risk of ∼1.2 for the T235 allele (Kunz et al. 1997; Kato et al. 1999; Staessen et al. 1999). AGT thus represents an important locus whose variation is involved in the predisposition to a common disease.
In this study, we determined the complete genomic sequence of AGT and performed a continuous scan (14.4 kb) for sequence variation in AGT. Forty-four SNPs and a microsatellite were identified in whites and Japanese. The chimpanzee sequence was also completed, to infer the ancestral state of each SNP. We evaluate haplotypes and the pattern of LD in AGT, to provide further empirical information on the utility of LD for detection of disease genes.
Subjects and Methods
Subjects
Seventy-seven Japanese individuals unselected for disease status were recruited from outpatient clinics in Yokohama City. Informed consent was obtained from each subject, and the study was performed with the approval of the Ethical Committee of Yokohama City University. Blood samples were collected for isolation of genomic DNA. The 88 white subjects are unrelated individuals from the Utah subset of the CEPH collection.
Isolation of PAC/Bacterial Artificial Chromosome (BAC) Clone and Genome Sequence of Human and Chimpanzee AGT
A bacteriophage PAC library containing human genomic DNA pooled in a three-dimensional structure (Genome Systems) was screened for the AGT clone. The PAC library was screened by the method described elsewhere (Nakajima et al. 2000), by use of two oppositely oriented oligonucleotides (5′-AGGCTGTACAGGGCCTGCTAGT-3′ and 5′-GCCTTACCTTGGAAGTGGACGTA-3′).
A high-density hybridization filter for chimpanzee genomic DNA is available from BAC/PAC Resources, Children's Hospital Oakland Research Institute. The filters were hybridized with digoxigenin-labeled (randomly primed; Roche) probes on exon 2 of AGT. Escherichia coli bearing the clones were cultured, and BAC/PAC DNA was isolated, as described elsewhere (Nakajima et al. 2000).
Promoter and exon sequences were obtained from GenBank (accession numbers NM_000029 and X15323). Intron sequences were determined from a PAC genome clone containing AGT, by direct primer walking across the gaps. Sequencing was performed by BigDye Terminator cycle sequencing using an ABI 377 Prism automated DNA sequencer (Applied Biosystems). Interspersed repeats in the gene were identified by RepeatMasker (see the RepeatMasker Documentation web site).
Identification of SNPs
Overlapping primer sets covering the genome sequence of AGT were designed on the basis of size and overlap of PCR amplicons (table 1). Genomic DNA was subjected to PCR amplification followed by sequencing using the BigDye Terminator cycle. Polymorphisms were identified by the comparison of sequences from 72 chromosomes (36 from Japanese and 36 from whites), by the Sequencher program (Gene Code). Each polymorphism has been confirmed by reamplifying and resequencing from the same or the opposite strand. The remainder of the study subjects were sequenced only for the regions in which SNPs were identified in the first set of 72 chromosomes.
Table 1.
Oligonucleotide Sequence for SNP Genotyping in Human AGT
| Polymorphism | Sequences |
| SNP: | |
| 1 | 5′-ACAAGTGATTTTTGAGGAGTCCCTATC-3′ / 5′-GTTCAAGGAGCCACGGCATAT-3′ |
| 2 | 5′-ACAAGTGATTTTTGAGGAGTCCCTATC-3′ / 5′-GTTCAAGGAGCCACGGCATAT-3′ |
| 3 | 5′-TGTCCCTTCAGTGCCCTAATACC-3′ / 5′-CAGGGGAGAGTCTTGCTTAGGC-3′ |
| 4 | 5′-TGTCCCTTCAGTGCCCTAATACC-3′ / 5′-CAGGGGAGAGTCTTGCTTAGGC-3′ |
| 5 | 5′-TGTCCCTTCAGTGCCCTAATACC-3′ / 5′-CAGGGGAGAGTCTTGCTTAGGC-3′ |
| 6 | 5′-CGACTCCTGCAAACTTCGGTAA-3′ / 5′-CTTCTGCTGTAGTACCCAGAACAACGG-3′ |
| 7 | 5′-CGACTCCTGCAAACTTCGGTAA-3′ / 5′-CTTCTGCTGTAGTACCCAGAACAACGG-3′ |
| 8 | 5′-CGACTCCTGCAAACTTCGGTAA-3′ / 5′-CTTCTGCTGTAGTACCCAGAACAACGG-3′ |
| 9 | 5′-AAGAAGCTGCCGTTGTTCTGG-3′ / 5′-TCCTGTACCAGTCTGCTCCGTT-3′ |
| 10 | 5′-AAGAAGCTGCCGTTGTTCTGG-3′ / 5′-TCCTGTACCAGTCTGCTCCGTT-3′ |
| 11 | 5′-AACGGAGCAGACTGGTACAGGA-3′ / 5′-GAGGTCCAGTGACTTGTTCAACG-3′ |
| 12 | 5′-AACGGAGCAGACTGGTACAGGA-3′ / 5′-GAGGTCCAGTGACTTGTTCAACG-3′ |
| 13 | 5′-AACGGAGCAGACTGGTACAGGA-3′ / 5′-GAGGTCCAGTGACTTGTTCAACG-3′ |
| 14 | 5′-AACGGAGCAGACTGGTACAGGA-3′ / 5′-GAGGTCCAGTGACTTGTTCAACG-3′ |
| 15 | 5′-AACGGAGCAGACTGGTACAGGA-3′ / 5′-GAGGTCCAGTGACTTGTTCAACG-3′ |
| 16 | 5′-CCCAGCTGTGTGACGTTGAAC-3′ / 5′-GCCAGCACCTGCCCCTTCTATGTC-3′ |
| 17 | 5′-CCCAGCTGTGTGACGTTGAAC-3′ / 5′-GCCAGCACCTGCCCCTTCTATGTC-3′ |
| 18 | 5′-CTGGTTACGGGTCTGGGTGAG-3′ / 5′-GGCTTCAGCCTCAGCTGCTAC-3′ |
| 19 | 5′-GGAGGCCTCCACAAAGACCTAC-3′ / 5′-TATGTCCTACCTCCCCCAACG-3′ |
| 20 | 5′-GGAGGCCTCCACAAAGACCTAC-3′ / 5′-AGGTGGAAGGGGTGTATGTACA-3′ |
| 21 | 5′-AGGCTGTACAGGGCCTGCTAGT-3′ / 5′-GCCTTACCTTGGAAGTGGACGTA-3′ |
| 22 | 5′-AGGCTGTACAGGGCCTGCTAGT-3′ / 5′-GCCTTACCTTGGAAGTGGACGTA-3′ |
| 23 | 5′-GAAACGTGCTCCACAAGGTAACTC-3′ / 5′-CCTCCTCAGTGTCTCTTAGACACACC-3′ |
| 24 | 5′-GAAACGTGCTCCACAAGGTAACTC-3′ / 5′-CCTCCTCAGTGTCTCTTAGACACACC-3′ |
| 25 | 5′-GGAGGCTCTGTCAAGATGTTAACCT-3′ / 5′-TCCTAGGGACAGCAGGCTAAGTC-3′ |
| 26 | 5′-GGAGGCTCTGTCAAGATGTTAACCT-3′ / 5′-TCCTAGGGACAGCAGGCTAAGTC-3′ |
| 27 | 5′-AAATGGGTCTCCCTTCGAAAGA-3′ / 5′-GGGAAACCTAGAGGTCCCGAG-3′ |
| 28 | 5′-GTCTGTCCAGTGAGGAGATCGG-3′ / 5′-CATTCTCATCCGGAGGCTAGGT-3′ |
| 29 | 5′-GTCTGTCCAGTGAGGAGATCGG-3′ / 5′-CATTCTCATCCGGAGGCTAGGT-3′ |
| 30 | 5′-GTCTGTCCAGTGAGGAGATCGG-3′ / 5′-CATTCTCATCCGGAGGCTAGGT-3′ |
| 31 | 5′-GGTCCTGACTTGACCTCGACAG-3′ / 5′-GAGCACTCAGTCTCGGAAGGG-3′ |
| 32 | 5′-GGTCCTGACTTGACCTCGACAG-3′ / 5′-GAGCACTCAGTCTCGGAAGGG-3′ |
| 33 | 5′-GGTCCTGACTTGACCTCGACAG-3′ / 5′-GAGCACTCAGTCTCGGAAGGG-3′ |
| 34 | 5′-GGTCCTGACTTGACCTCGACAG-3′ / 5′-GAGCACTCAGTCTCGGAAGGG-3′ |
| 35 | 5′-AGTATGAGCAGGGGCCTCTAGG-3′ / 5′-CTGGTACCTGCCAGGTCAACTC-3′ |
| 36 | 5′-GGTGGGGAGTAGACACACCTGA-3′ / 5′-TCTTCCTCTCCTCCTTTACCTTGC-3′ |
| 37 | 5′-CATTTCCTAGGTCCTCATCGGTAAA-3′ / 5′-GAGCAGGTCCTGCAGGTCATAA-3′ |
| 38 | 5′-CATTTCCTAGGTCCTCATCGGTAAA-3′ / 5′-GAGCAGGTCCTGCAGGTCATAA-3′ |
| 39 | 5′-CATTTCCTAGGTCCTCATCGGTAAA-3′ / 5′-GAGCAGGTCCTGCAGGTCATAA-3′ |
| 40 | 5′-GAATGTAAGAACATGACCTCCGTGTAG-3′ / 5′-TGTGTCACCAGGACGGAAGAA-3′ |
| 41 | 5′-GAATGTAAGAACATGACCTCCGTGTAG-3′ / 5′-TGTGTCACCAGGACGGAAGAA-3′ |
| 42 | 5′-CAGACTGCTGCTGGTATTGTGC-3′ / 5′-AAGGGAGGAAGATCGAATGCC-3′ |
| CA repeat | 5′-GGTCAGGATAGATCTCTCAGCT-3′ / 5′-ACTAATTTCCTCAGAGGCTGTTCAA-3′ |
Statistical Analysis
In each SNP, the proportion of variation attributable to differences between the Japanese and white populations was estimated by the FST statistic. Haplotype frequencies for multiple loci were estimated by the expectation-maximization (EM) method, by use of the Arlequin program (Schneider et al. 2000), which is available at the ARLEQUIN web site.
Pairwise LD was estimated as D=xij-pipj, where xij is the frequency of haplotype A1B1, and p1 and p2 are the frequencies of alleles A1 and B1 at loci A and B, respectively. A standardized LD coefficient, r, is given by D/(p1p2q1q2)1/2, where q1 and q2 are the frequencies of the other alleles at loci A and B, respectively (Hill and Robertson 1968). Lewontin’s coefficient is given by D′=D/Dmax, where Dmax=min(p1p2,q1q2), when D<0, or Dmax=min(q1p2,p1q2), when D>0 (Lewontin 1964). D′ has been shown to be less sensitive to allele-frequency variation than is r (Devlin and Risch 1995). Another LD measure for association studies, d2, is given by d2=D2/[p1(1-p1)]2, where p1 is the disease-gene frequency. Accordingly, d2=r2p2(1-p2)/p1(1-p1), where p2 is the marker-allele frequency (Kruglyak 1999).
Evidence of past recombinants in AGT was evaluated by an algorithm that slides a “window” across the DNA sequence and compares the maximum-parsimony trees indicated by the two halves of the window (McGuire et al. 1997; McGuire and Wright 2000). A recombination event is inferred if a discrepancy is supported statistically by a parametric bootstrapping test. This algorithm is implemented in the Topal 2.0 package (available at the Topal web site listed in the Electronic Database Information section, below). Because the tree comparisons require polymorphic variation within the window, a window size of 1,500 bp was used. The 12 most common haplotypes were analyzed. The program ClustalW (Jeanmougin et al. 1998) was used to infer the haplotype tree for common haplotypes observed in whites and Japanese.
Results
Molecular Variants in AGT
A 14.4-kb genomic region containing the entire AGT was completely sequenced in 18 whites and 18 Japanese. Several known repetitive elements (SINE, LINE, and LTR) and a CA repeat, the microsatellite used for an early linkage study (Jeunemaitre et al. 1992), were identified (fig. 1). In total, 44 SNPs (1 polymorphism/327 bp) across the scanned sequence were identified in a total of 72 chromosomes from the 18 whites and the 18 Japanese (fig. 1C). Among these SNPs, transition substitutions were more prevalent (35/44 [79.5%]) than were transversion substitutions (9/44 [20.5%]). Forty-one SNPs were found in noncoding regions, and only three were found in coding regions. Other than the CA repeat, no insertion/deletion polymorphisms were detected.
Figure 1.
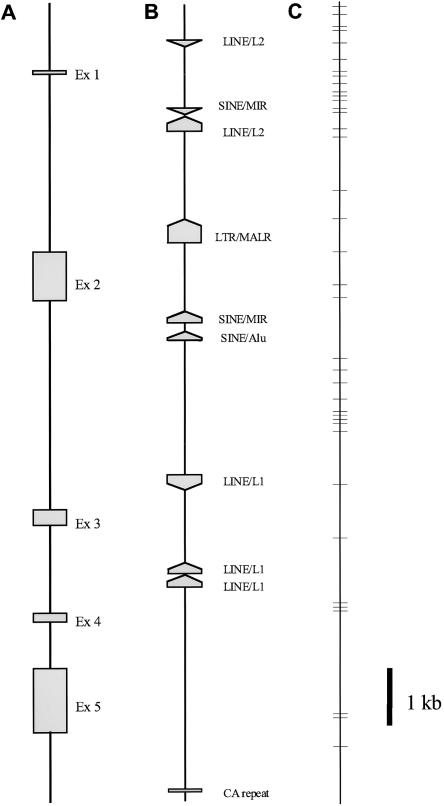
Schematic diagram of AGT, showing locations of five exons (A), repeat elements (B), and 44 SNPs (C). The complete genome sequence containing the entire AGT, 14.4 kb (10.1% coding sequence), was determined. The exact sizes of intron 1, 2, 3, and 4 are 3,233, 3,794, 1,595, and 863 bp, respectively. Repetitive elements (SINE, LINE, and LTR) and simple repeat elements were analyzed by RepeatMasker (see the RepeatMasker Documentation web site). The location of the dinucleotide-repeat sequence is shown.
The 88 white and 77 Japanese subjects included the original 36 individuals who were genotyped for each of the 44 SNPs, by fluorescent sequencing (table 2). Forty SNPs were present in both populations, whereas two SNPs were present only in whites and two other SNPs were present only in Japanese. Fifteen SNPs, including A(-6)G and C4072T (the T235M amino acid polymorphism), showed large frequency differences between whites and Japanese (table 2). The genotype frequencies in our sample fitted Hardy-Weinberg expectations, with remarkable fidelity (data not shown). Chimpanzee sequences, which are useful for estimating the ancestral states of SNPs and haplotypes, were determined at the sites corresponding to human SNPs, by the direct sequencing of products amplifying the BAC DNA containing the chimpanzee AGT sequence (table 2).
Table 2.
Frequency of SNPs in Whites and Japanese
| SNP |
Frequency |
||||
| Designation | Type | Chimpanzee | Japanese (n=154 Chromosomes) | White(n=176 Chromosomes) | FST |
| 1 | A-1178G | A | .21 | .09 | .028 |
| 2 | G-1074T | T | .21 | .09 | .028 |
| … | T-829A | T | .00 | .02 | .010 |
| 3 | G-792A | A | .21 | .09 | .028 |
| 4 | T-775C | T | .07 | .06 | .001 |
| 5 | C-532T | C | .26 | .09 | .050 |
| 6 | G-217A | G | .21 | .09 | .028 |
| 7 | A-20C | C | .24 | .16 | .010 |
| 8 | A-6G | A | .13 | .58 | .221 |
| 9 | C67T | C | .14 | .58 | .210 |
| 10 | C172T | C | .35 | .12 | .074 |
| 11 | G384A | G | .22 | .1 | .027 |
| 12 | G400A | G | .22 | .1 | .027 |
| 13 | G507A | G | .13 | .56 | .205 |
| 14 | A676G | G | .2 | .63 | .190 |
| 15 | A698G | G | .2 | .63 | .190 |
| 16 | A1035G | G | .41 | .72 | .098 |
| 17 | A1164G | G | .38 | .83 | .212 |
| 18 | C2079T | C | .37 | .14 | .070 |
| 19 | G2624A | G | .33 | .1 | .078 |
| 20 | A3189G | A | .35 | .07 | .118 |
| 21 | C3889T(T174M) | C | .16 | .14 | .001 |
| … | T3965C(P199P) | T | .00 | .01 | .005 |
| 22 | C4072T(T235M) | C | .12 | .56 | .216 |
| 23 | A5093C | A | .13 | .55 | .197 |
| 24 | C5343T | C | .02 | .00 | .010 |
| 25 | G5556A | G | .13 | .56 | .205 |
| 26 | G5593A | G | .13 | .56 | .205 |
| 27 | A5878C | A | .03 | .00 | .015 |
| 28 | A6066C | C | .44 | .78 | .121 |
| 29 | G6152A | G | .25 | .09 | .045 |
| 30 | C6233T | C | .44 | .78 | .121 |
| 31 | G6309A | G | .34 | .65 | .096 |
| 32 | C6420T | T | .34 | .2 | .025 |
| 33 | C6428G | C | .34 | .2 | .025 |
| 34 | G6442A | G | .08 | .04 | .007 |
| 35 | G7369A | G | .32 | .12 | .058 |
| 36 | C8357T | C | .4 | .68 | .079 |
| 37 | T9597C | T | .33 | .12 | .063 |
| 38 | G9669T | G | .33 | .12 | .063 |
| 39 | A9770G | A | .34 | .12 | .068 |
| 40 | C11535A | C | .05 | .32 | .121 |
| 41 | C11608T | C | .05 | .33 | .127 |
| 42 | G12058A | Deletion | .32 | .1 | .073 |
| Overall | .087 | ||||
The extent of nucleotide diversity in each population is shown in table 3. The average nucleotide diversity, π, is slightly greater in the Japanese sample (9.78 ± 4.88) than in the white sample (8.36 ± 4.20). The same pattern is observed when θS, the expected proportion of polymorphic sites, is measured. Nucleotide diversity is substantially higher in the 13 kb of noncoding DNA than in 1,458 bp of coding sequence. These figures represent slight underestimates because only 72 human chromosomes (36 from Japanese and 36 from whites) were completely sequenced, with the remainder of the sample genotyped only for the 44 polymorphisms defined in the initial sample. Thus, some rare variants are missed, but this would have only a slight effect on the estimates of π.
Table 3.
Nucleotide Diversity
|
Mean ± SE Nucleotide Diversity(×10−4) |
||||
| Japanese (n=154 Chromosomes) |
Whites (n=174 Chromosomes) |
|||
| Sequence | πa | θSb | πa | θSb |
| Coding (1,458 bp) | 3.37 ± 3.22 | 2.44 ± 1.82 | 5.19 ± 4.25 | 3.59 ± 2.22 |
| Noncoding (12,982 bp) | 10.50 ± 5.25 | 5.51 ± 1.53 | 8.72 ± 4.40 | 5.25 ± 1.44 |
| Overall (14,400 bp) | 9.78 ± 4.88 | 5.19 ± 1.43 | 8.36 ± 4.20 | 5.08 ± 1.38 |
Average proportion of nucleotide differences between all possible pairs of DNA sequences in sample
Expected proportion of polymorphic sites, given by S/Σn-1i=11/i, where S is the number of polymorphic sites in the sequence and n is the number of sequences.
LD between T235M and Other SNPs
LD between T235M and other SNPs was studied because of the reported association between the T235 allele and EHT. Figure 2 illustrates substantial differences between D′ and r2, in addition to differences between the Japanese and white samples. The D′ values are generally much higher than the r2 values, with a large proportion of D′ values equal to 1.0 or −1.0 (maximum disequilibrium). The percentages of D′ values equal to −1.0 or 1.0 are 53% in the white sample (412/780 total SNP pairs) and 50% in the Japanese sample (427/861 SNP pairs). The D′ values equal to 1.0 were caused by the presence of only three of four possible haplotypes for a pair of loci, which forces D′ to its maximum possible value. When LD was evaluated by r2 (fig. 2B), LD with T235M showed several peaks and valleys and no strict correlation with physical distance. In general, LD values were higher in the white sample than in the Japanese sample.
Figure 2.
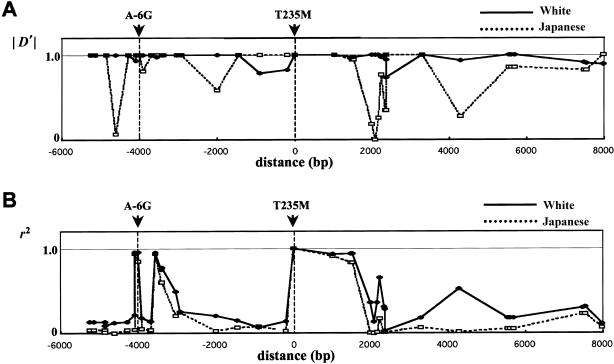
Pairwise LD between T235M and other SNPs in AGT, evaluated by either D′ (A) or r2 (B), in whites and in Japanese. D′ is expressed as an absolute value.
When an arbitrary criterion of r2=0.5 was used, eight SNP alleles—A(-6), C67, G507, A676, A698, A5093, G5556, and G5593—were associated with the T235 allele in both populations (table 4). The G6309 and C8357 alleles were associated with T235 only in whites. On the basis of power considerations, Kruglyak (1999) proposed the criterion that d2 values >0.1 should be considered “useful” levels of LD. Because r2 and d2 are almost perfectly correlated in our sample, we designated r2>0.1 as the criterion for useful LD. Table 4 also shows that 35/39 (89%) of the SNPs <7 kb from T235M had an r2 value >0.1 in the white population; in the Japanese population, only 13/39 (33%) of the SNPs met this criterion. As seen in table 5, highly similar values were seen when disequilibrium between each SNP and the A-6G promoter mutation was evaluated. When a criterion ofD′2>0.1 was used, 100% of the SNPs <7 kb from T235M met this criterion in the white population; in the Japanese population, 89.7% of the SNPs met this criterion. The higher proportion of SNPs showing useful LD in the white population can be attributed to a much higher frequency of the major M235-associated haplotype in this population (see below).
Table 4.
Physical Distance from and LD with T235M, in Whites and Japanese
|
Results When Distance from T235M Is |
|||||||
| Group | 0⩽1 kb(2 SNPs) | 1⩽2 kb(6 SNPs) | 2⩽3 kb(7 SNPs) | 3⩽4 kb(8 SNPs) | 4⩽5 kb(8 SNPs) | 5⩽6 kb(5 SNPs) | 6⩽7 kb(3 SNPs) |
| Whites: | |||||||
| No. (proportion) of SNPs with r2>0.1 | 1 (.50) | 6 (1.00) | 6 (.86) | 8 (1.00) | 7 (.88) | 5 (1.00) | 2 (.67) |
| No. (proportion) of SNPs with r2>0.5 | 0 (.00) | 3 (.50) | 1 (.14) | 3 (.38) | 3 (.38) | 0 (.00) | 0 (.00) |
| Mean of r2 | .102 | .588 | .29 | .45 | .39 | .159 | .24 |
| Japanese: | |||||||
| No. (proportion) of SNPs with r2>0.1 | 0 (.00) | 3 (.50) | 2 (.29) | 4 (.50) | 2 (.25) | 0 (.00) | 2 (.67) |
| No. (proportion) of SNPs with r2>0.5 | 0 (.00) | 3 (.50) | 0 (.00) | 3 (.38) | 2 (.25) | 0 (.00) | 0 (.00) |
| Mean of r2 | .052 | .448 | .065 | .317 | .243 | .046 | .173 |
Table 5.
Physical Distance and LD with A-6G, in Whites and Japanese
|
Results When Distance from A-6G |
|||||||||||
| 0⩽1 kb (12 SNPs) | 1⩽2 kb (4 SNPs) | 2⩽3 kb (2 SNPs) | 3⩽4 kb (12 SNPs) | 4⩽5 kb (1 SNP) | 5⩽6 kb (3 SNPs) | 6⩽7 kb (7 SNPs) | 7⩽8 kb (1 SNP) | 8⩽9 kb (1 SNP) | 9⩽10 kb (3 SNPs) | >10 kb (3 SNPs) | |
| Whites: | |||||||||||
| No. (proportion) of SNPs with r2>0.1 | 11 (.92) | 4 (1.00) | 2 (1.00) | 1 (.50) | 1 (1.00) | 3 (1.00) | 6 (.86) | 1 (1.00) | 1 (1.00) | 3 (1.00) | 3 (1.00) |
| No. (proportion) of SNPs with r2>0.1 | 4 (.33) | 0 (.00) | 1 (.50) | 0 (.00) | 1 (1.00) | 3 (1.00) | 1 (.14) | 0 (.00) | 0 (.00) | 0 (.00) | 0 (.00) |
| Mean of r2 | .386 | .386 | .43 | .106 | .96 | .902 | .308 | .186 | .477 | .186 | .231 |
| Japanese: | |||||||||||
| No. (proportion) of SNPs with r2>0.1 | 4 (.33) | 2 (.50) | 0 (.00) | 0 (.00) | 1 (1.00) | 3 (1.00) | 1 (.14) | 0 (.00) | 0 (.00) | 0 (.00) | 2 (.67) |
| No. (proportion) of SNPs with r2>0.1 | 4 (.33) | 0 (.00) | 0 (.00) | 0 (.00) | 1 (1.00) | 3 (1.00) | 0 (.00) | 0 (.00) | 0 (.00) | 0 (.00) | 0 (.00) |
| Mean of r2 | .291 | .134 | .062 | .056 | .94 | .922 | .045 | .07 | .023 | .055 | .165 |
Pairwise LD in AGT
When all the possible pairwise LD values in Japanese, evaluated by either D′ or r2, were plotted as a function of physical distance, LD did not decline smoothly with increasing distance between SNPs (figs. 3A and B). However, the average values of D′ (fig. 3C) and r2 (fig. 3D) in each 500-bp interval declined markedly with physical distance. For both measures, the white sample showed a higher level of LD than did the Japanese sample.
Figure 3.
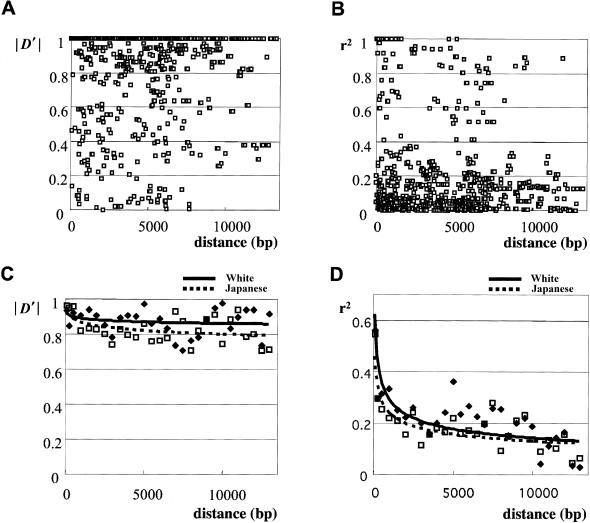
Pairwise LD versus physical distance between all pairwise SNPs, based on the 861 marker pairs in Japanese, evaluated by either D′ (A) or r2 (B). Average values of D′ and r2 (B) at every 500 bp, in whites and in Japanese, show that LD declines with increasing physical distance between SNP pairs.
The d2 statistic for each pair of SNPs was measured under the assumption that the SNP containing the least-common minor allele was the disease-causing variant. As expected from the mathematical similarity between d2 and r2, the pairwise values of these two measures were highly correlated (Pearson’s r=0.96). The correlation between d2 and D′ was much lower (Pearson’s r=0.33), reflecting the large number of D′ values equal to 1.0 or −1.0.
For assessment of patterns of significant disequilibrium values in the two populations, figure 4 shows pairwise r2 values >0.5 (blackened boxes) and within the range 0.25–0.5 (gray-shaded boxes). The value r2=0.5 is equivalent to χ2=88 (P<10-19) in 176 white chromosomes and χ2=77 (P<10-17) in 154 Japanese chromosomes. The distribution of LD is highly similar in the two populations, and at least five major SNP subgroups with minor changes, defined by having r2=0.5, were present (fig. 4, bottom).
Figure 4.
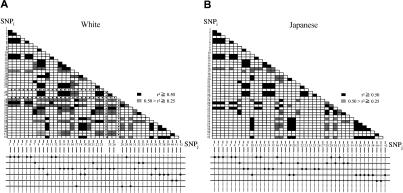
Pairwise LD in AGT, evaluated by r2. LD between all pairs of SNPs (SNPi and SNPj, where i and j refer to the SNP number shown in table 2) was evaluated by the LD measure r2. Pairwise LD was determined among the 861 marker pairs studied in whites (A) and Japanese (B), and pairs in LD (r2=0.5) are shown as blackened boxes. Several subgroups of SNPs in tight LD with each other are shown below. A dot in the center of a square indicates that no data are available, because SNP24 and SNP27 were not observed in whites.
Haplotype Analysis
Haplotypes were constructed on the basis of the genotype data from 21 SNPs selected to span most of AGT. Haplotype frequencies were estimated by the EM algorithm, with phase-unknown samples. This procedure has been shown to estimate common haplotype frequencies accurately when the Hardy-Weinberg assumption is fulfilled and when sample sizes are reasonably large (e.g., >100 chromosomes) (Fallin and Schork 2000; Tishkoff et al. 2000a). The haplotypes carrying A(-6) and T235 could be subdivided into five major haplotypes—HA1, HA2, HA3, HA4, and HA5. Only one major haplotype carrying G(-6) and M235, the HG1 haplotype, was present in both populations. Figure 5 shows the haplotypes that were estimated to be present, in two or more copies, in at least one of the populations. Whites and Japanese shared the five frequent haplotypes, even though the frequencies of those haplotypes were quite different between the two populations. In whites, the HG1 haplotype, which is thought to be protective against EHT, had a frequency of 54%. The frequency of this haplotype in the Japanese population was substantially lower, 11%. Haplotype diversity, 2n(1-Σx2i)/(2n-1), where xi is the frequency of haplotype i and n is sample number, was estimated as 0.684 for the whites and 0.872 for the Japanese.
Figure 5.
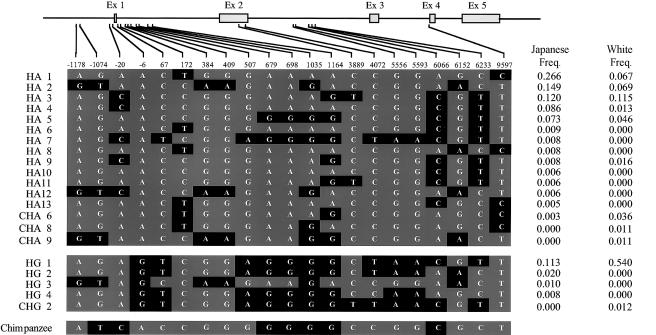
AGT haplotypes in whites and Japanese. These haplotypes were constructed and the frequencies were estimated by the EM algorithm based on 21 SNPs in AGT. The number of chromosomes analyzed was 176 for whites and 154 for Japanese. Blackened boxes denote the minor allele in Japanese. The chimpanzee sequence is also shown.
Recombination Analysis
Evidence of past recombinants in the AGT sequence is given by the DSS (i.e., difference in sum of squares) values, which, in figure 6, are plotted (on the Y-axis) against position in the AGT sequence (on the X-axis). Higher DSS values indicate greater discrepancies between the two trees generated by each half of the sliding window of DNA sequence and thus reflect the likely locations of recombinants. Figure 6 provides evidence for recombinant events at approximately positions 550, 3800, 5600, and 6000 (possible recombinants upstream and downstream of these locations could not be discerned, because of the locations of polymorphisms and because of limitations on the window size). The bootstrap analysis showed that the DSS values at each of these positions differed significantly from 0. These inferred recombinants correspond to blocks of SNPs that are in association with one another, as seen in figures 4 and 5. One block begins with SNP13 (G507A) and ends with SNP17 (A1164G). A second block begins with SNP22 (the T235M polymorphism, C4072T) and ends with SNP28 (A6066C).
Figure 6.
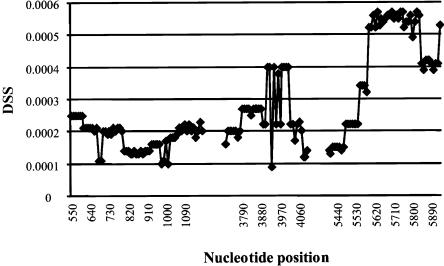
Plot of DSS (Y-axis)—that is, the difference, in the sum of squares, between trees generated from two halves of a 1,500-bp sliding window of DNA sequence—versus the position of the center of each sliding window (X-axis). Gaps in the sequence represent those portions of the sequence in which no polymorphic variation was present.
Gene Tree for Common Haplotypes Observed in Japanese and Whites
A haplotype tree for the major haplotypes was constructed by use of the ClustalW program (fig. 7). Chimpanzee sequences were used to determine the ancestral haplotype. The HG1 and HA1 haplotypes, the most frequent haplotypes in whites and Japanese, respectively, are remotely related to the chimpanzee sequence.
Figure 7.
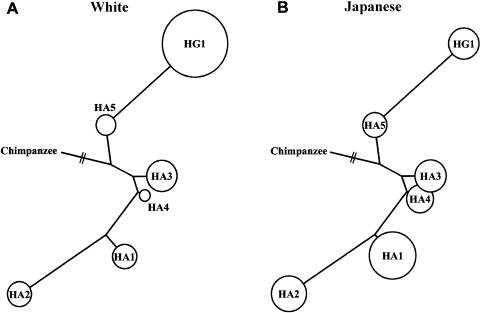
Haplotype trees for AGT haplotype, based on 21 SNPs and the chimpanzee sequence. The sizes of the circles represent the frequencies of the haplotypes in whites (A) and Japanese (B).
Relationship between SNP Haplotypes and Microsatellite Marker
The CA repeat, which is located downstream of exon 5, has been identified elsewhere (Jeunemaitre et al. 1992) and was used for linkage studies. The relationship between the four most common SNP haplotypes and the microsatellite alleles is shown in figure 8. Although the distribution of CA-repeat alleles varies between whites and Japanese, the association patterns between each SNP haplotype and the microsatellite alleles are very similar in the two populations. The same microsatellite allele is in association with each SNP haplotype in both populations (e.g., microsatellite allele 197 and the HG1 haplotype).
Figure 8.
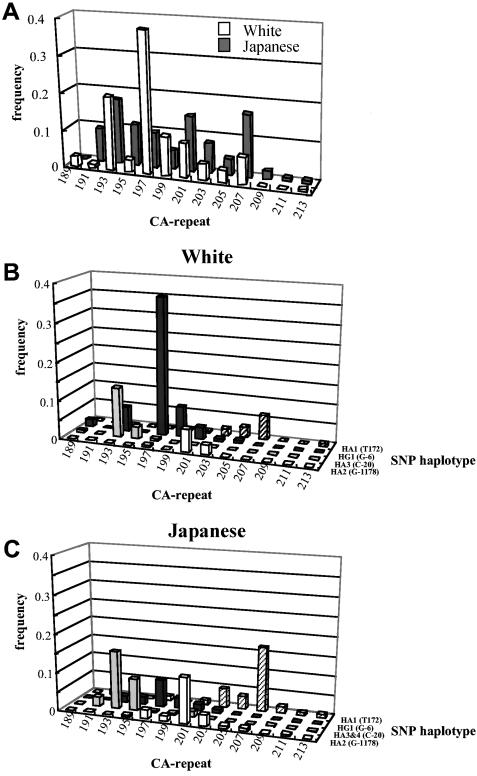
Relationships between four major SNP haplotypes and the microsatellite marker. The distribution of the frequency of individual microsatellite alleles is shown for each of the common SNP haplotypes in AGT. Al though the distribution of the CA-repeat alleles (A) in whites is very different from that in Japanese, each SNP haplotype is associated with a specific CA-repeat allele in whites (B) and Japanese (C).
Discussion
The notable successes of LD in localizing the genes responsible for Mendelian disorders (Hästbacka et al. 1994; Feder et al. 1996), combined with the availability of hundreds of thousands of SNPs throughout the genome (Sachidanandam et al. 2001), has sparked a strong interest in the use of LD methods for localizing the genes underlying complex diseases (Risch and Merikangas 1996; Collins et al. 1997; Kruglyak 1999; Jorde 2000; Risch 2000; Jorde et al. 2001; Pritchard and Przeworski 2001; Reich et al. 2001; Schork et al. 2001; Stephens et al. 2001). Many important questions regarding this approach remain unanswered, however. To what extent are LD patterns affected by factors such as chromosome location, isochore structure, and choice of markers? How do evolutionary factors, including natural selection, gene flow, genetic drift, population subdivision, and gene conversion, affect LD? Which types of populations are best suited to LD mapping? Answers to these questions are necessary for the efficient design of LD studies.
Variation in AGT has been shown to correlate with variation in plasma angiotensinogen and with risk of hypertension. Therefore, this gene provides the basis for a useful case study of LD patterns in a locus that helps to determine susceptibility to a complex disease. Our results demonstrate that significant LD is found between putative susceptibility alleles in the AGT region and other SNPs. However, the pattern of LD in this region is highly irregular, with some pairs of closely linked SNPs showing little LD. This irregularity has been observed in many previous studies of small genomic regions (MacDonald et al. 1991; Jorde 1995; Jorde et al. 1993, 1994; Nickerson et al. 1998; Taillon-Miller et al. 2000; Abecasis et al. 2001) and is to be expected, because recombination becomes rare relative to other events that can affect LD, such as mutation and gene conversion. Our results show evidence of only a few historical recombinants in this region. This paucity of recombinants helps to explain why D′ values are 1.0 for many pairs of polymorphisms: recombination is more likely to generate two new haplotypes from two polymorphic sites, giving rise to a total of four haplotypes. On the other hand, if a new haplotype is generated by mutation, a total of three haplotypes is likely to be seen, and D′ for two sites will equal 1.0. The result is that D′ is a relatively insensitive measure of LD variation in this small genomic region.
We observed a slightly more regular pattern of LD decline with physical distance when LD values were averaged across 500-bp intervals (fig. 3). This procedure is expected to smooth out some of the variation in LD estimates, and similar results have been obtained in other studies in which LD values are averaged across genomic intervals (Dunning et al. 2000; Abecasis et al. 2001).
Although the average LD values in the present study decline with physical distance, some pairs of SNPs exhibit significant LD at distances of nearly 10 kb. This is consistent with the results of many other empirical studies, some of which detect significant LD at distances up to several hundred kilobases (Jorde et al. 1993, 1994; Peterson et al. 1995; Ajioka et al. 1997; Huttley et al. 1999; Lonjou et al. 1999; Moffatt et al. 2000; Reich et al. 2001; Stephens et al. 2001). These empirical results stand in contrast to a simulation study that predicted little or no useful LD beyond distances of 10 kb (Kruglyak 1999). This study assumed either constant population size or simple exponential growth, both of which are likely to be oversimplifications (Wall and Przeworski 2000). Cyclic bottlenecks and expansions, for example, can lead to higher LD levels (Collins et al. 1999). In addition, the simulation study ignored the potential effects that natural selection has on disease-causing variants. Natural selection limits the length of time during which these variants can persist in populations, reducing the length of time during which LD can dissipate (Terwilliger and Weiss 1998). These and other factors are likely to account for discrepancies between these simulation results and the empirical studies reported thus far.
Comparisons of LD patterns in the Japanese and white populations showed that, although the overall patterns were quite similar, the LD between T235M and other polymorphisms was substantially greater in the white sample. A total of 89% of the SNPs <7 kb from the EHT-associated T235M polymorphism demonstrated “useful” LD (r2>0.1) in the white sample, but this figure was only 33% in the Japanese sample. Thus, the probability of detecting the EHT-associated polymorphism in a genome LD scan would be substantially greater in the white population. The higher level of T235M association is due to an elevated HG1 haplotype frequency (54%) in the Utah CEPH sample. This, in turn, may reflect the substantial genetic homogeneity that has been demonstrated in genetic studies of this population (McLellan et al. 1984; O'Brien et al. 1994, 1996). The elevated HG1 frequency could also be the result of natural selection affecting the A-6G and/or T235M polymorphisms. Other studies have also demonstrated substantial differences in LD in various populations (Tishkoff et al. 1996, 1998, 2000b; Kidd et al. 1998; Reich et al. 2001), highlighting the effects that population history has on LD patterns.
It is instructive to compare haplotype complexity in AGT with that of the lipoprotein lipase gene, LPL. The AGT region, with an average nucleotide diversity of p≈1/1,000, is typical of most regions reported thus far (Wall and Przeworski 2000; Jorde et al. 2001; Sachidanandam et al. 2001). LPL has a somewhat higher level of nucleotide diversity, p=1/500, and exhibits a high degree of haplotype complexity in several different populations, with evidence of multiple recombination events (Clark et al. 1998; Nickerson et al. 1998; Templeton et al. 2000). Indeed, haplotype reconstruction showed that, for most (64%) pairs of SNPs in the LPL region, all four haplotypes were present. In contrast, most (50% in the Japanese sample and 53% in the white sample) pairs of SNPs in the AGT region yielded evidence of only three haplotypes, indicating less recombination. Just five major haplotypes (fig. 5) account for 84% of the 176 white chromosomes and for 73% of the 154 Japanese chromosomes. Thus, relatively few SNPs can account for much of the variation in the AGT region, implying that this gene would require a lower SNP density for association detection than would a more complex gene, such as LPL.
Taken together, these results demonstrate that it is not feasible to predict a uniform SNP density for genomewide association studies. The SNP density needed for detection of disease-associated polymorphisms will vary with genomic region, marker type, and choice of population. In addition, the distribution of LD is almost guaranteed to be irregular in relatively small genomic regions, particularly in more-recently-founded populations, which have a relatively brief history of recombination. Additional empirical information about the effects that all these factors have on LD patterns is needed, in order to design efficient association studies.
The haplotype patterns seen in the Japanese and white populations allow some inferences about the history of the EHT-associated AGT polymorphisms. As seen in figure 4, LD and haplotype patterns are quite similar in the two populations, and both share the same major haplotypes (albeit with different frequencies). In addition, the same CA-repeat alleles are found in association with each major haplotype in the two populations. In particular, the M235 allele occurs on the same haplotype background, and this haplotype is quite common in two populations of distinct geographic origin (Japan vs. the northern-European origin of the Utah population). These results, taken together with the fact that the T235M polymorphism is seen in at least some African populations (Corvol and Jeunemaitre 1997), indicate that the polymorphism probably arose before modern humans left Africa and that it was shared by a portion of the population that eventually populated Europe and Asia. Predating the African exodus, the polymorphism is likely to be ⩾50,000 years old (Jorde et al. 1998; Hedges 2000; Underhill et al. 2000).
Our results also bear on the question of natural selection for variation in AGT. Notably, the highest FST values shown in table 2 are those associated with the A-6G promoter polymorphism and the T235M polymorphism, both of which are associated with hypertension. Exceptionally high FST values are a potential indication of the effects of directional selection (Lewontin and Krakauer 1973; Bowcock et al. 1991; Beaumont and Nichols 1999). An analysis of several nonhuman primate species (chimpanzee, gorilla, orangutan, gibbon, baboon, and macaque) shows that the T235 allele is fixed in these species (Inoue et al. 1997; Dufour et al. 2000). In addition, the A(-6) promoter variant is fixed in the three species examined thus far (chimp, gorilla, and macaque). Thus, the protective M235 and G(-6) variants are likely to have arisen during the course of human evolution. The T235 allele varies widely in frequency, occurring in 35%–45% of whites, 75%–80% of Asians, 75%–80% of African Americans, and ⩾90% of Africans (Corvol and Jeunemaitre 1997; Staessen et al. 1999). This pattern leads to the hypothesis that the A(-6)/T235 haplotype, associated with higher angiotensinogen expression and greater sodium reabsorption, was adaptive in the tropical, sodium-poor environment of sub-Saharan Africa (Jeunemaitre et al. 1997) but was selected against (or became selectively neutral) as modern humans radiated out of Africa into other environments. Natural-selection signatures (Kreitman 2000) in AGT should be evaluated in multiple populations, to test this intriguing hypothesis.
Acknowledgments
This work was supported in part by a Research for the Future Program Grant, from The Japan Society for the Promotion of Science (to I.I. and M.E.); by Ministry of Public Health and Welfare Research on Human Genome, Tissue Engineering Food Biotechnology (support to I.I.); by National Institutes of Health grants GM-59290 (to L.B.J.) and HL-54471 (to J.-M.L.); and by National Science Foundation grant SBR-9818215 (to L.B.J.). We are grateful to Michael Bamshad and Scott Watkins for comments on the manuscript.
Electronic-Database Information
Accession numbers and URLs for data in this article are as follows:
- ARLEQUIN, http://anthropologie.unige.ch/arlequin (for the Arlequin program)
- GenBank Overview, http://www.ncbi.nlm.nih.gov/Genbank/GenbankOverview.html (for the sequence of AGT [accession numbers NM_000029 and X15323])
- Online Mendelian Inheritance in Man (OMIM), http://www.ncbi.nlm.nih.gov/Omim/ (for EHT [MIM 145500] and AGT [MIM 106150])
- RepeatMasker Documentation, http://ftp.genome.washington.edu/RM/RepeatMasker.html
- Topal web site, http://www.rdg.ac.uk/Statistics/genetics/software.html (for the Topal 2.0 package)
References
- Abecasis GR, Noguchi E, Heinzmann A, Traherne JA, Bhattacharyya S, Leaves NI, Anderson GG, Zhang Y, Lench NJ, Carey A, Cardon LR, Moffatt MF, Cookson WO (2001) Extent and distribution of linkage disequilibrium in three genomic regions. Am J Hum Genet 68:191–197 [DOI] [PMC free article] [PubMed] [Google Scholar]
- Ajioka RS, Jorde LB, Gruen JR, Yu P, Dimitrova D, Barrow J, Radisky E, Edwards CQ, Griffen LM, Kushner JP (1997) Haplotype analysis of hemochromatosis: evaluation of different linkage-disequilibrium measures and evolution of disease chromosomes. Am J Hum Genet 60:1439–1447 [DOI] [PMC free article] [PubMed] [Google Scholar]
- Beaumont MA, Nichols RA (1999) Evaluating loci for use in the genetic analysis of population structure. Proc R Soc Lond B Biol Sci 263:1619–1626 [Google Scholar]
- Bengtsson K, Orho-Melander M, Lindblad U, Melander O, Bog-Hansen E, Ranstam J, Rastam L, Groop L (1999) Polymorphism in the angiotensin converting enzyme but not in the angiotensinogen gene is associated with hypertension and type 2 diabetes: the Skaraborg Hypertension and Diabetes Project. J Hypertens 17:1569–1575 [DOI] [PubMed] [Google Scholar]
- Bonnen PE, Story MD, Ashorn CL, Buchholz TA, Weil MM, Nelson DL (2000) Haplotypes at ATM identify coding-sequence variation and indicate a region of extensive linkage disequilibrium. Am J Hum Genet 67:1437–1451 [DOI] [PMC free article] [PubMed] [Google Scholar]
- Bowcock AM, Kidd JR, Mountain JL, Hebert JM, Carotenuto L, Kidd KK, Cavalli-Sforza LL (1991) Drift, admixture, and selection in human evolution: a study with DNA polymorphisms. Proc Natl Acad Sci USA 88:839–843 [DOI] [PMC free article] [PubMed] [Google Scholar]
- Brand E, Chatelain N, Keavney B, Caulfield M, Citterio L, Connell J, Grobbee D, Schmidt S, Schunkert H, Schuster H, Sharma AM, Soubrier F (1998) Evaluation of the angiotensinogen locus in human essential hypertension: a European study. Hypertension 31:725–729 [DOI] [PubMed] [Google Scholar]
- Clark AG, Weiss KM, Nickerson DA, Taylor SL, Buchanan A, Stengard J, Salomaa V, Vartiainen E, Perola M, Boerwinkle E, Sing CF (1998) Haplotype structure and population genetic inferences from nucleotide-sequence variation in human lipoprotein lipase. Am J Hum Genet 63:595–612 [DOI] [PMC free article] [PubMed] [Google Scholar]
- Collins A, Lonjou C, Morton NE (1999) Genetic epidemiology of single-nucleotide polymorphisms. Proc Natl Acad Sci USA 96:15173–15177 [DOI] [PMC free article] [PubMed] [Google Scholar]
- Collins FS, Guyer MS, Chakravarti A (1997) Variations on a theme: cataloging human DNA sequence variation. Science 278:1580–1581 [DOI] [PubMed] [Google Scholar]
- Corvol P, Jeunemaitre X (1997) Molecular genetics of human hypertension: role of angiotensinogen. Endocr Rev 18:662–677 [DOI] [PubMed] [Google Scholar]
- Corvol P, Persu A, Gimenez-Roqueplo AP, Jeunemaitre X (1999) Seven lessons from two candidate genes in human essential hypertension: angiotensinogen and epithelial sodium channel. Hypertension 33:1324–1331 [DOI] [PubMed] [Google Scholar]
- Devlin B, Risch N (1995) A comparison of linkage disequilibrium measures for fine-scale mapping. Genomics 29:311–322 [DOI] [PubMed] [Google Scholar]
- Dufour C, Casane D, Denton D, Wickings J, Corvol P, Jeunemaitre X (2000) Human-chimpanzee DNA sequence variation in the four major genes of the renin angiotensin system. Genomics 69:14–26 [DOI] [PubMed] [Google Scholar]
- Dunning AM, Durocher F, Healey CS, Teare MD, McBride SE, Carlomagno F, Xu CF, Dawson E, Rhodes S, Ueda S, Lai E, Luben RN, Van Rensburg EJ, Mannermaa A, Kataja V, Rennart G, Dunham I, Purvis I, Easton D, Ponder BA (2000) The extent of linkage disequilibrium in four populations with distinct demographic histories. Am J Hum Genet 67:1544–1554 [DOI] [PMC free article] [PubMed] [Google Scholar]
- Eaves IA, Merriman TR, Barber RA, Nutland S, Tuomilehto-Wolf E, Tuomilehto J, Cucca F, Todd JA (2000) The genetically isolated populations of Finland and Sardinia may not be a panacea for linkage disequilibrium mapping of common disease genes. Nat Genet 25:320–323 [DOI] [PubMed] [Google Scholar]
- Fallin D, Schork NJ (2000) Accuracy of haplotype frequency estimation for biallelic loci, via the expectation-maximization algorithm for unphased diploid genotype data. Am J Hum Genet 67:947–959 [DOI] [PMC free article] [PubMed] [Google Scholar]
- Feder JN, Gnirke A, Thomas W, Tsuchihashi Z, Ruddy DA, Basava A, Dormishian F, et al (1996) A novel MHC class I-like gene is mutated in patients with hereditary haemochromatosis. Nat Genet 13:399–408 [DOI] [PubMed] [Google Scholar]
- Hästbacka J, de la Chapelle A, Mahtani MM, Clines G, Reeve-Daly MP, Daly M, Hamilton BA, Kusumi K, Trivedi B, Weaver A (1994) The diastrophic dysplasia gene encodes a novel sulfate transporter: positional cloning by fine-structure linkage disequilibrium mapping. Cell 78:1073–1087 [DOI] [PubMed] [Google Scholar]
- Hedges SB (2000) Human evolution: a start for population genomics. Nature 408:652–653 [DOI] [PubMed] [Google Scholar]
- Hill WG, Robertson A (1968) Linkage disequilibrium in finite populations. Theor Appl Genet 38:226–231 [DOI] [PubMed] [Google Scholar]
- Huttley GA, Smith MW, Carrington M, O'Brien SJ (1999) A scan for linkage disequilibrium across the human genome. Genetics 152:1711–1722 [DOI] [PMC free article] [PubMed] [Google Scholar]
- Inoue I, Nakajima T, Williams CS, Quackenbush J, Puryear R, Powers M, Cheng T, Ludwig EH, Sharma AM, Hata A, Jeunemaitre X, Lalouel JM (1997) A nucleotide substitution in the promoter of human angiotensinogen is associated with essential hypertension and affects basal transcription in vitro. J Clin Invest 99:1786–1797 [DOI] [PMC free article] [PubMed] [Google Scholar]
- Iso H, Harada S, Shimamoto T, Sato S, Kitamura A, Sankai T, Tanigawa T, Iida M, Komachi Y (2000) angiotensinogen T174M and M235T variants, sodium intake and hypertension among non-drinking, lean Japanese men and women. J Hypertens 18:1197–1206 [DOI] [PubMed] [Google Scholar]
- Jeanmougin F, Thompson JD, Gouy M, Higgins DG, Gibson TJ (1998) Multiple sequence alignment with Clustal X. Trends Biochem Sci 23:403–405 [DOI] [PubMed] [Google Scholar]
- Jeunemaitre X, Inoue I, Williams C, Charru A, Tichet J, Powers M, Sharma AM, Gimenez-Roqueplo AP, Hata A, Corvol P, Lalouel JM (1997) Haplotypes of angiotensinogen in essential hypertension. Am J Hum Genet 60:1448–1460 [DOI] [PMC free article] [PubMed] [Google Scholar]
- Jeunemaitre X, Soubrier F, Kotelevtsev YV, Lifton RP, Williams CS, Charru A, Hunt SC, Hopkins PN, Williams RR, Lalouel JM, Corvol P (1992) Molecular basis of human hypertension: role of angiotensinogen. Cell 71:169–180 [DOI] [PubMed] [Google Scholar]
- Jorde LB (1995) Linkage disequilibrium as a gene mapping tool. Am J Hum Genet 56:11–14 [PMC free article] [PubMed] [Google Scholar]
- ——— (2000) Linkage disequilibrium and the search for complex disease genes. Genome Res 10:1435–1444 [DOI] [PubMed] [Google Scholar]
- Jorde LB, Bamshad M, Rogers AR (1998) Using mitochondrial and nuclear DNA markers to reconstruct human evolution. BioEssays 20:126–136 [DOI] [PubMed] [Google Scholar]
- Jorde LB, Watkins WS, Bamshad MJ (2001) Population genomics: a bridge from evolutionary history to genetic medicine. Hum Mol Genet 10:2199–2207 [DOI] [PubMed] [Google Scholar]
- Jorde LB, Watkins WS, Carlson M, Groden J, Albertsen H, Thliveris A, Leppert M (1994) Linkage disequilibrium predicts physical distance in the adenomatous polyposis coli region. Am J Hum Genet 54:884–898 [PMC free article] [PubMed] [Google Scholar]
- Jorde LB, Watkins WS, Viskochil D, O'Connell P, Ward K (1993) Linkage disequilibrium in the neurofibromatosis 1 region: implications for gene mapping. Am J Hum Genet 53:1038–1050 [PMC free article] [PubMed] [Google Scholar]
- Kato N, Sugiyama T, Morita H, Kurihara H, Furukawa T, Isshiki T, Sato T, Yamori Y, Yazaki Y (2000) Comprehensive analysis of the renin-angiotensin gene polymorphisms with relation to hypertension in the Japanese. J Hypertens 18:1025–1032 [DOI] [PubMed] [Google Scholar]
- Kato N, Sugiyama T, Morita H, Kurihara H, Yamori Y, Yazaki Y (1999) angiotensinogen gene and essential hypertension in the Japanese: extensive association study and meta-analysis on six reported studies. J Hypertens 17:757–763 [DOI] [PubMed] [Google Scholar]
- Kidd JR, Pakstis AJ, Zhao H, Lu RB, Okonofua FE, Odunsi A, Grigorenko E, Tamir BB, Friedlaender J, Schulz LO, Parnas J, Kidd KK (2000) Haplotypes and linkage disequilibrium at the phenylalanine hydroxylase locus, PAH, in a global representation of populations. Am J Hum Genet 66:1882–1899 [DOI] [PMC free article] [PubMed] [Google Scholar]
- Kidd KK, Morar B, Castiglione CM, Zhao H, Pakstis AJ, Speed WC, Bonne-Tamir B, Lu RB, Goldman D, Lee C, Nam YS, Grandy DK, Jenkins T, Kidd JR (1998) A global survey of haplotype frequencies and linkage disequilibrium at the DRD2 locus. Hum Genet 103:211–227 [DOI] [PubMed] [Google Scholar]
- Kreitman M (2000) Methods to detect selection in populations with applications to the human. Annu Rev Genomics Hum Genet 1:539–559 [DOI] [PubMed] [Google Scholar]
- Kruglyak L (1999) Prospects for whole-genome linkage disequilibrium mapping of common disease genes. Nat Genet 22:139–144 [DOI] [PubMed] [Google Scholar]
- Kunz R, Kreutz R, Beige J, Distler A, Sharma AM (1997) Association between the angiotensinogen 235T-variant and essential hypertension in whites: a systematic review and methodological appraisal. Hypertension 30:1331–1337 [DOI] [PubMed] [Google Scholar]
- Laan M, Pääbo S (1997) Demographic history and linkage disequilibrium in human populations. Nat Genet 17:435–438 [DOI] [PubMed] [Google Scholar]
- Lalouel JM (2001) From genetics to mechanism of disease liability. Adv Genet 42:517–533 [DOI] [PubMed] [Google Scholar]
- Larson N, Hutchinson R, Boerwinkle E (2000) Lack of association of 3 functional gene variants with hypertension in African Americans. Hypertension 35:1297–1300 [DOI] [PubMed] [Google Scholar]
- Lewontin RC (1964) The interaction of selection and linkage. I. General considerations; heterotic models. Genetics 49:49–67 [DOI] [PMC free article] [PubMed] [Google Scholar]
- Lewontin RC, Krakauer J (1973) Distribution of gene frequency as a test of the theory of the selective neutrality of polymorphisms. Genetics 74:175–195 [DOI] [PMC free article] [PubMed] [Google Scholar]
- Lonjou C, Collins A, Morton NE (1999) Allelic association between marker loci. Proc Natl Acad Sci USA 96:1621–1626 [DOI] [PMC free article] [PubMed] [Google Scholar]
- MacDonald ME, Lin C, Srinidhi L, Bates G, Altherr M, Whaley WL, Lehrach H, Wasmuth J, Gusella JF (1991) Complex patterns of linkage disequilibrium in the Huntington disease region. Am J Hum Genet 49:723–734 [PMC free article] [PubMed] [Google Scholar]
- McGuire G, Wright F (2000) TOPAL 2.0 : improved detection of mosaic sequences within multiple alignments. Bioinformatics 16:130–134 [DOI] [PubMed] [Google Scholar]
- McGuire G, Wright F, Prentice MJ (1997) A graphical method for detecting recombination in phylogenetic data sets. Mol Biol Evol 14:1125–1131 [DOI] [PubMed] [Google Scholar]
- McLellan T, Jorde LB, Skolnick MH (1984) Genetic distances between the Utah Mormons and related populations. Am J Hum Genet 36:836–857 [PMC free article] [PubMed] [Google Scholar]
- Moffatt MF, Traherne JA, Abecasis GR, Cookson WO (2000) Single nucleotide polymorphism and linkage disequilibrium within the TCR alpha/delta locus. Hum Mol Genet 9:1011–1019 [DOI] [PubMed] [Google Scholar]
- Nakajima T, Iwaki K, Kodama T, Inazawa J, Emi M (2000) Genomic structure and chromosomal mapping of the human site-1 protease (S1P) gene. J Hum Genet 45:212–217 [DOI] [PubMed] [Google Scholar]
- Nickerson DA, Taylor SL, Weiss KM, Clark AG, Hutchinson RG, Stengard J, Salomaa V, Vartiainen E, Boerwinkle E, Sing CF (1998) DNA sequence diversity in a 9.7-kb region of the human lipoprotein lipase gene. Nat Genet 19:233–240 [DOI] [PubMed] [Google Scholar]
- Niu T, Chen C, Yang J, Wang B, Wang Z, Schork N, Fang Z, Xu X (1999) Blood pressure and the T174M and M235T polymorphisms of the angiotensinogen gene. Ann Epidemiol 9:245–253 [DOI] [PubMed] [Google Scholar]
- O'Brien E, Rogers AR, Beesley J, Jorde LB (1994) Genetic structure of the Utah Mormons: a comparison of results based on DNA, blood groups, migration matrices, isonymy, and pedigrees. Hum Biol 66:743–759 [PubMed] [Google Scholar]
- O'Brien E, Zenger R, Jorde LB (1996) Genetic structure of the Utah Mormons: a comparison of kinship estimates from DNA, blood groups, genealogies, and ancestral arrays. Am J Hum Biol 8:609–614 [DOI] [PubMed] [Google Scholar]
- Pan WH, Chen JW, Fann C, Jou YS, Wu SY (2000) Linkage analysis with candidate genes: the Taiwan young-onset hypertension genetic study. Hum Genet 107:210–215 [DOI] [PubMed] [Google Scholar]
- Peterson AC, Di Rienzo A, Lehesjoki A-E, de la Chapelle A, Slatkin M, Freimer NB (1995) The distribution of linkage disequilibrium over anonymous genome regions. Hum Mol Genet 4:887–894 [DOI] [PubMed] [Google Scholar]
- Pritchard JK, Przeworski M (2001) Linkage disequilibrium in humans: models and data. Am J Hum Genet 69:1–14 [DOI] [PMC free article] [PubMed] [Google Scholar]
- Province MA, Boerwinkle E, Chakravarti A, Cooper R, Fornage M, Leppert M, Risch N, Ranade K (2000) Lack of association of the angiotensinogen-6 polymorphism with blood pressure levels in the comprehensive NHLBI Family Blood Pressure Program: National Heart, Lung and Blood Institute. J Hypertens 18:867–876 [DOI] [PubMed] [Google Scholar]
- Rankinen T, Gagnon J, Perusse L, Chagnon YC, Rice T, Leon AS, Skinner JS, Wilmore JH, Rao DC, Bouchard C (2000) AGT M235T and ACE ID polymorphisms and exercise blood pressure in the HERITAGE Family Study. Am J Physiol Heart Circ Physiol 279:H368–H374 [DOI] [PubMed] [Google Scholar]
- Reich DE, Cargill M, Bolk S, Ireland J, Sabeti PC, Richter DJ, Lavery T, Kouyoumjian R, Farhadian SF, Ward R, Lander ES (2001) Linkage disequilibrium in the human genome. Nature 411:199–204 [DOI] [PubMed] [Google Scholar]
- Rice T, Rankinen T, Province MA, Chagnon YC, Perusse L, Borecki IB, Bouchard C, Rao DC (2000) Genome-wide linkage analysis of systolic and diastolic blood pressure: the Quebec Family Study. Circulation 102:1956–1963 [DOI] [PubMed] [Google Scholar]
- Risch NJ (2000) Searching for genetic determinants in the new millennium. Nature 405:847–856 [DOI] [PubMed] [Google Scholar]
- Risch N, Merikangas K (1996) The future of genetic studies of complex human diseases. Science 273:1516–1517 [DOI] [PubMed] [Google Scholar]
- Sachidanandam R, Weissman D, Schmidt SC, Kakol JM, Stein LD, Marth G, Sherry S, et al (2001) A map of human genome sequence variation containing 1.42 million single nucleotide polymorphisms. Nature 409:928–933 [DOI] [PubMed] [Google Scholar]
- Sato N, Katsuya T, Nakagawa T, Ishikawa K, Fu Y, Asai T, Fukuda M, Suzuki F, Nakamura Y, Higaki J, Ogihara T (2000) Nine polymorphisms of angiotensinogen gene in the susceptibility to essential hypertension. Life Sci 68:259–272 [DOI] [PubMed] [Google Scholar]
- Schneider S, Kueffer J-M, Roesslie D, Excoffier L (2000) Arlequin: a software for population genetic data analysis. University of Geneva, Geneva [Google Scholar]
- Schork NJ, Fallin D, Thiel B, Xu X, Broeckel U, Jacob HJ, Cohen D (2001) The future of genetic case-control studies. Adv Genet 42:191–212 [DOI] [PubMed] [Google Scholar]
- Staessen JA, Kuznetsova T, Wang JG, Emelianov D, Vlietinck R, Fagard R (1999) M235T angiotensinogen gene polymorphism and cardiovascular renal risk. J Hypertens 17:9–17 [DOI] [PubMed] [Google Scholar]
- Stephens JC, Schneider JA, Tanguay DA, Choi J, Acharya T, Stanley SE, Jiang R, et al (2001) Haplotype variation and linkage disequilibrium in 313 human genes. Science 293:489–493 [DOI] [PubMed] [Google Scholar]
- Taillon-Miller P, Bauer-Sardina I, Saccone NL, Putzel J, Laitinen T, Cao A, Kere J, Pilia G, Rice JP, Kwok PY (2000) Juxtaposed regions of extensive and minimal linkage disequilibrium in human Xq25 and Xq28. Nat Genet 25:324–328 [DOI] [PubMed] [Google Scholar]
- Taittonen L, Uhari M, Kontula K, Kainulainen K, Miettinen H, Turtinen J, Nuutinen M (1999) Angiotensin converting enzyme gene insertion/deletion polymorphism, angiotensinogen gene polymorphisms, family history of hypertension, and childhood blood pressure. Am J Hypertens 12:858–866 [DOI] [PubMed] [Google Scholar]
- Templeton AR, Clark AG, Weiss KM, Nickerson DA, Boerwinkle E, Sing CF (2000) Recombinational and mutational hotspots within the human lipoprotein lipase gene. Am J Hum Genet 66:69–83 [DOI] [PMC free article] [PubMed] [Google Scholar]
- Terwilliger JD, Weiss KM (1998) Linkage disequilibrium mapping of complex disease: fantasy or reality? Curr Opin Biotechnol 9:578–594 [DOI] [PubMed] [Google Scholar]
- Tishkoff SA, Dietzsch E, Speed W, Pakstis AJ, Kidd JR, Cheung K, Bonne-Tamir B, Santachiara-Benerecetti AS, Moral P, Krings M (1996) Global patterns of linkage disequilibrium at the CD4 locus and modern human origins. Science 271:1380–1387 [DOI] [PubMed] [Google Scholar]
- Tishkoff SA, Goldman A, Calafell F, Speed WC, Deinard AS, Bonne-Tamir B, Kidd JR, Pakstis AJ, Jenkins T, Kidd KK (1998) A global haplotype analysis of the myotonic dystrophy locus: implications for the evolution of modern humans and for the origin of myotonic dystrophy mutations. Am J Hum Genet 62:1389–1402 [DOI] [PMC free article] [PubMed] [Google Scholar]
- Tishkoff SA, Pakstis AJ, Ruano G, Kidd KK (2000a) The accuracy of statistical methods for estimation of haplotype frequencies: an example from the CD4 locus. Am J Hum Genet 67:518–522 [DOI] [PMC free article] [PubMed] [Google Scholar]
- Tishkoff SA, Pakstis AJ, Stoneking M, Kidd JR, Destro-Bisol G, Sanjantila A, Lu RB, Deinard AS, Sirugo G, Jenkins T, Kidd KK, Clark AG (2000b) Short tandem-repeat polymorphism/Alu haplotype variation at the PLAT locus: implications for modern human origins. Am J Hum Genet 67:901–925 [DOI] [PMC free article] [PubMed] [Google Scholar]
- Underhill PA, Shen P, Lin AA, Jin L, Passarino G, Yang WH, Kauffman E, Bonne-Tamir B, Bertranpetit J, Francalacci P, Ibrahim M, Jenkins T, Kidd JR, Mehdi SQ, Seielstad MT, Wells RS, Piazza A, Davis RW, Feldman MW, Cavalli-Sforza LL, Oefner PJ (2000) Y chromosome sequence variation and the history of human populations. Nat Genet 26:358–361 [DOI] [PubMed] [Google Scholar]
- Wall JD, Przeworski M (2000) When did the human population size start increasing? Genetics 155:1865–1874 [DOI] [PMC free article] [PubMed] [Google Scholar]
- Xiong M, Guo SW (1998) The power of linkage detection by the transmission/disequilibrium tests. Hum Hered 48:295–312 [DOI] [PubMed] [Google Scholar]
- Yu A, Zhao C, Fan Y, Jang W, Mungall AJ, Deloukas P, Olsen A, Doggett NA, Ghebranious N, Broman KW, Weber JL (2001) Comparison of human genetic and sequence-based physical maps. Nature 409:951–953 [DOI] [PubMed] [Google Scholar]
- Zavattari P, Deidda E, Whalen M, Lampis R, Mulargia A, Loddo M, Eaves I, Mastio G, Todd JA, Cucca F (2000) Major factors influencing linkage disequilibrium by analysis of different chromosome regions in distinct populations: demography, chromosome recombination frequency and selection. Hum Mol Genet 9:2947–2957 [DOI] [PubMed] [Google Scholar]