Abstract
Recent studies suggest that haplotypes are arranged into discrete blocklike structures throughout the human genome. Here, we present an alternative haplotype block definition that assumes no recombination within each block but allows for recombination between blocks, and we use it to study the combined effects of demographic history and various population genetic parameters on haplotype block characteristics. Through extensive coalescent simulations and analysis of published haplotype data on chromosome 21, we find that (1) the combined effects of population demographic history, recombination, and mutation dictate haplotype block characteristics and (2) haplotype blocks can arise in the absence of recombination hot spots. Finally, we provide practical guidelines for designing and interpreting studies investigating haplotype block structure.
Recently, several studies have proposed that blocklike patterns of linkage disequilibrium (LD), referred to as haplotype blocks, exist throughout the human genome (Daly et al. 2001; Jefferys et al. 2001; Reich et al. 2001). Understanding the distribution and structure of haplotype blocks may facilitate the identification of complex disease genes via genomewide association studies and, in addition, may provide a comprehensive picture of the apportionment of genetic variation throughout the genome (Collins et al. 1999; Kruglyak 1999; Moffatt et al. 2000; Goldstein 2001; Johnson et al. 2001; Weiss and Clark 2002). Although haplotype blocks hold great promise, relatively little is known about the molecular mechanisms and population genetic forces that shape their characteristics.
In this report, we propose a novel haplotype block definition based on the distribution of observed recombination crossovers between loci, using an extension of the four-gamete test (FGT; Hudson and Kaplan 1985). Using this definition, we studied how various population genetic parameters, population history, density of genetic markers, and sample size (number of chromosomes studied) contribute to the distribution of recombination crossovers and, in turn, haplotype block characteristics. Furthermore, through extensive coalescent simulations and published chromosome 21 data, we tested whether recombination hot spots are necessary for the formation of haplotype blocks.
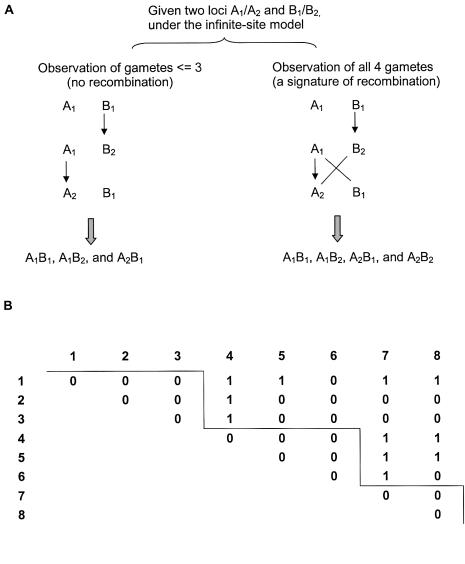
In general, haplotype blocks are defined in two different ways. Specifically, one definition of a haplotype block is a contiguous set of markers in which the average D′ (the standardized coefficient of LD) is greater than some predetermined threshold (Reich et al. 2001). The second definition is based on the concept of “chromosome coverage,” with a haplotype block containing a minimum number of SNPs that account for a majority of common haplotypes (Patil et al. 2001) or a reduced level of haplotype diversity (Daly et al. 2001). These different haplotype block definitions and reconstruction algorithms, or even the same definition with different subjectively determined thresholds, will lead to varying haplotype block patterns. The ambiguities associated with these haplotype block definitions make it difficult to study the mechanism underlying the formation of haplotype block structure. We therefore propose an alternative approach for haplotype block identification that does not require a threshold. The major steps of this algorithm are outlined in figure 1.
Figure 1.
Diagram of the FGT and haplotype block identification. A, Consider two loci A and B, each with two alleles (denoted as A1, A2, B1, and B2). On the left, only three gametes (A1B1, A1B2, and A2B1) are observed between loci A and B (which arise from mutations; suppose A1B1 is the wild type). On the right, recombination has occurred between A1B2 and A2B1 haplotypes, which leads to all four gametes being observed in a sample. B, Haplotype block identification. The FGT is conducted between pairwise loci, and 0 and 1 denote the absence and presence, respectively, of all four gametes between locus pairs. In this example with eight loci, three haplotype blocks were identified, with the first block including SNPs 1, 2, and 3; the second block including SNPs 4, 5, and 6; and the last block including SNPs 7 and 8.
Specifically, for a set of m SNPs, our algorithm begins by performing the FGT between each pairwise SNP to identify past recombination events (fig. 1A). In the absence of recurrent and/or backward mutation, the only explanation for observing all four gametes between a pair of loci is the occurrence of at least one historical recombination event. Next, blocks are identified as a set of contiguous and ordered SNP markers in which there is no evidence for recombination. Blocks are searched from the start of the region by sequential addition of the next locus according to the FGT results. This iterative process continues as long as the number of gametes does not exceed three (fig. 1B). When all four gametes are observed between the kth locus with any of previous loci, locus k is regarded as the putative starting point of a new block, and the block size is determined as the sequence length between the start and the end of the block. We compared this searching algorithm with a greedy searching algorithm (Bogart 2000), and, as expected, the results were quite similar, particularly when sample sizes (number of chromosomes studied) are large (data not shown). With this FGT-based definition, it is possible that a true recombination event may not be detected because of limited sample size. The effect of sample size on the average sizes of the inferred haplotype block was investigated, and the results are presented below.
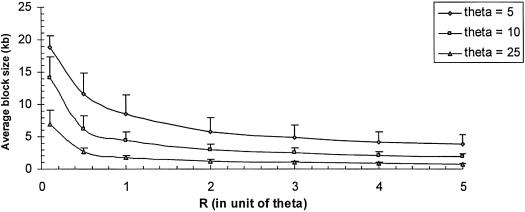
The FGT-based algorithm was applied to data simulated under a coalescent framework, to better understand how different population genetic forces affect haplotype block characteristics. The coalescence is a stochastic process that provides a powerful and fast technique for simulating population genetic data (Hudson 1983; reviewed by Fu and Li 1999; software available at Hudson Lab home page). The parameters of the simulations were θ=4Neμ (the population mutation rate, where Ne is the effective population size and μ is the mutation rate per locus per generation), R=4Ner (the population recombination rate, where r is the recombination rate), and the sample size (n is the number of chromosomes). Figure 2 shows the effect of recombination rate and effective population size on the average haplotype block size. In this figure, R varies from 0.1θ to 5.0θ, which corresponds to a change in r from 0.25×10⁻⁸ to 12.5×10⁻⁸ per generation when the mutation rate, μ, is fixed at 10−9 per site per year (Satta et al. 1993). For a fixed θ, the average haplotype block size decreases with increasing R.
Figure 2.
The effect of recombination and demographic history on haplotype block characteristics; average haplotype block size ± SE versus recombination level for a sample size of 100. If we assume 1 cM = 1 Mb, the recombination rate r is ∼10−8 per generation per intersite. The average block size decreases with the increasing recombination level. The effective population size was adjusted by fixing the ratio of R/θ and allowing θ to vary from 5, 10, and 25 (which corresponds to effective population sizes of 2,000, 4,000, and 10,000).
Population history also affects the average block size, with small populations (i.e., a small effective population size) exhibiting larger blocks (fig. 2). The effective population size was adjusted by fixing the ratio of R/θ and varying R for different values of θ. The three values of θ considered were 5, 10, and 25, which correspond to Ne of 2,000, 4,000, and 10,000, respectively, for μ=10-9. When R is ∼0.5θ, the average block size decreases from 11.7, 6.1, and 2.6 kb as Ne increases from 2,000, 4,000, and 10,000, respectively, assuming a sample size of 100.
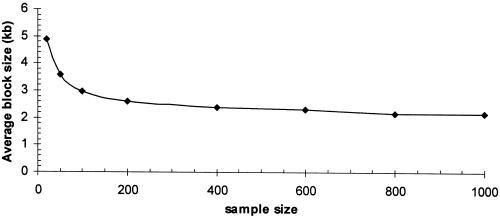
Furthermore, we have also investigated the effect of sample size on the inference of haplotype block characteristics. For the same values of θ and R, by changing the sample size from 20 to 50, 100, 200, 400, 600, 800, and 1,000, respectively, figure 3 shows that a smaller sample size exhibits increased block sizes compared with a larger sample size. Specifically, the average haplotype block size increased from 2.95 kb to 4.88 kb as the sample size decreases from 100 to 20. Thus, sample size is an important parameter to consider in designing studies to investigate haplotype block structure. Large sample sizes are necessary to obtain accurate estimates of block boundaries because historic recombination events might not be detected in a small sample. When the sample size is >100, the decrease in average block size becomes much less. Thus, we suggest that a sample size of at least 100 should be used in haplotype block studies.
Figure 3.
The effect of sample size on haplotype block characteristics; average haplotype block size versus sample sizes. Under the same parameters θ=25 and R=10, which corresponds to a general population with mutation rate 10−9 per site per year, and recombination rate 10−8 per generation, given effective population size as 104, each generation time as 25 years, and total sequence length as 25 kb, changing the sample size from 20 to 50, 100, 200, 400, 600, 800, and 1,000, respectively. Small sample size reveals increased haplotype block sizes. Each simulation is based on 1,000 replications.
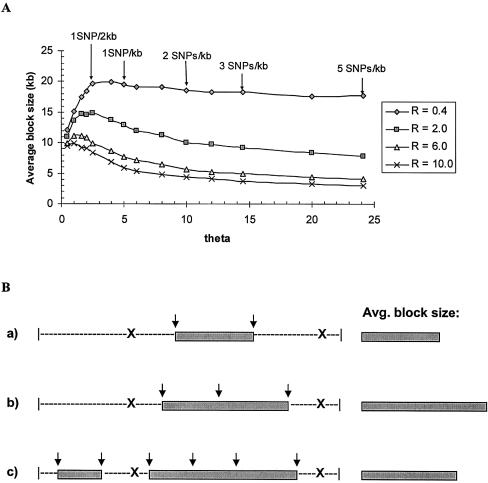
Next, we studied the contribution of θ to haplotype block characteristics by allowing θ to vary for fixed values of R. Practically, the resulting change in θ can be interpreted as a change in either the mutation rate or the SNP density (defined here as the observed number of SNPs per unit distance, irrespective of the underlying mutation rate). For each R in figure 4A, the average block size increases slightly when θ is very small and then decreases until an equilibrium value of θ is reached. A pictorial explanation for why θ affects the average block size is illustrated in figure 4B. A low θ value will lead to a small number of markers in the population and subsequently in the sample, regardless of whether this is due to a low mutation rate or to low SNP density. As a hypothetical example, imagine a genomic region flanked by two sites of recombination (fig. 4B). When θ is small, two markers may be identified, which constitute one block (as shown in panel a of fig. 4B). If θ increases, three markers may be identified, and they form a block whose size is larger compared with (a). As θ continues to increase, enough markers are identified to resolve this genomic region into two block structures (c), whose average block size has now decreased in comparison with (b).
Figure 4.
The effect of SNP density of haplotype block characteristics. A, Average block size versus θ. By fixing R, the average block size increases slightly when θ is very small and then decreases until an equilibrium value of θ is reached. If we assume the mutation rate is constant across a local region, changing θ also corresponds to changing the SNP density. The five arrows denote positions where the SNP density is equal to 0.5, 1, 2, 3, and 5 SNPs/kb, respectively. B, An explanation of why θ influences average block size. Each X represents a recombination position, and each ↓ represents an identified SNP marker. When θ is small, two markers are identified and constitute one block as shown in (a); (b) θ increases, three markers are identified, and they form one block whose size is larger compared with (a); (c) As θ continues to increase, six markers are identified to resolve this region into two blocks, whose average block size has now decreased in comparison with (b). Each simulation is based on 1,000 replications.
Furthermore, the optimal SNP density for haplotype block discovery depends on the local recombination rate. As R increases, the average block size decreases, and thus more markers are required for obtaining accurate estimates of haplotype block boundaries. On the basis of the simulation results, we can cautiously furnish some practical guidelines for SNP density in designing a study. As shown in figure 4A, when the recombination level is low (R=0.4 or r=0.2 cM/Mb in the simulation), a SNP density of 1 SNP/2 kb is sufficient. However, when the recombination level is high (R=2.0 or r=1 cM/Mb in the simulation), a density of at least 2 SNPs/1 kb will be required. Of interest, for values of R>2, the rate of decrease in average block size becomes much less (comparing R=2, 6, 10) and therefore the suggested SNP density of 2 SNPs/1 kb remains valid.
Another important question regarding haplotype blocks is what mechanisms are responsible for their formation. Recombination hot spots have been proposed as a mechanism for generating haplotype blocks (Daly et al. 2001; Goldstein 2001; Gabriel et al. 2002). In support of this hypothesis, Jeffreys et al. (2001) experimentally demonstrated that recombination was clustered into three hot spots in the major histocompatibility complex class II region, and these hot spots corresponded to haplotype block boundaries. However, haplotype blocks may also arise by stochastic variation in models assuming that recombination is randomly distributed (Subrahmanyan et al. 2001).
Results from the coalescent simulations presented above clearly demonstrate that a model of randomly distributed recombination can lead to the formation of haplotype blocks (figs. 2–4). To better understand whether empirical data are consistent with a random or hot spot model of recombination, we applied our FGT-based haplotype block identification algorithm to published chromosome 21 data (Patil et al. 2001) and compared it with the coalescent simulation results.
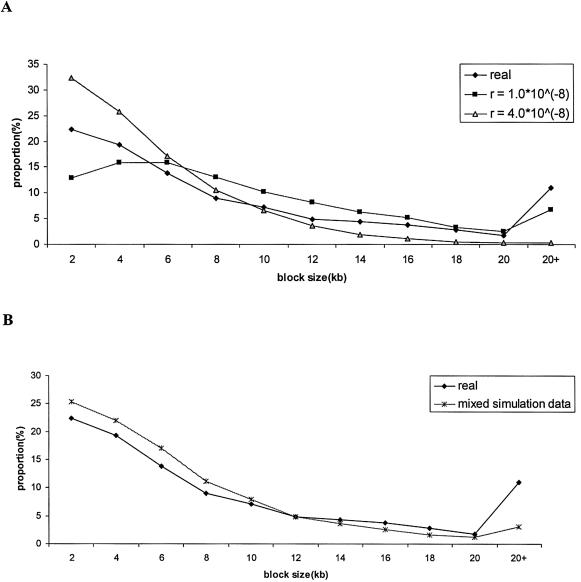
In total, Patil et al. (2001) genotyped 35,989 SNPs from 10 individuals across 32.4 Mb on human chromosome 21 (average 1.1 SNP/kb). The average mutation rate of the whole region can be estimated as 0.3×10⁻⁹ per site per year. To match the real data, this mutation rate was used in the simulations. Since there are many undetermined nucleotides in the real data (denoted as “N”), the true sample size is actually <20. Therefore, we set the sample size (number of chromosomes) to 14 in the simulations, which is the approximate average number of observations across all loci. In addition, we considered two recombination rates, r=1.0×10⁻⁸ and r=4.0×10⁻⁸. The distribution of haplotype block sizes for the real and simulated data is summarized in figure 5A. Although the average block sizes for the real data (8.73 kb) are similar to the ones obtained in the simulated data with r=1.0×10⁻⁸ (9.01 kb) and with r=4.0×10⁻⁸ (4.75 kb), the distributions of block sizes are different (Kolmogorov-Smirnov test, P<10-3 for each pairwise comparison).
Figure 5.
Haplotype block size distribution of published chromosome 21 data and simulations identified by FGT method. For the simulated data, each parameter combination is based on 1,000 replications. A, Distribution of haplotype block length in real data, simulated data assuming r=1.0*10-8, and simulated data assuming r=4.0*10-8. B, Distribution of haplotype block length in real data and simulated data assuming a mixture model of recombination (see text for details).
However, a closer inspection of figure 5A shows that for small block sizes, the real data are more consistent with the simulated data when r=4.0×10⁻⁸, whereas for larger block sizes the real data are more consistent with the simulated data when r=1.0×10⁻⁸. Therefore, we hypothesize that a randomly distributed recombination model (i.e., no hot spots) with a varying recombination rate across the chromosome can explain the empirical data. The distinction between the varying and hot spot recombination models is that in the hot spot model, recombination is heterogeneous both within a given stretch of DNA and across the genome. By contrast, in the varying–recombination rate model, recombination rate is homogeneous within a given stretch of DNA but heterogeneous across the genome. In other words, within a defined genomic region, recombination is uniformly distributed, but the recombination rate can vary across the genome. Supporting this hypothesis, Lynn et al. (2000) studied patterns of recombination, using 187 microsatellite markers spanning chromosome 21, and concluded that the rate of recombination is not uniformly distributed across the chromosome.
To further test our hypothesis, we performed additional simulations and compared the real data with a mixture model in which r=1.0×10⁻⁸ for 50% of the simulation replicates and r=4.0×10⁻⁸ for the remaining 50% of simulation replicates (fig. 5B). The simulated data are again qualitatively similar to the real data. Our point here is not to exhaustively search the parameter space of recombination rates to match the empirical data but rather to illustrate how a simple composition of different recombination rates can lead to haplotype block patterns observed in real data. Furthermore, we emphasize that our hypothesis does not preclude the existence of recombination hot spots (which have been demonstrated to exist; see Jeffreys et al. [2001]) but simply predicts that a randomly distributed recombination model can explain the majority of haplotype block characteristics. Ultimately, the relative contribution of the hot spot and random recombination models in shaping patterns of LD will have to be determined empirically (Jeffreys et al. 2001).
Currently, there is tremendous interest in constructing a haplotype block map of the human genome and in applying it to identify genes underlying complex disease (Daly et al. 2001; Goldstein 2001; Johnson et al. 2001; Gabriel et al. 2002). An important and unresolved question about haplotype blocks in the context of disease gene studies is to what extent block boundaries are conserved across populations. If recombination hot spots are the predominant mechanism underlying the formation of haplotype blocks, then it is likely that blocks will generally be shared across populations, unless population-specific mechanisms of recombination exist. However, our results show that even in the absence of recombination hot spots, randomly distributed recombination events can also lead to the formation of haplotype blocks, and that population genetic parameters combined with demographic history affect block characteristics. Therefore, populations with different demographic histories will likely have different block structures, which suggests that a reference haplotype map may be of limited value in disease gene studies. Recently, Gabriel et al. (2002) concluded that block boundaries are largely shared across populations, which supports the recombination hot spot hypothesis. However, this study focused on common SNPs (minor allele frequency ⩾20%) and common haplotypes (⩾5%), and thus one would expect a high conservation of block structure, given their antiquity. Clearly, empirical studies of relatively less common SNPs and haplotypes need to be conducted and the degree of block sharing across populations reassessed.
In summary, we have presented an objective and stringent haplotype block identification algorithm based on the FGT to investigate the origin of haplotype blocks and to examine the effects of various population genetics forces on haplotype block patterns. Our primary conclusions are that (1) population demographic history, recombination, and mutation jointly dictate haplotype block characteristics, and (2) haplotype blocks can arise in the absence of recombination hot spots. More generally, our results demonstrate that haplotype block structure and characteristics are dictated by individual as well as interactive effects of multiple evolutionary forces (e.g., mutation, recombination, and population history).
Acknowledgments
This work was supported by National Institutes of Health grants to R.C. and L.J. K.Z. was also supported by the Hite Foundation.
Electronic-Database Information
URLs for data in this article are as follows:
- Hudson Lab home page, http://home.uchicago.edu/~rhudson1/source.html (for simulation of the coalescent with recombination and migration [see the program “mksamples”])
References
- Bogart KP (2000) Introductory combinatorics, 3rd ed. Harcourt Academic Press, San Diego [Google Scholar]
- Collins A, Lonjou C, Morton NE (1999) Genetic epidemiology of single-nucleotide polymorphisms. Proc Natl Acad Sci USA 96:15173–15177 [DOI] [PMC free article] [PubMed] [Google Scholar]
- Daly MJ, Rioux JD, Schaffner SF, Hudson TJ, Lander ES (2001) High-resolution haplotype structure in the human genome. Nat Genet 29:229–232 [DOI] [PubMed] [Google Scholar]
- Fu YX, Li WH (1999) Coalescing into the 21st century: an overview and prospects of coalescent theory. Theor Popul Biol 56:1–10 [DOI] [PubMed] [Google Scholar]
- Gabriel SB, Schaffner SF, Nguyen H, Moore JM, Roy J, Blumenstiel B, Higgins J, Defelice M, Lochner A, Faggart M, Liu-Cordero SN, Rotimi C, Adeyemo A, Cooper R, Ward R, Lander ES, Daly MJ, Altshuler D (2002) The structure of haplotype blocks in the human genome. Science 296:2225–2229 [DOI] [PubMed] [Google Scholar]
- Goldstein DB (2001) Islands of linkage disequilibrium. Nat Genet 29:109–111 [DOI] [PubMed] [Google Scholar]
- Hudson RR (1983) Properties of a neutral allele model with intragenic recombination. Theor Popul Biol 23:183–201 [DOI] [PubMed] [Google Scholar]
- Hudson RR, Kaplan NL (1985) Statistical properties of the number of recombination events in the history of a sample of DNA sequences. Genetics 111:147–164 [DOI] [PMC free article] [PubMed] [Google Scholar]
- Johnson GC, Esposito L, Barratt BJ, Smith AN, Heward J, Genova GD, Ueda H, Cordell HJ, Eaves IA, Dudbridge F, Twells RC, Payne F, Hughes W, Nutland S, Stevens H, Carr P, Tuomilehto-Wolf E, Tuomilehto J, Gough SC, Clayton DG, Todd JA (2001) Haplotype tagging for the identification of common disease genes. Nat Genet 29:233–237 [DOI] [PubMed] [Google Scholar]
- Lynn A, Kashuk C, Petersen MB, Bailey JA, Cox DR, Antonarakis SE, Chakravarti A (2000) Patterns of meiotic recombination on the long arm of human chromosome 21. Genome Res 10:1319–1332 [DOI] [PubMed] [Google Scholar]
- Jeffreys AJ, Kauppi L, Neumann R (2001) Intensely punctuate meiotic recombination in the class II region of the major histocompatibility complex. Nat Genet 29:217–222 [DOI] [PubMed] [Google Scholar]
- Johnson G, Esposito L, Barratt BJ, Smith AN, Heward J, Genova GD, Ueda H, Cordell HJ, Eaves IA, Dudbridge F, Twells R, Payne F, Hughes W, Nutland S, Stevens H, Carr P, Tuomilehto-Wolf E, Tuomilehto J, Gough S, Clayton DG, Todd JA (2001) Haplotype tagging for the identification of common disease genes. Nat Genet 29:233–237 [DOI] [PubMed] [Google Scholar]
- Kruglyak L (1999) Prospects for whole-genome linkage disequilibrium mapping of common disease genes. Nat Genet 22:139–144 [DOI] [PubMed] [Google Scholar]
- Moffatt MF, Traherne JA, Abecasis GR, Cookson W (2000) Single nucleotide polymorphism and linkage disequilibrium within the TCR α/δ locus. Hum Mol Genet 9:1011–1019 [DOI] [PubMed] [Google Scholar]
- Patil N, Berno AJ, Hinds DA, Barrett WA, Doshi JM, Hacker CR, Kautzer CR, Lee DH, Marjoribanks C, McDonough DP, Nguyen B, Norris MC, Sheehan JB, Shen N, Stern D, Stokowski RP, Thomas DJ, Trulson MO, Vyas KR, Frazer KA, Fodor S, Cox DR (2001) Blocks of limited haplotype diversity revealed by high-resolution scanning of human chromosome 21. Science 294:1719–1723 [DOI] [PubMed] [Google Scholar]
- Reich DE, Cargill M, Bolk S, Ireland J, Sabeti PC, Richter DJ, Lavery T, Kouyoumjian R, Farhadian SF, Ward R, Lander ES (2001) Linkage disequilibrium in the human genome. Nature 411:199–204 [DOI] [PubMed] [Google Scholar]
- Satta Y, Ohuigin C, Takahata N, Klein J (1993) The synonymous substitution rate of the major histocompatibility complex loci in primates. Proc Natl Acad Sci USA 90:7480–7484 [DOI] [PMC free article] [PubMed] [Google Scholar]
- Subrahmanyan L, Eberle MA, Clark AG, Kruglyak L, Nickerson DA (2001) Sequence variation and linkage disequilibrium in the human T-cell receptor β (TCRB) locus. Am J Hum Genet 69:381–395 [DOI] [PMC free article] [PubMed] [Google Scholar]
- Weiss KM, Clark AG (2002) Linkage disequilibrium and the mapping of complex human traits. Trends Genet 18:19–24 [DOI] [PubMed] [Google Scholar]


