

Abstract
TDP-43 and FUS are linked to amyotrophic lateral sclerosis (ALS) and frontotemporal lobar degeneration (FTLD), and loss of function of either protein contributes to these neurodegenerative conditions. To elucidate the TDP-43- and FUS-regulated pathophysiological RNA metabolism cascades, we assessed the differential gene expression and alternative splicing profiles related to regulation by either TDP-43 or FUS in primary cortical neurons. These profiles overlapped by >25% with respect to gene expression and >9% with respect to alternative splicing. The shared downstream RNA targets of TDP-43 and FUS may form a common pathway in the neurodegenerative processes of ALS/FTLD.
Keywords: ALS, FTLD, TDP-43, FUS, Transcriptome
Abbreviations: ALS, amyotrophic lateral sclerosis; Cugbp1, CUG triplet repeat, RNA-binding protein 1; DAVID, Database for Annotation, Visualization and Integrated Discovery; FTLD, frontotemporal lobar degeneration; FUS, fused in sarcoma; GFAP, glial fibrillary acidic protein; GO, Gene Ontology; hnRNAPs, heterogeneous ribonucleoproteins; LTP, long-term potentiation; RIN, RNA integrity numbers; RMA, robust multichip average; RRMs, RNA recognition motifs; SBMA, spinal and bulbar muscular atrophy; shCont, shRNA/control; shCugbp1, shRNA/Cugbp1; shFUS, shRNA/FUS; shTDP, shRNA/TDP-43; TDP-43, transactive response (TAR) DNA-binding protein 43; TGF, transforming growth factor
Highlights
-
•
We established TDP-43-silenced primary cortical neurons using lentivirus.
-
•
We compared TDP-43 and FUS transcriptome profiles in primary cortical neurons.
-
•
The sets of genes with altered expression levels upon TDP-43 knockdown or FUS knockdown overlapped by >25%.
-
•
The sets of genes with altered exon splicing upon TDP-43 knockdown or FUS knockdown overlapped by >9%.
1. Introduction
Amyotrophic lateral sclerosis (ALS) is a neurodegenerative disorder characterized by the death of motor neurons in the spinal cord, brainstem, and motor cortex [1]. Frontotemporal lobar degeneration (FTLD) is a dementia syndrome characterized by progressive changes in behavior, personality, and/or language resulting from the gradual deterioration of the frontal and temporal lobes [2,3]. Transactive response (TAR) DNA-binding protein 43 (TDP-43) and fused in sarcoma (FUS) have been genetically and pathologically linked to ALS and FTLD; however, the underlying mechanisms by which TDP-43 and FUS induce ALS and FTLD pathologies are unknown [2,3].
TDP-43 was identified as a major component of cytoplasmic neuronal inclusions in sporadic ALS and FTLD patients [4,5], and missense mutations in TARDBP, the gene encoding TDP-43, are a known cause of familial ALS and FTLD [6–8]. Familial cases of ALS and FTLD involving TDP-43 mutations and sporadic cases of these diseases exhibit highly similar clinical and pathological characteristics [9], suggesting that TDP-43 plays an important role in the pathogenesis of sporadic ALS and FTLD. Similarly, FUS is also a causative gene for familial ALS and FTLD; in these diseases, redistribution to the cytoplasm and the formation of cytoplasmic aggregates occur for both the TDP-43 and FUS proteins [10,11]. TDP-43 and FUS also share many common pathophysiological characteristics. In particular, these proteins are structurally similar heterogeneous ribonucleoproteins (hnRNPs), as both TDP-43 and FUS are RNA-binding proteins with RNA recognition motifs (RRMs); they are typically predominantly found in the nucleus; their pathological forms are located mainly in the cytosol; and they are involved in transcription, alternative splicing, translation, and RNA transport [12–14].
Although it remains unclear whether a loss of function or gain of toxicity of TDP-43 or FUS is a major cause of ALS/FTLD, the loss of these RNA-binding proteins in the nucleus is a plausible trigger of neurodegeneration. This hypothesis has been supported by several lines of evidence, including the fact that TDP-43 or FUS nuclear staining is lost in the nuclei of neurons in both human ALS/FTLD tissue [15,16] and TDP-43 overexpressing mice [17,18]. In addition, animal models involving the loss of either TDP-43 or FUS mimic the pathology of ALS/FTLD [19–22]. Recently, analyses of TDP-43 using fly models revealed that the up- and down-regulation of TDP-43 produced highly similar transcriptome alterations [23]. Cross-rescue analysis in Drosophila demonstrated that FUS acted together with and downstream of TDP-43 in a common genetic pathway [21]. Thus, it is intriguing to compare the transcriptome profiles from neurons with silenced TDP-43 or FUS. This experiment could clarify the common molecular mechanisms of ALS/FTLD that are associated with TDP-43 and FUS.
Recently, we investigated the transcriptome profiles of FUS regulation in different cell lineages of the central nervous system and determined that FUS regulates both gene expression and alternative splicing events in a cell-specific manner that is associated with ALS/FTLD [24]. In the current study, we investigated the transcriptome profiles of TDP-43-silenced primary cortical neurons and compared these profiles with the transcriptome profiles of FUS-silenced neurons. The gene expression and alternative splicing event profiles related to regulation by TDP-43 and by FUS were rather similar, suggesting that TDP-43 and FUS may regulate common downstream RNA targets and molecular cascades that could potentially be associated with the pathomechanisms of ALS/FTLD.
2. Methods
2.1. Lentivirus
We designed two different shRNAs against mouse Tardbp (Tdp-43), Fus, and a control shRNA. The targeted sequences were 5′-CGATGAACCCATTGAAATA-3′ for shRNA/TDP-43–1 (shTDP1); 5′-GAGTGGAGGTTATGGTCAA-3′ for shRNA/TDP-43–2 (shTDP2); 5′-GCAACAAAGCTACGGACAA-3′ for shRNA/FUS1 (shFUS1); 5′-GAGTGGAGGTTATGGTCAA-3′ for shRNA/FUS2 (shFUS2); 5′-GGCTTAAAGTGCAGCTCAA-3′ for shRNA/Cugbp1 (shCugbp1); and 5′-AAGCAAAGATGTCTGAATA-3′ for shRNA/control (shCont). The shRNAs were cloned into a lentiviral shRNA vector (pLenti-RNAi-X2 puro DEST, w16–1, which was a kind gift from Dr. Eric Campeau at Resverlogix Corp.). Lentivirus was prepared in accordance with the protocols detailed by Campeau et al. [25].
2.2. Primary cortical neuron culture and the depletion of TDP-43 and FUS
Primary cortical neurons were obtained from the fetal brains of C57BL/6 mouse embryos on embryonic day 15 (E15). The detailed procedure for acquiring these neurons was described in previously published reports [26]. On day 5, neurons were infected with 2 × 10¹⁰ copies/well (1.5 × 10⁷ copies/μl) of lentivirus expressing shRNA against mouse Tdp-43 (shTDP1 or shTDP2), mouse Cugbp1 (CUG triplet repeat, RNA-binding protein 1) (shCugbp1), or scrambled control (shCont). The virus-containing media was removed at 4 h after infection. The neurons were then cultured for 6 additional days and harvested on day 11 for RNA extraction and cDNA synthesis. Each knockdown experiment was performed in triplicate for each microarray analysis. Experiments were performed in accordance with the Guide for the Care and Use of Laboratory Animals issued by the National Institutes of Health and with the approval of the Nagoya University Animal Experiment Committee (Nagoya, Japan). The experiments on FUS-silenced primary cortical neurons were performed in the manner described above and have been detailed in a previously published report [26].
For immunohistochemical analyses, we used an anti-β-tubulin antibody (TU20, Santa Cruz, Santa Cruz, CA), an anti-glial fibrillary acidic protein (GFAP) antibody (EB4, Enzo Life Sciences, Plymouth Meeting, PA), and 4′,6-diamidino-2-phenylindole (DAPI) staining.
For immunoblot analyses, cells were lysed in TNE buffer containing protease inhibitors for 15 min on ice. The lysates were then cleared by centrifuging the cells at 13,000g for 15 min at 4 °C. Lysates were normalized for total protein (10 μg per lane), separated using a 4–20% linear gradient SDS–PAGE and electroblotted. For immunoblot, we used anti-FUS antibodies (A300–293A, Bethyl Laboratories, Montgomery, TX), anti-TDP-43 antibody (Proteintech, Chicago, IL), and anti-actin antibody (Sigma, St. Louis, MO).
2.3. Microarray analysis
Total RNA was extracted from primary cortical neurons using the RNeasy Mini Kit (Qiagen, Hilden, Germany). We confirmed that the RNA integrity numbers (RIN) for the extracted samples were all greater than 7.0. We synthesized and labeled cDNA fragments from 100 ng of total RNA using the GeneChip WT cDNA Synthesis Kit (Ambion, Austin, TX). Hybridization and signal acquisition for the GeneChip Mouse Exon 1.0 ST Array (Affymetrix, Santa Clara, CA) were performed according to the manufacturer's instructions. Each array experiment was performed in triplicate. The robust multichip average (RMA) and iterative probe logarithmic intensity error (iterPLIER) methods were employed to normalize exon-level and gene-level signal intensities, respectively, using Expression Console 1.1.2 (Affymetrix). We utilized the gene annotation provided by Ensembl version e!61, which is based on the National Center for Biotechnology Information (NCBI) Build 37.1/mm9 of the mouse genome assembly. All microarray data were registered in the Gene Expression Omnibus with accession numbers of GSE36153 (shFUS) and GSE46148 (shTDP-43 and shCugbp1).
Using Student's t-test, we compared the gene-level signal intensities from three controls treated with shCont with the gene-level signal intensities of three samples treated with either shTDP1 or shTDP2. We also analyzed alternative splicing profiles by filtering the exon-level signal intensities, using a t-test with a threshold of p-value ≤0.1. Gene expression and alternative splicing profiles related to FUS regulation in primary cortical neurons were also obtained by comparing gene-level and exon-level signal intensities from three controls treated with shCont with the corresponding signal intensities from three samples treated with either shFUS1 or shFUS2, as previously described [26]. As a control for the RNA-binding protein-silencing model, we analyzed the gene-level and exon-level signal intensities of three samples treated with wither shCugbp1or shCont.
2.4. RT-PCR for alternative splicing analyses
Total RNA was isolated from cells using the RNeasy Mini Kit (Qiagen). The extracted RNA was then treated with DNase I (Qiagen). cDNA was synthesized from 1 μg of total RNA using oligo(dT) primers (Promega, Madison, WI). Primers for each candidate exon were designed using the Primer3 software program (http://frodo.wi.mit.edu/primer3/input.htm). The primer sequences are provided in Supplementary Table 1. Semi-quantitative reverse transcription polymerase chain reaction (RT-PCR) was performed using Ex Taq (Takara Bio Inc., Otsu, Japan), with the following amplification conditions: 25–30 cycles of 98 °C for 10 s, 60 °C for 30 s, and 72 °C for 1 min. The PCR products were electrophoresed on a 15% acrylamide gel and stained with ethidium bromide. The intensity of each band was measured using the Multi Gauge software program (Fujifilm, Tokyo, Japan).
2.5. Real-time qPCR for gene expression analysis
The RNeasy Mini Kit (Qiagen) was used to isolate total RNA from cells; 1 μg of total RNA was then reverse transcribed, using oligo-dT primers. This transcription utilized the CFX96 system (BioRad, Hercules, CA) and thermocycler conditions of 95 °C for 3 min followed by 40 cycles of 95 °C for 10 s and 55 °C for 30 s.
The relative quantity of each transcript was calculated by creating a standard curve using the cycle thresholds for serial dilutions of complementary DNA (cDNA) samples, normalized to quantities of β-actin. The PCR was performed in triplicate for each sample, and all experiments were repeated twice. iQ SYBR Green Supermix (BioRad) and the sets of primers listed in Supplementary Table 1 were used for real-time quantitative polymerase chain reaction (qPCR) amplifications.
3. Results
3.1. The shRNA-mediated silencing of TDP-43 and FUS in primary cortical neurons using lentivirus
To compare the global profiles of RNA molecules regulated by TDP-43 and FUS in primary cortical neurons, we produced TDP-43-silenced primary motor neurons by infecting neurons with lentivirus expressing shRNA against TDP-43; control neurons were produced by infection with lentivirus expressing RNA against a scrambled control. The profiles of FUS-silenced primary cortical neurons using shFUS1 and shFUS2 were established in a previous study [26]. The purity of the primary cortical neurons was confirmed through immunostaining. We successfully established the desired primary cortical neurons with a purity of greater than 95% (Supplementary Fig. S1A).
The expression levels of TDP-43 were suppressed by approximately 60–90% by shTDP1 or shTDP2, as measured by real-time qPCR (Supplementary Fig. S1B). The expression levels of FUS were also suppressed by 80–90% by shFUS1 or shFUS2, as reported previously [26]. The protein levels of TDP-43 were markedly lower in primary neurons infected with shTDP1 and shTDP2 than in neurons infected with the shCont based on the immunoblot analysis (Supplementary Fig. S1C, left). In addition, a reduction in FUS protein levels was observed in primary neurons infected with shFUS1 or shFUS2 (Supplementary Fig. S1C, right).
As a control for the RNA-binding protein-silencing model, we knocked down the Cugbp1 gene in primary cortical neurons and confirmed that this knockdown produced a silencing efficiency of greater than 70% (Supplementary Fig. S2).
3.2. Significant overlap in the transcriptomes of TDP-43-silenced neurons and FUS-silenced neurons
We analyzed gene expression levels and alternative splicing in TDP-43-silenced primary neurons using the Affymetrix GeneChip Mouse Exon 1.0 ST Array (GEO Accession No. GSE46148). We used Student's t-test to compare the gene-level signal intensities of three controls treated with shCont with the gene-level signal intensities of three samples treated with either shTDP1 or shTDP2. Among the 21,603 genes on the mouse exon array, 1411 genes had p-values ≤0.01 for both shTDP1 and shTDP2 treatments in the t-tests, and the correlation coefficient between the fold changes of the shTDP1 and shTDP2 treatments was 0.83 (Supplementary Fig. S3A).
We also analyzed alternative splicing profiles by filtering the exon-level signal intensities using a threshold of a t-test p-value ≤0.1. This filtering yielded 4973 exons that were altered by both shTDP1 and shTDP2, with a correlation coefficient of 0.801 (Supplementary Fig. S3B). To identify common effects produced by silencing TDP-43 and silencing FUS, we compiled a list of differentially expressed genes and alternatively spliced exons in primary cortical neurons silenced by shTDP-43 and in primary cortical neurons silenced by shFUS. By applying the threshold of a t-test p-value of ≤0.05 and a fold change of ≤0.67 or ≥1.5 for both shTDP1 and shTDP2, we obtained 204 genes with altered expression levels upon TDP-43 knockdown. Similarly, 183 genes were obtained for FUS by applying the threshold of a t-test p-value of ≤0.05 and a fold change value of ≤0.67 or ≥1.5 for both shFUS-1 and shFUS-2. Venn diagrams indicated that the set of genes or exons with expression that were differentially and consistently regulated by FUS markedly overlapped with the corresponding set of genes or exons for TDP-43 (t-test, p < 0.05). In particular, an overlap of more than 25% was observed among the gene expression profiles of shTDP-43- and shFUS-treated neurons (Fig. 1A, top panel; 51/204 (25.0%) of the genes for shTDP-43; 51/183 (27.9%) of the genes for shFUS).
Fig. 1.

Comparisons of the gene expression and exon splicing profiles of TDP-43-silenced primary cortical neurons and FUS-silenced primary cortical neurons. (A) Gene expression and alternative splicing profiles of TDP-43-silenced primary cortical neurons- and FUS-silenced primary cortical neurons were compared. Venn diagrams indicate the overlaps in the genes (top) and exons (bottom) with expression levels that were uniquely or concordantly regulated by TDP-43 and/or FUS (t-test, p < 0.05; fold change ≤0.67 or ≥1.5). (B) The fold changes in overlapping genes filtered by t-tests (with a threshold of p < 0.1) were plotted for TDP-43-silenced primary cortical neurons and FUS-silenced primary cortical neurons. Scatter plots of the fold changes in gene expression levels (left) and alternative splicing events (right) for shTDP-43 and shFUS. The R2 value was calculated for genes and exons with t-test p-values <0.1.
We also filtered the exon-level signal intensities by applying a threshold of a t-test p-value of ≤0.05 and a fold change value of ≤0.67 or ≥1.5. We then determined TDP-43- and FUS-regulated exons as well as the overlap between these exons using the same approach that we applied for gene expression. We obtained 675 TDP-43-regulated genes and 429 FUS-regulated genes with altered exon expression. Venn diagrams indicate that there was an overlap of approximately 10% between the alternative splicing profiles produced by shFUS and the alternative splicing profiles produced by shTDP-43 (Fig. 1A, bottom panel; 61/674 (9.1%) of the genes for shTDP-43; 61/428 (14.3%) of the genes for shFUS).
We then compared the changes in the overlapping genes or exons affected by both shTDP-43 and shFUS after filtering these genes and exons using a t-test (with a threshold of p < 0.1). The fold change plot analysis demonstrated a strong correlation between shTDP-43 and shFUS with respect to gene expression (Fig. 1B left; R2 = 0.78); in contrast, the gene expression profile for neurons transduced with shRNA targeting a different RNA-binding protein, Cugbp1, did not correlate well with the expression profiles of neurons transduced with shTDP-43 (R2 = 0.46) or shFUS (R2 = 0.53) (Supplementary Fig. S4A). The fold change plot analysis of exon splicing also demonstrated a moderate correlation between shTDP-43 and shFUS (Fig. 1B right; R2 = 0.64). The exon splicing profile for neurons silenced with shRNA against Cugbp1 showed lesser correlation with the exon splicing profiles of neurons transduced with shTDP-43 (R2 = 0.52) or shFUS (R2 = 0.48) (Supplementary Fig. S4B).
We next analyzed the Gene Ontology (GO) terms for the genes that were regulated by TDP-43 and FUS (t-test, p < 0.1; fold change of ≤0.77 or ≥1.3) using the Database for Annotation, Visualization and Integrated Discovery (DAVID), version 6.7 [27,28]. Genes regulated by TDP-43 were mainly categorized as being involved in signaling cascades and metabolic processes, and the GO terms for these genes were similar to the GO terms for genes regulated by FUS. In the list of the top 20 GO terms for genes with TDP-43-regulated expression and the corresponding list for genes with FUS-regulated expression, we identified eight common GO terms, including “small GTPase-mediated signal transduction” and “Wnt receptor signaling pathway” (Table 1). We also compiled the list of top 20 GO terms for genes with Cugbp1-regulated expression (Supplementary Table S2). Only one and three common GO terms were identified in between the lists of Cugbp1- and TDP-43-regulated expression (GO:0007264) and Cugbp1- and FUS-regulated expression (GO:0007264, 0019637, and 0006644), respectively. In contrast, the GO terms for genes with TDP-43- or FUS-related alternative splicing regulation mainly referred to various neuronal functions; however, none of the same GO terms appeared in both the list of the top 20 GO terms for genes with TDP-43-regulated alternative splicing and the corresponding list for genes with FUS-regulated alternative splicing (Table 1).
Table 1.
Gene Ontology terms for gene expression/alternative splicing in TDP-43- or FUS-silenced neurons.
| shTDP-43 |
Gene expression |
shFUS |
Gene expression |
||
|---|---|---|---|---|---|
| GO ID | Term | p-Value | GO ID | Term | p-Value |
| GO:0007264 | Small GTPase mediated signal transduction | 8.37E−07 | GO:0019637 | Organophosphate metabolic process | 3.68E−04 |
| GO:0007242 | Intracellular signaling cascade | 1.04E−05 | GO:0006644 | Phospholipid metabolic process | 4.89E−04 |
| GO:0044271 | Nitrogen compound biosynthetic process | 2.98E−04 | GO:0016055 | Wnt receptor signaling pathway | 5.21E−04 |
| GO:0006790 | Sulfur metabolic process | 9.94E−04 | GO:0009100 | Glycoprotein metabolic process | 5.30E−04 |
| GO:0009100 | Glycoprotein metabolic process | 0.00169596 | GO:0007264 | Small GTPase mediated signal transduction | 5.91E−04 |
| GO:0009101 | Glycoprotein biosynthetic process | 0.0019038 | GO:0006650 | Glycerophospholipid metabolic process | 8.42E−04 |
| GO:0018130 | Heterocycle biosynthetic process | 0.0033067 | GO:0007242 | Intracellular signaling cascade | 0.00122745 |
| GO:0022604 | Regulation of cell morphogenesis | 0.00426464 | GO:0007265 | Ras protein signal transduction | 0.00389788 |
| GO:0016055 | Wnt receptor signaling pathway | 0.00455985 | GO:0046486 | Glycerolipid metabolic process | 0.00481341 |
| GO:0031344 | Regulation of cell projection organization | 0.00619132 | GO:0006665 | Sphingolipid metabolic process | 0.00514754 |
| GO:0043085 | Positive regulation of catalytic activity | 0.0063261 | GO:0030384 | Phosphoinositide metabolic process | 0.00562443 |
| GO:0031345 | Negative regulation of cell projection organization | 0.00656187 | GO:0006793 | Phosphorus metabolic process | 0.00563812 |
| GO:0043413 | Biopolymer glycosylation | 0.00855583 | GO:0006796 | Phosphate metabolic process | 0.00563812 |
| GO:0006486 | Protein amino acid glycosylation | 0.00855583 | GO:0006643 | Membrane lipid metabolic process | 0.00613362 |
| GO:0070085 | Glycosylation | 0.00855583 | GO:0009101 | Glycoprotein biosynthetic process | 0.00691847 |
| GO:0010975 | Regulation of neuron projection development | 0.00912726 | GO:0051348 | Negative regulation of transferase activity | 0.00924863 |
| GO:0030384 | Phosphoinositide metabolic process | 0.010632 | GO:0006600 | Creatine metabolic process | 0.01095567 |
| GO:0010769 | Regulation of cell morphogenesis involved in differentiation | 0.01225994 | GO:0044242 | Cellular lipid catabolic process | 0.01200742 |
| GO:0019932 | Second-messenger-mediated signaling | 0.01617062 | GO:0006486 | Protein amino acid glycosylation | 0.01276803 |
| GO:0050770 | Regulation of axonogenesis | 0.01657312 | GO:0070085 | Glycosylation | 0.01276803 |
| shTDP-43 | Alternative splicing | shFUS | Alternative splicing | ||
| GO ID | Term | p-Value | GO ID | Term | p-Value |
| GO:0016192 | Vesicle-mediated transport | 2.76E−05 | GO:0045202 | Synapse | 6.85E−07 |
| GO:0044057 | Regulation of system process | 2.41E−04 | GO:0042995 | Cell projection | 2.54E−06 |
| GO:0006936 | Muscle contraction | 5.09E−04 | GO:0043005 | Neuron projection | 2.29E−05 |
| GO:0003012 | Muscle system process | 7.75E−04 | GO:0005856 | Cytoskeleton | 1.73E−04 |
| GO:0006897 | Endocytosis | 0.00107681 | GO:0005886 | Plasma membrane | 1.88E−04 |
| GO:0010324 | Membrane invagination | 0.00107681 | GO:0043232 | Intracellular non-membrane-bounded organelle | 2.07E−04 |
| GO:0046903 | Secretion | 0.00244805 | GO:0043228 | Non-membrane-bounded organelle | 2.07E−04 |
| GO:0048167 | Regulation of synaptic plasticity | 0.00322575 | GO:0044456 | Synapse part | 3.76E−04 |
| GO:0050804 | Regulation of synaptic transmission | 0.00339707 | GO:0030424 | Axon | 5.70E−04 |
| GO:0050808 | Synapse organization | 0.00342093 | GO:0031252 | Cell leading edge | 7.01E−04 |
| GO:0043524 | Negative regulation of neuron apoptosis | 0.0036232 | GO:0044463 | Cell projection part | 7.08E−04 |
| GO:0051969 | Regulation of transmission of nerve impulse | 0.00432752 | GO:0030054 | Cell junction | 7.20E−04 |
| GO:0006887 | Exocytosis | 0.00477415 | GO:0015630 | Microtubule cytoskeleton | 0.00738251 |
| GO:0031644 | Regulation of neurological system process | 0.00525083 | GO:0045211 | Postsynaptic membrane | 0.00825557 |
| GO:0032940 | Secretion by cell | 0.00587779 | GO:0042734 | Presynaptic membrane | 0.0133955 |
| GO:0006816 | Calcium ion transport | 0.00667547 | GO:0044430 | Cytoskeletal part | 0.02340953 |
| GO:0016044 | Membrane organization | 0.0067241 | GO:0044459 | Plasma membrane part | 0.02454379 |
| GO:0046777 | Protein amino acid autophosphorylation | 0.00788146 | GO:0001726 | Ruffle | 0.03547283 |
| GO:0007628 | Adult walking behavior | 0.01199082 | GO:0032589 | Neuron projection membrane | 0.04340658 |
| GO:0043523 | Regulation of neuron apoptosis | 0.01330492 | GO:0005938 | Cell cortex | 0.04544057 |
3.3. Gene expression profiles are similar among the top 20 genes regulated by TDP-43 and FUS
We next investigated the detailed gene expression profiles of TDP-43-silenced primary cortical neurons. By filtering gene-level signal intensities using a t-test (with a threshold of p-value ≤0.1) and fold change (which was required to be ≤0.67 or ≥1.5), genes with differential expression in TDP-43-silenced primary cortical neurons were selected. Fourteen of the top 20 genes with expression regulated by TDP-43 were also regulated by FUS (Supplementary Table S3). To select genes with differential expression upon changes in FUS regulation, gene-level signal intensities in the profile of FUS-silenced primary cortical neurons were filtered using a t-test (with a threshold of p-value ≤0.1) and fold change (which was required to be ≤0.67 or ≥1.5). Genes that were differentially expressed in both TDP-43-silenced primary cortical neurons and FUS-silenced primary cortical neurons (as determined by the p-value ≤0.1 and fold change of ≤0.67 or ≥1.5 requirements) are listed with their fold change values in Table 2. The list of commonly regulated genes includes 12 genes: five downregulated genes, such as Tgfbr1 (transforming growth factor-β receptor I; Fig. 2A), and seven upregulated genes, such as Stx1a (syntaxin 1A; Fig. 2B). The results were validated using quantitative reverse transcription polymerase chain reaction (qRT-PCR) and shown as mRNA expression ratio to β-actin (Fig. 2) and Gapdh (Supplementary Fig. S5).
Table 2.
Differentially expressed genes regulated by both TDP-43 and FUS.
| Gene symbol | Gene name | shTDP_FC | shFUS_FC |
|---|---|---|---|
| Tgfbr1 | Transforming growth factor, beta receptor 1 | 0.38 | 0.40 |
| Tap1 | Transporter 1, ATP-binding cassette, sub-family B (MDR/TAP) | 0.53 | 0.41 |
| Ccbe1 | Collagen and calcium binding EGF domains 1 | 0.60 | 0.60 |
| Sla | src-like adaptor | 0.61 | 0.58 |
| Vamp1 | Vesicle-associated membrane protein 1 | 0.66 | 0.64 |
| Rab15 | RAB15, member RAS oncogene family | 1.96 | 2.10 |
| Taf9b | TAF9B RNA polymerase II, TATA box binding protein (TBP)-associated factor | 2.00 | 3.13 |
| Ilk | Integrin-linked kinase | 2.08 | 2.16 |
| Nacc1 | Nucleus accumbens associated 1, BEN and BTB (POZ) domain containing | 2.29 | 2.49 |
| Qpctl | Glutaminyl-peptide cyclotransferase-like | 2.37 | 2.63 |
| Syt17 | Synaptotagmin 17 | 3.08 | 1.82 |
| Stx1a | Syntaxin 1A | 3.08 | 2.45 |
Fig. 2.
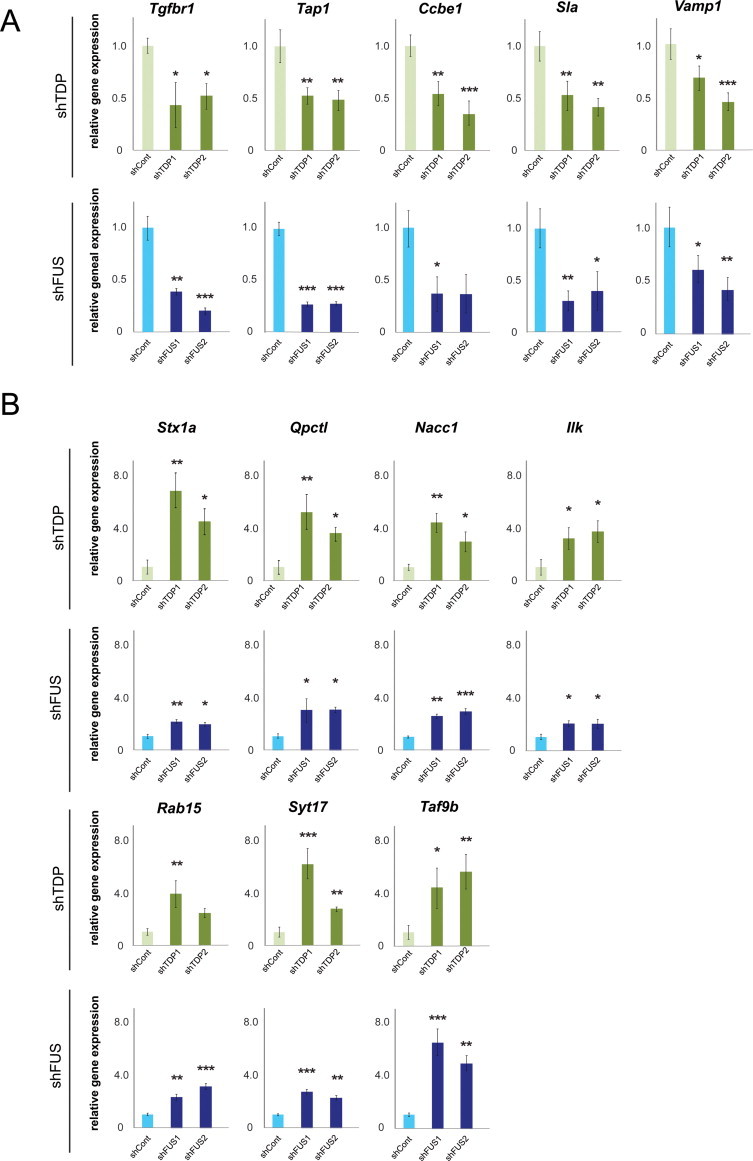
The validation of differentially expressed genes regulated by both TDP-43 and FUS. Twelve genes with differential expression in both TDP-43-silenced neurons and FUS-silenced neurons in Table 2 were validated by real-time qPCR (n = 3; mean and SD). Quantities are calculated by the ratio to β-actin and shown as the relative expression ratio to shCont. Five commonly down-regulated genes (A) and seven commonly up-regulated genes (B) are indicated. Statistics were done by one-way ANOVA and Tukey test. * (p < 0.05), ** (p < 0.01), and *** (p < 0.001) denote significant differences.
3.4. Genes with altered exon splicing regulated by both TDP-43 and FUS
After filtering the exons in genes that were differentially expressed in both shTDP1- and shTDP2-treated neurons, using the threshold of a t-test p-value of ≤0.1 and a fold change of ≥1.3 in primary neurons, we compared these exons with the profiles of alternatively spliced exons in shFUS1 and shFUS2 to obtain genes with altered splicing events that were commonly regulated by both TDP-43 and FUS. After validation by RT-PCR, we obtained 8 exons with alternative splicing events regulated by both TDP-43 and FUS (Table 3 and Fig. 3).
Table 3.
Genes with altered exon splicing regulated by both TDP-43 and FUS.
| Gene symbol | Gene name | Spliced site | |
|---|---|---|---|
| Braf | Braf transforming gene | Exon12 | Skipping |
| Camk2a | Calcium/calmodulin-dependent protein kinase II alpha | Exon14 | Skipping |
| Cttn | Cortactin | Exon11 | Skipping |
| Deaf1 | Deformed epidermal autoregulatory factor 1 | Exon2 | Skipping |
| Erc2 | ELKS/RAB6-interacting/CAST family member 2 | Exon12 | Skipping |
| Kcnip1 | Kv channel-interacting protein 1 | Exon2 | Skipping |
| Ncor1 | Nuclear receptor corepressor 1 | Exon9 | Skipping |
| Anks1b | Ankyrin repeat and sterile alpha motif domain containing 1B | Exon7 | Inclusion |
Fig. 3.

The validation of representative altered splicing events in TDP-43-silenced primary cortical neurons and FUS-silenced primary cortical neurons. Eight exons with differential expression in both TDP-43-silenced neurons and FUS-silenced neurons were validated by semiquantitative RT-PCR. The top panel provides a schematic of splicing changes mediated by TDP-43 and/or FUS. The second and third panels display representative RT-PCR results for the indicated exons and the densitometric quantification (ratio of inclusion to exclusion) of these results (n = 3; mean and SD) after either TDP-43 or FUS depletion. *p < 0.05 by t-test. Statistics were done by one-way ANOVA and Tukey test. * (p < 0.05), ** (p < 0.01), and *** (p < 0.001) denote significant differences.
4. Discussion
Both TDP-43 and FUS are involved in multiple levels of RNA processing, and mutations in these two genes are responsible for familial ALS and FTLD. Although TDP-43 and FUS pathologies appear to largely be mutually exclusive, the molecular and functional similarities between these two molecules suggest that TDP-43 and FUS may share a common downstream pathway leading to neuronal degeneration [29,30].
Genes with altered expression levels or alternatively spliced exons in both TDP-43- and FUS-silenced primary neurons have fundamental functions in neurons, suggesting that transcriptome changes produced by loss-of-function mutations of TDP-43 and/or FUS may lead to neuronal cell death. This conjecture is supported by cross-rescue findings from fish and fly models in which FUS overexpression rescued the defect phenotype caused by TDP-43 knockout [20,21].
How do TDP-43 and FUS regulate common downstream genes and exons? These proteins do not appear to share the same binding target RNAs in neuronal tissue; in particular, it has been reported that the consensus sequences of TDP-43 are (UG) repeats [31,32], whereas FUS has a widespread RNA binding pattern [26,33]. Research has indicated that these two RNA binding proteins may target distinct sets of cytoplasmic mRNA molecules in NSC-34 cells [34]. Although we found that there was an overlap of approximately 10% between genes with altered splicing after shFUS treatment and genes with altered splicing after shTDP-43 treatment, the regulation mechanism of common alternative splicing events remains unclear.
Our results indicated that 25% of genes with altered gene expression levels and 10% of genes with alternatively spliced exons were common to the transcriptome profiles of both TDP-43-silenced primary cortical neurons and FUS-silenced primary cortical neurons. These findings were comparable to the results reported by Lagier-Tourenne et al., which demonstrated that in adult mouse striatum, there was an overlap of more than 10% between alternative splicing events observed due to TDP-43 knockdown and alternative splicing events observed due to FUS knockdown [35]. Discrepancies between this prior study and the current investigation with respect to targeted RNAs could reflect the different cell types used in these studies; we specifically assessed neurons, whereas the mouse striatum contains a variety of cells, including neurons, glial cells, and other cell types. In fact, in a recent study, we found distinct FUS-regulated transcriptomes among different cell lineages [24].
Among the target RNA molecules that we identified, Stx1A is one of the most differentially upregulated genes in both TDP-43-silenced neurons and FUS-silenced neurons (Table 2). Stx1A encodes Syntaxin 1A, which is a member of the syntaxin super family that is associated with the vesicle fusion process as a component of the SNARE complex [36]. The overexpression of Stx1A disturbed synaptic vesicle exocytosis in hippocampal neurons [37], suggesting that up-regulation of Stx1A by silencing TDP-43 or FUS may produce synaptic dysfunction. Tgfbr1 is one of the most significantly downregulated genes in both TDP-43-silenced neurons and FUS-silenced neurons (Table 2). Tgfbr1 encodes transforming growth factor (TGF)-β receptor I, which binds to TGF-β and transduces TGF-β signals from the cell surface to the cytoplasm. TGF-β signaling was disrupted in the motor neurons of mouse models of ALS and spinal and bulbar muscular atrophy (SBMA) [38,39]. This finding, in combination with our results, suggests that the TGF-β signaling pathway may be a strong candidate for targeted molecular therapy for motor neuron degeneration.
In addition, exon 14 of the Camk2a gene, which encodes the calcium/calmodulin-dependent protein kinase type II α chain, was skipped in both TDP-43-silenced primary neurons and FUS-silenced primary neurons. Camk2a is a critical player in calmodulin-dependent activity, long-term potentiation (LTP), and learning [40]. The expression of Camk2a has been reported to be decreased in Alzheimer's patients [41]. Clarifying the role of exon 14 of Camk2a in the function of this protein might link the calmodulin-dependent pathway to TDP-43- and FUS-associated FTLD. Despite the discovery of considerable evidence linking alternative splicing and various diseases, including neurodegeneration, it remains unclear how much alternative splicing is “noise” and how much of this splicing truly contributes to cell fate [42]. Further verification of whether these altered splicing events have pathogenic roles is required.
In this study, we determined that TDP-43-silenced neurons and FUS-silenced neurons exhibited greater overlap in shared gene expression alterations than in altered splicing events. In addition, a considerable number of GO terms from gene expression data were common to both types of neurons, whereas distinct GO terms were obtained from alternative splicing events in the two types of neurons. These results suggest that TDP-43 and FUS do not share many splicing targets but instead may associate with each other during mRNA maturation and/or transportation, resulting in altered gene expression. Another possibility is that TDP-43 and FUS may share common molecular pathways that lead to neuronal cell death after multiple transcriptome disturbances.
In summary, the comparative analysis of the transcriptome profiles in primary cortical neurons revealed common downstream RNA targets of TDP-43 and FUS. These targets may be linked to a common pathway in the neurodegenerative processes of ALS/FTLD.
Acknowledgments
Part of this study represents the results of the “Integrated Research on Neuropsychiatric Disorders” project, which has been conducted under the Strategic Research Program for Brain Sciences of the Ministry of Education, Culture, Sports, Science and Technology of Japan. This work was also supported by grants-in-aid from the CREST/JST, MEXT, and MHLW of Japan.
Footnotes
This is an open-access article distributed under the terms of the Creative Commons Attribution-NonCommercial-No Derivative Works License, which permits non-commercial use, distribution, and reproduction in any medium, provided the original author and source are credited.
Contributor Information
Shinsuke Ishigaki, Email: ishigaki-ns@umin.net.
Gen Sobue, Email: sobueg@med.nagoya-u.ac.jp.
Supplementary material
Supplementary material associated with this article can be found, in the online version, at doi:10.1016/j.fob.2013.11.001.
Appendix. Supplementary materials
Supplementary materials for The ALS/FTLD-related RNA-binding proteins TDP-43 and FUS have common downstream RNA targets in cortical neurons.
References
- 1.Rothstein J.D. Current hypotheses for the underlying biology of amyotrophic lateral sclerosis. Ann. Neurol. 2009;65(Suppl. 1):S3–S9. doi: 10.1002/ana.21543. [DOI] [PubMed] [Google Scholar]
- 2.Al-Chalabi A., Jones A., Troakes C., King A., Al-Sarraj S., van den Berg L.H. The genetics and neuropathology of amyotrophic lateral sclerosis. Acta Neuropathol. 2012;124:339–352. doi: 10.1007/s00401-012-1022-4. [DOI] [PubMed] [Google Scholar]
- 3.Baloh R.H. How do the RNA-binding proteins TDP-43 and FUS relate to amyotrophic lateral sclerosis and frontotemporal degeneration, and to each other? Curr. Opin. Neurol. 2012;25:701–707. doi: 10.1097/WCO.0b013e32835a269b. [DOI] [PubMed] [Google Scholar]
- 4.Arai T. TDP-43 is a component of ubiquitin-positive tau-negative inclusions in frontotemporal lobar degeneration and amyotrophic lateral sclerosis. Biochem. Biophys. Res. Commun. 2006;351:602–611. doi: 10.1016/j.bbrc.2006.10.093. [DOI] [PubMed] [Google Scholar]
- 5.Neumann M. Ubiquitinated TDP-43 in frontotemporal lobar degeneration and amyotrophic lateral sclerosis. Science. 2006;314:130–133. doi: 10.1126/science.1134108. [DOI] [PubMed] [Google Scholar]
- 6.Gitcho M.A. TDP-43 A315T mutation in familial motor neuron disease. Ann. Neurol. 2008;63:535–538. doi: 10.1002/ana.21344. [DOI] [PMC free article] [PubMed] [Google Scholar]
- 7.Sreedharan J. TDP-43 mutations in familial and sporadic amyotrophic lateral sclerosis. Science. 2008;319:1668–1672. doi: 10.1126/science.1154584. [DOI] [PMC free article] [PubMed] [Google Scholar]
- 8.Kabashi E. TARDBP mutations in individuals with sporadic and familial amyotrophic lateral sclerosis. Nat. Genet. 2008;40:572–574. doi: 10.1038/ng.132. [DOI] [PubMed] [Google Scholar]
- 9.Yokoseki A. TDP-43 mutation in familial amyotrophic lateral sclerosis. Ann. Neurol. 2008;63:538–542. doi: 10.1002/ana.21392. [DOI] [PubMed] [Google Scholar]
- 10.Kwiatkowski T.J., Jr. Mutations in the FUS/TLS gene on chromosome 16 cause familial amyotrophic lateral sclerosis. Science. 2009;323:1205–1208. doi: 10.1126/science.1166066. [DOI] [PubMed] [Google Scholar]
- 11.Vance C. Mutations in FUS, an RNA processing protein, cause familial amyotrophic lateral sclerosis type 6. Science. 2009;323:1208–1211. doi: 10.1126/science.1165942. [DOI] [PMC free article] [PubMed] [Google Scholar]
- 12.Buratti E., Baralle F.E. TDP-43: gumming up neurons through protein–protein and protein–RNA interactions. Trends Biochem. Sci. 2012;37:237–247. doi: 10.1016/j.tibs.2012.03.003. [DOI] [PubMed] [Google Scholar]
- 13.Lagier-Tourenne C., Cleveland D.W. Rethinking ALS: the FUS about TDP-43. Cell. 2009;136:1001–1004. doi: 10.1016/j.cell.2009.03.006. [DOI] [PMC free article] [PubMed] [Google Scholar]
- 14.Strong M.J., Volkening K. TDP-43 and FUS/TLS: sending a complex message about messenger RNA in amyotrophic lateral sclerosis? FEBS J. 2011;278:3569–3577. doi: 10.1111/j.1742-4658.2011.08277.x. [DOI] [PubMed] [Google Scholar]
- 15.Davidson Y., Kelley T., Mackenzie I.R., Pickering-Brown S., Du Plessis D., Neary D., Snowden J.S., Mann D.M. Ubiquitinated pathological lesions in frontotemporal lobar degeneration contain the TAR DNA-binding protein, TDP-43. Acta Neuropathol. 2007;113:521–533. doi: 10.1007/s00401-006-0189-y. [DOI] [PubMed] [Google Scholar]
- 16.Neumann M., Rademakers R., Roeber S., Baker M., Kretzschmar H.A., Mackenzie I.R. A new subtype of frontotemporal lobar degeneration with FUS pathology. Brain. 2009;132:2922–2931. doi: 10.1093/brain/awp214. [DOI] [PMC free article] [PubMed] [Google Scholar]
- 17.Wegorzewska I., Bell S., Cairns N.J., Miller T.M., Baloh R.H. TDP-43 mutant transgenic mice develop features of ALS and frontotemporal lobar degeneration. Proc. Natl. Acad. Sci. USA. 2009;106:18809–18814. doi: 10.1073/pnas.0908767106. [DOI] [PMC free article] [PubMed] [Google Scholar]
- 18.Igaz L.M. Dysregulation of the ALS-associated gene TDP-43 leads to neuronal death and degeneration in mice. J. Clin. Invest. 2011;121:726–738. doi: 10.1172/JCI44867. [DOI] [PMC free article] [PubMed] [Google Scholar]
- 19.Iguchi Y. Loss of TDP-43 causes age-dependent progressive motor neuron degeneration. Brain. 2013;136:1371–1382. doi: 10.1093/brain/awt029. [DOI] [PubMed] [Google Scholar]
- 20.Kabashi E., Bercier V., Lissouba A., Liao M., Brustein E., Rouleau G.A., Drapeau P. FUS and TARDBP but not SOD1 interact in genetic models of amyotrophic lateral sclerosis. PLoS Genet. 2011;7:e1002214. doi: 10.1371/journal.pgen.1002214. [DOI] [PMC free article] [PubMed] [Google Scholar]
- 21.Wang J.W., Brent J.R., Tomlinson A., Shneider N.A., McCabe B.D. The ALS-associated proteins FUS and TDP-43 function together to affect Drosophila locomotion and life span. J. Clin. Invest. 2011;121:4118–4126. doi: 10.1172/JCI57883. [DOI] [PMC free article] [PubMed] [Google Scholar]
- 22.Wu L.S., Cheng W.C., Shen C.K. Targeted depletion of TDP-43 expression in the spinal cord motor neurons leads to the development of amyotrophic lateral sclerosis-like phenotypes in mice. J. Biol. Chem. 2012;287:27335–27344. doi: 10.1074/jbc.M112.359000. [DOI] [PMC free article] [PubMed] [Google Scholar]
- 23.Vanden Broeck L. TDP-43 loss-of-function causes neuronal loss due to defective steroid receptor-mediated gene program switching in Drosophila. Cell Rep. 2013;3:160–172. doi: 10.1016/j.celrep.2012.12.014. [DOI] [PubMed] [Google Scholar]
- 24.Fujioka Y. FUS-regulated region- and cell-type-specific transcriptome is associated with cell selectivity in ALS/FTLD. Sci. Rep. 2013;3:2388. doi: 10.1038/srep02388. [DOI] [PMC free article] [PubMed] [Google Scholar]
- 25.Campeau E. A versatile viral system for expression and depletion of proteins in mammalian cells. PLoS One. 2009;4:e6529. doi: 10.1371/journal.pone.0006529. [DOI] [PMC free article] [PubMed] [Google Scholar]
- 26.Ishigaki S. Position-dependent FUS-RNA interactions regulate alternative splicing events and transcriptions. Sci. Rep. 2012;2:529. doi: 10.1038/srep00529. [DOI] [PMC free article] [PubMed] [Google Scholar]
- 27.Huang da W., Sherman B.T., Lempicki R.A. Systematic and integrative analysis of large gene lists using DAVID bioinformatics resources. Nat. Protoc. 2009;4:44–57. doi: 10.1038/nprot.2008.211. [DOI] [PubMed] [Google Scholar]
- 28.Dennis G., Jr., Sherman B.T., Hosack D.A., Yang J., Gao W., Lane H.C., Lempicki R.A. DAVID: Database for Annotation, Visualization, and Integrated Discovery. Genome Biol. 2003;4:P3. [PubMed] [Google Scholar]
- 29.Van Langenhove T., van der Zee J., Van Broeckhoven C. The molecular basis of the frontotemporal lobar degeneration-amyotrophic lateral sclerosis spectrum. Ann. Med. 2012;44:817–828. doi: 10.3109/07853890.2012.665471. [DOI] [PMC free article] [PubMed] [Google Scholar]
- 30.Polymenidou M., Lagier-Tourenne C., Hutt K.R., Bennett C.F., Cleveland D.W., Yeo G.W. Misregulated RNA processing in amyotrophic lateral sclerosis. Brain Res. 2012;1462:3–15. doi: 10.1016/j.brainres.2012.02.059. [DOI] [PMC free article] [PubMed] [Google Scholar]
- 31.Polymenidou M. Long pre-mRNA depletion and RNA missplicing contribute to neuronal vulnerability from loss of TDP-43. Nat. Neurosci. 2011;14:459–468. doi: 10.1038/nn.2779. [DOI] [PMC free article] [PubMed] [Google Scholar]
- 32.Sephton C.F. Identification of neuronal RNA targets of TDP-43-containing ribonucleoprotein complexes. J. Biol. Chem. 2011;286:1204–1215. doi: 10.1074/jbc.M110.190884. [DOI] [PMC free article] [PubMed] [Google Scholar]
- 33.Rogelj B. Widespread binding of FUS along nascent RNA regulates alternative splicing in the brain. Sci. Rep. 2012;2:603. doi: 10.1038/srep00603. [DOI] [PMC free article] [PubMed] [Google Scholar]
- 34.Colombrita C., Onesto E., Megiorni F., Pizzuti A., Baralle F.E., Buratti E., Silani V., Ratti A. TDP-43 and FUS RNA-binding proteins bind distinct sets of cytoplasmic messenger RNAs and differently regulate their post-transcriptional fate in motoneuron-like cells. J. Biol. Chem. 2012;287:15635–15647. doi: 10.1074/jbc.M111.333450. [DOI] [PMC free article] [PubMed] [Google Scholar]
- 35.Lagier-Tourenne C. Divergent roles of ALS-linked proteins FUS/TLS and TDP-43 intersect in processing long pre-mRNAs. Nat. Neurosci. 2012;15:1488–1497. doi: 10.1038/nn.3230. [DOI] [PMC free article] [PubMed] [Google Scholar]
- 36.Sorensen J.B. SNARE complexes prepare for membrane fusion. Trends Neurosci. 2005;28:453–455. doi: 10.1016/j.tins.2005.06.007. [DOI] [PubMed] [Google Scholar]
- 37.Mitchell S.J., Ryan T.A. Munc18-dependent regulation of synaptic vesicle exocytosis by syntaxin-1A in hippocampal neurons. Neuropharmacology. 2005;48:372–380. doi: 10.1016/j.neuropharm.2004.10.017. [DOI] [PubMed] [Google Scholar]
- 38.Nakamura M., Ito H., Wate R., Nakano S., Hirano A., Kusaka H. Phosphorylated Smad2/3 immunoreactivity in sporadic and familial amyotrophic lateral sclerosis and its mouse model. Acta Neuropathol. 2008;115:327–334. doi: 10.1007/s00401-007-0337-z. [DOI] [PubMed] [Google Scholar]
- 39.Katsuno M. Disrupted transforming growth factor-beta signaling in spinal and bulbar muscular atrophy. J. Neurosci. 2010;30:5702–5712. doi: 10.1523/JNEUROSCI.0388-10.2010. [DOI] [PMC free article] [PubMed] [Google Scholar]
- 40.Giese K.P., Fedorov N.B., Filipkowski R.K., Silva A.J. Autophosphorylation at Thr286 of the alpha calcium–calmodulin kinase II in LTP and learning. Science. 1998;279:870–873. doi: 10.1126/science.279.5352.870. [DOI] [PubMed] [Google Scholar]
- 41.Wang Y.J., Chen G.H., Hu X.Y., Lu Y.P., Zhou J.N., Liu R.Y. The expression of calcium/calmodulin-dependent protein kinase II-alpha in the hippocampus of patients with Alzheimer's disease and its links with AD-related pathology. Brain Res. 2005;1031:101–108. doi: 10.1016/j.brainres.2004.10.061. [DOI] [PubMed] [Google Scholar]
- 42.Kornblihtt A.R., Schor I.E., Allo M., Dujardin G., Petrillo E., Munoz M.J. Alternative splicing: a pivotal step between eukaryotic transcription and translation. Nat. Rev. Mol. Cell Biol. 2013;14:153–165. doi: 10.1038/nrm3525. [DOI] [PubMed] [Google Scholar]
Associated Data
This section collects any data citations, data availability statements, or supplementary materials included in this article.
Supplementary Materials
Supplementary materials for The ALS/FTLD-related RNA-binding proteins TDP-43 and FUS have common downstream RNA targets in cortical neurons.