

Abstract
Obesity is a major public health concern, and complementary research strategies have been directed toward the identification of the underlying causative gene mutations that affect the normal pathways and networks that regulate energy balance. Here, we describe an autosomal-recessive morbid-obesity syndrome and identify the disease-causing gene defect. The average body mass index of affected family members was 48.7 (range = 36.7–61.0), and all had features of the metabolic syndrome. Homozygosity mapping localized the disease locus to a region in 3q29; we designated this region the morbid obesity 1 (MO1) locus. Sequence analysis identified a homozygous nonsense mutation in CEP19, the gene encoding the ciliary protein CEP19, in all affected family members. CEP19 is highly conserved in vertebrates and invertebrates, is expressed in multiple tissues, and localizes to the centrosome and primary cilia. Homozygous Cep19-knockout mice were morbidly obese, hyperphagic, glucose intolerant, and insulin resistant. Thus, loss of the ciliary protein CEP19 in humans and mice causes morbid obesity and defines a target for investigating the molecular pathogenesis of this disease and potential treatments for obesity and malnutrition.
Introduction
Obesity is a major risk factor for type II diabetes mellitus (T2DM), heart disease, hypertension, metabolic syndrome, and cancer, and it has become increasingly prevalent in Western society and in developing countries.1 Worldwide, more than 1.1 billion individuals are overweight and more than 300 million are obese,2 as assessed by body mass index (BMI). Individuals with a BMI ≥ 30 kg/m2 are considered obese, whereas those with a BMI > 40 are morbidly obese. The importance of genetic factors in human obesity have been clearly defined by numerous twin, familial-aggregation, and adoption studies.3–6 Indeed, heritability has been estimated to be as high as 40%–90%.7 Given this relationship, a number of genetic approaches have been used in the search for the genes and pathways affecting BMI.8 Genome-wide association studies (GWASs), using either population-based cohorts or case-control designs, have identified numerous candidate-gene loci; however, most loci have only modest effects. What has become readily apparent is that biologically plausible candidate genes within these regions are not always intuitively obvious and thus might go undetected.
In contrast, targeted molecular analysis of Mendelian obesity disorders has provided unambiguous identification of causative gene mutations, providing insights into the pathogenetic mechanisms underlying obesity.9 Here, we describe a consanguineous multigenerational Israeli Arab family affected by autosomal-recessive morbid obesity, which we have designated “MO1 syndrome.” Linkage analysis and positional gene cloning identified a truncating mutation in a highly evolutionarily conserved gene within the MO1 locus; this gene, CEP19, was recently found to encode CEP19, a ciliary protein.10 Targeted knockout (KO) of Cep19 resulted in markedly obese mice exhibiting hyperphagia, decreased energy expenditure, impaired whole-body fat oxidation, altered hepatic insulin signaling, and impaired glucose and insulin tolerance.
Material and Methods
Study Subjects
This study investigated members of a multigenerational Arab clan living in the same village in the north of Israel. After informed consent was obtained and approval was received from the ethics committees of the corresponding institutions, blood samples were drawn from 13 affected and 31 unaffected family members. Clinical diagnoses were provided by the referring physicians.
DNA Sequence Analysis
PCR was used to amplify exons with Amplitaq-Gold (Applied Biosystems). Amplicons were purified with the QIAquick Spin PCR Purification Kit (QIAGEN), and they were directly sequenced on an ABI Prism 3700 automated DNA Analyzer (Applied Biosystems). Data were analyzed with the program Sequencher v.3.0 (Gene Codes Corporation).
Generation of Chimeric and KO Mice
C57BL/6J Cep19 Chimeras
Homologous recombination was performed by electroporation of 40 ug of the linearized targeting plasmid into 5 × 10⁶ 129Sv/Pas embryonic stem (ES) cells at 240V and 500 μF. In brief, neoselection was performed with 200 ug/ml G418 48 hr after electroporation and continued for 8 days. One hundred and ninety neomycin-resistant clones were selected, and DNA was isolated and screened for correctly targeted replacements. Eight positive ES clones were identified by 5′ and 3′ Southern blot and by PCR. Four positive ES cell clones, selected on the basis of growth rate and cell morphology, were injected into C57Bl/6J blastocysts. Blastocysts were then implanted into OF1 pseudopregnant female mice, resulting in a total of 14 chimeric mice. Chimeras were mated with BL/6J mice, and founders were selected by offspring genotyping with a PCR-based assay. For this assay, primers nested within the neomycin cassette and outside of the 3′ end of the targeted locus were used. Germline mutant mice were then mated with wild-type (WT) or heterozygous littermates for further expansion of the colony. The BL/6J line of CEP19 mice was therefore a mixture of C57BL/6J and 129Sv mice. All animal protocols were approved by the respective institutions’ animal care and use committees and were in compliance with National Institutes of Health guidelines.
Generation of C57BL/6NTac Cep19 Chimeras
A second KO vector, incorporating a LacZ expression reporter, was constructed and identified with a PCR-based screen. In brief, 10 μg of the targeting vector was linearized by NotI and then transfected by electroporation of C57BL/6NTac ES cells. After selection with G418 antibiotic, surviving clones were expanded for PCR analysis for the identification of recombinant ES cell clones. Screening primers A1 and A2 were designed downstream of the short homology arm (SA) outside the 3′ region used for generating the targeting construct. PCR reactions using A1 or A2 with the LAN1 primer (located within the neomycin cassette) amplified 2.4 or 2.5 kb fragments, respectively. The control PCR reaction was performed with the internal targeting vector primers AT1 and AT2, which were located at the 3′ and 5′ ends, respectively, of the SA. This amplified a product 1.3 kb in size. Individual clones from positive pooled samples were then screened with the A2 and LAN1 primers. Positive recombinant clones were identified by a 2.5 kb PCR fragment. Next, positive SA PCR clones were sequenced for integration with the OUT1 primer. Confirmation of cassette integration within the long homology arm was performed by PCR using the 3 and UNI primers. The 3 and N7 primers were used for sequencing purified LA PCR DNA for confirming the presence of the cassette junctions.
Metabolic Cages
A comprehensive animal metabolic monitoring system (CLAMS; Columbus Instruments) was used for evaluating activity, food consumption, and energy expenditure. Mice were individually housed for these studies unless otherwise noted below for feeding-related experiments. Data on energy expenditure and food intake were normalized with respect to lean body mass (LBM). Energy expenditure and respiratory quotient (RQ) were calculated from the gas-exchange data. Activity was measured on the x and z axes with the use of infrared beams so that the beam breaks during a specified measurement period could be counted. Feeding was measured as the difference in the scale measurement of the center feeder from one time point to another. Five males and five females were in each group. Animals were housed in cages for a 24 hr period of adaptation prior to initiation of measurements.
Glucose Tolerance Test
Mice were fasted for 6 hr and injected with 1.5 g/kg body weight glucose intraperitoneally (i.p.) at the age of 12 and 17 weeks. Blood glucose was measured at 0, 7.5, 15, 30, 60, 90 and 120 min via tail sampling with the AlphaTrak glucose meter (Abbott Laboratories). A blood sample for fasting insulin levels was taken at time point 0, before glucose was injected (n ≥ 4 per group).
Insulin Tolerance Test
18-week-old mice were fasted for 6 hr and subsequently injected with 1 U/kg body weight regular human insulin (Humulin R, Lilly USA). Blood glucose levels were measured at time points 0, 15, 30, and 60 min (n ≥ 4 per group). A blood sample for fasting insulin levels was taken at time point 0, before insulin was injected.
Insulin ELISA
Insulin levels were determined with Mercodia’s Mouse Insulin ELISA according to the manufacturer’s protocol. Data were analyzed by cubic spline regression with the use of GraphPad Prism (GraphPad Software) (n ≥ 4 per group).
Insulin Signaling Studies
Six-month-old male mice and 1-year-old female mice were used for this study. After an overnight fast, mice were injected i.p. with 100 mU insulin (Humulin R, Lilly USA) diluted in 300 μl of a 5% glucose solution. Control WT mice were injected i.p. with 300 μl saline. After 15 min, animals were sacrificed with CO2; liver was dissected and snap frozen in liquid nitrogen and kept at −80°C for further analysis (n = 2 per group).
Immunoblot Analyses
Liver was homogenized in 20 mM MOPS, 2 mM EGTA, 5 mM EDTA, 30 mM sodium fluoride, 40 mM β-glycerophosphate, 10 mM sodium pyrophosphate, 2 mM sodium orthovanadate, 0.5% NP-40, and complete protease inhibitor cocktail (Roche) and centrifuged at 13,000 g for 20 min at −3°C. The supernatant was then collected, and protein concentration was measured with a BCA Protein Assay Kit (Thermo Scientific). Protein extracts were separated on 4%–12% NuPAGE gels (Invitrogen) and blotted onto Immobilon FL PVDF (Millipore). Membranes were blocked at room temperature for 1 hr in Odyssey Blocking Buffer (LI-COR) 1:1 diluted in TBS and incubated in primary antibodies in 1:1 blocking buffer and TBS-T overnight at 4°C. Primary antibodies against phospho-Akt (Thr308), phospho-insulin receptor β (both from Cell Signaling Technology), Gapdh (Abcam), and insulin receptor β (Santa Cruz Biotechnology) were used. After three consecutive 5 min washes in TBS-T (0.1%), blots were incubated with Dylight-680-conjugated goat anti-rabbit IgG and Dylight-800-conjugated goat anti-mouse IgG (both from Thermo Scientific) for 1 hr at room temperature in blocking buffer containing 0.1% TBS-T and 0.1% SDS. After three washes in TBS-T and a final wash in TBS, the blots were scanned with the Odyssey Imaging System (LI-COR) and quantified with Odyssey 3.0 software on the basis of direct fluorescence measurement.
Lipid Analyses
Plasma samples for lipid analysis were taken after a 6 hr fast at 7 and 16 weeks via retro-orbital plexus sampling. Serum triglycerides (TGs) were measured with kits from Sigma (Sigma Aldrich) according to the manufacturer’s protocol. Nonesterified fatty acid (NEFA) levels were determined with a NEFA kit (Wako Chemicals USA) according to the manufacturer’s protocol.
Statistics
Values are presented as the mean ± SEM. Comparisons between groups were made with unpaired, two-tailed Student’s t tests. Differences were considered statistically significant at p < 0.05.
Results
Clinical Characterization of MO1 Syndrome
Pedigree and clinical information was obtained for all members of a large, consanguineous multigenerational family affected by morbid obesity, T2DM, heart disease, and hypertension (Figure 1A). BMI measurements revealed a bimodal distribution with one peak at 28 kg/m2 and a second peak at 44 kg/m2 (Figure 1A, inset). The BMI nadir was 35, and we divided family members into two groups: (1) “unaffected,” those with BMIs < 35; and (2) “affected,” those with BMIs > 35. The 15 “affected” family members all had normal gestational birth weights but developed childhood obesity by 3 years of age. Detailed clinical data were obtained for all living affected (n = 11) and available unaffected (n = 30) family members (Table 1). Ten of the 11 (91%) affected adults had BMIs > 40, and all fulfilled International Diabetes Foundation criteria consistent with a diagnosis of metabolic syndrome.11 All affected family members were hypertensive (systolic blood pressure > 140 mmHg) and receiving pharmacologic treatments to control their hypertension. By comparison, only 5 of the 30 (17%) unaffected family members had a history of elevated blood pressure. All tested affected individuals had evidence of fatty liver disease by ultrasound. After an overnight fast, lipid profiles, although abnormal for a number of affected individuals, on average did not differ significantly between the two groups. All five females and one male had low high-density lipoprotein (HDL) cholesterol concentrations (female mean = 39.2 mg/dl; recommended level > 50 mg/dl). Four of the 11 (36%) affected individuals had markedly elevated TGs (range = 196–292 mg/dl; recommended < 150), four had increased total cholesterol (range = 209–232 mg/dl; recommended < 200 mg/dl), and two had elevated low-density lipoprotein (135 and 149 mg/dl; recommended < 130 mg/dl). Eight affected individuals (73%) had a TG/HDL ratio > 3. Five of the total 15 affected family members (33%) also had early coronary artery disease and suffered myocardial infarctions prior to 45 years of age. Three of these individuals, all younger than 50 years, died as a result of cardiac disease, and two others had signs and symptoms of congestive heart failure. Three of the 11 affected family members (27%) had T2DM. Of note, and on the basis of an analysis of health records, the prevalence of T2DM among individuals with BMI > 35 from the family’s geographic region was 27.6% (135/435). For the remaining eight affected individuals without T2DM, fasting blood glucose levels were within normal limits. Three of the affected individuals (27%) also had intellectual disability, and all six males had decreased sperm counts: four were oligospermic and two were azospermic.
Figure 1.
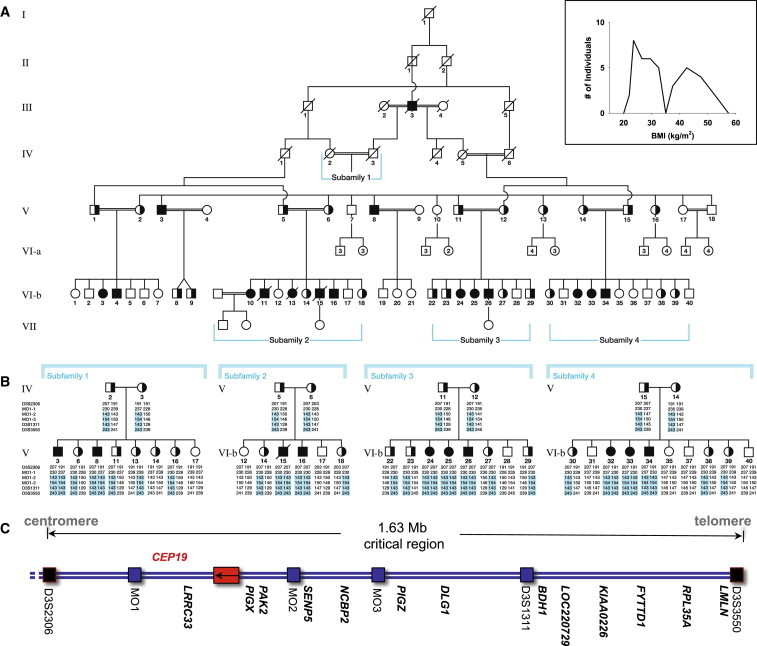
Pedigree of the Family Affected by Morbid Obesity and Localization of the Disease-Associated Gene
(A) Pedigree of the consanguineous Arab family affected by morbid obesity. The inset demonstrates the BMI measurements of the extended family.
(B) Haplotypes of tested members of the nuclear subfamilies 1–4. The originally linked region was further refined to a 1.6 Mb region with the use of additional polymorphic markers MO1 1–3 (Table S3).
(C) A schematic illustration of the physical map includes genes sequenced from the region (not to scale). Black boxes highlight the markers used for defining the critical region, blue boxes indicate additional markers used for further narrowing the region, and the red box represents CEP19. All gene names are shown in bold.
Table 1.
Clinical and Biochemical Characteristics of the Family Affected by Morbid Obesity
| Pedigree ID | Gender (Age in Years) | BMI (kg/m2)a | HTN | FG (70–110)b | TGs (10–150)b | Cholesterol (<200)b | LDL (<100–130)b | HDL (M > 40; F > 50)b | Elevated Liver Enzymes (GGT, GOT, GPT) | Fatty Liver (US) | MetS |
|---|---|---|---|---|---|---|---|---|---|---|---|
| V-3c | M (44) | 44.7 (61.0) | + | 82 | 138 | 209 | 123.5 | 44 | − | + | + |
| V-8c | M (29) | 47.3 (60.0) | + | 128 (IFG) | 95 | 187 | 111.1 | 55 | + | + | + |
| Vlb-3 | F (27) | 34.0 (36.7) | + | 85 | 134 | 209 | 149.1 | 33 | − | + | + |
| Vlb-15c,d | M (36) | 49.6 (52.0) | + | 78 | 145 | 150 | 100 | 40 | ++ | NA | + |
| Vlb-16e,f | M (21) | 34.3 (38.8) | + | 93 | 117 | 149 | 105 | 44 | − | + | + |
| Vlb-24 | F (25) | 50.9 | + | 89 | 96 | 189 | 119 | 49 | − | + | + |
| Vlb-25 | F (24) | 51.4 | + | diabetic | 149 | 198 | 124 | 41 | + | + | + |
| Vlb-26c,f | M (29) | 36.8 (40.4) | + | diabetic | 292 | 232 | 125.5 | 43 | + | + | + |
| Vlb-32 | F (27) | 44.4 (49.6) | + | 89 | 228 | 184 | 102.2 | 34 | − | + | + |
| Vlb-33 | F (24) | 49.2 | + | diabetic | 196 | 210 | 128.4 | 39 | + | + | + |
| Vlb-34e,f | M (31) | 42.2 (45.5) | + | 80 | 225 | 135 | 105.5 | 30 | − | + | + |
Abbreviations are as follows: BMI, body mass index; F, female; FG, fasting glucose; GGT, gamma-glutamyltransferase; GOT, glutamate-oxalacetate transaminase; GPT, glutamate-pyruvate transaminase; HDL, high-density lipoprotein; HTN, hypertension; IFG, impaired fasting glucose; LDL, low-density lipoprotein; M, male; MetS, metabolic syndrome;11 NA, not available; and TGs, triglycerides.
The most recent BMI values are shown, and maximal BMI values are indicated in parentheses.
All tested biochemical parameters are in mg/dl, and normal values are provided in parentheses.
V-3, V-8, Vlb-15, and Vlb-26 were oligospermic but fertile.
Vlb-15 died as a result of complicated congestive heart failure and dilated cardiomyopathy.
Vlb-16 and Vlb-34 were azospermic.
Vlb-16, Vlb-26, and Vlb-34 had intellectual disabilities.
To further characterize the clinical phenotype, we compared the metabolic profile of affected family members to that of an unrelated group of age- and sex-matched obese and lean individuals from the same geographic region. Although a number of differences were identified between both obese populations and lean individuals, no statistically significant differences in these metabolic values were noted between the familial and nonfamilial affected individuals (Table S1, available online). Compared to age- and sex-matched lean individuals, both obese groups had normal concentrations of fasting plasma glucose and nonsignificant increases in concentrations of fasting plasma insulin. However, the homeostasis model assessment of estimated insulin resistance, a surrogate marker for insulin resistance, was significantly and similarly elevated in both obese groups. On average, concentrations of fasting plasma free fatty acids in the obese family members were nearly twice those of the lean individuals (609 ± 50 uM versus 339 ± 25 uM; p < 0.0003) but did not differ from those of nonfamilial obese subjects (510 ± 49 uM; p < 0.25). Given their association with the pathogenesis of insulin resistance and associated metabolic complications, including hypertension and coronary heart disease, the levels of a number of adipocytokines were profiled. Plasma leptin concentrations were equally higher in both obese groups than in the lean individuals (p < 0.02). Interestingly, levels of the proinflammatory cytokine TNFα were lower in the familial affected individuals than in the nonfamilial obese population (p < 0.03).
Linkage Analysis and Positional Cloning of the MO1 Locus Gene CEP19
Positional cloning by homozygosity by descent was used for identifying the causative gene mutation for the obesity syndrome. Initially, 514 microsatellite markers spanning the genome (Human Screening Panel, version 9.0, Research Genetics) were analyzed, which localized the disease gene locus to chromosomal region 3q29. Additional markers refined the critical region within a 5.5 Mb locus between markers D3S2418 and D3S3550 on the telomeric end of 3q29 (LOD score = 9.7, Θ = 0). Heterozygosity and haplotype analysis further narrowed the initial region to a 1.6 Mb critical region between centromeric marker D3S2306 and telomeric marker D3S3550 (Figures 1B and 1C).
All 23 known and predicted genes in the critical region (UCSC Genome Browser, hg19), including 5′ and 3′ UTRs and exon-intron boundaries, were analyzed by Sanger sequencing. No homozygous mutations segregating appropriately within the family were identified for 22 of these genes. However, all affected individuals had a homoallelic nonsense mutation, a C>T transition (c.244C>T) in codon 82 of exon 2 of the EST sequence BC007827 and CEP19. The genomic position of the mutation is chr3: 196,434,703. This hypothetical gene is predicted to encode a 167 amino acid protein with a predicted molecular weight of 19.6 kD. The homozygous nonsense alteration (p.Arg82∗) is predicted to cause premature truncation of the terminal carboxy half of the protein (Figure 2). All parents of the affected individuals were heterozygous, and unaffected siblings were either heterozygous for the mutation or noncarriers (Figure S1). The mutation was not present in dbSNP (build 137) or in 1,240 chromosomes we screened from 620 unaffected, lean and/or nonobese individuals (data not shown). These included more than 200 ethnically matched unaffected individuals. Of potential interest, interrogation of the 1000 Genomes Project database resulted in the identification of six nonsynonymous exonic variants present at frequencies between 0.1% and 0.2%. The functional role, if any, of these additional variants is currently unknown.
Figure 2.
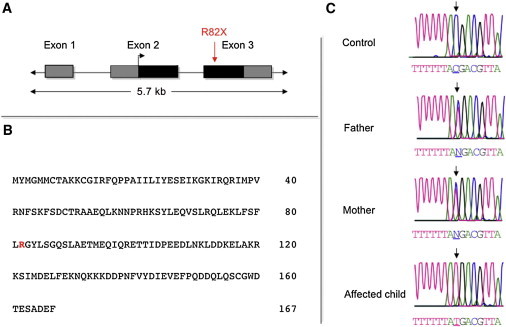
Identification of the Disease Gene Mutation
(A) The gene structure of CEP19 indicates the location of the nonsense mutation. Coding regions are shaded in black, and UTRs are in gray.
(B) Predicted CEP19 amino acid sequence based on its longest open reading frame.
(C) Sequencing electropherograms showing the WT, heterozygous, and mutant C>T transition (↓), which predicts a nonsense mutation in codon 82.
The full-length CEP19 transcript was readily amplified from total RNA isolated from 21 human tissues, including heart, liver, skeletal muscle, brain, hypothalamus, and adipose tissue (Figure S2A). It was also expressed in various human-derived cell lines, including hepatoma-derived (Hep3B and Huh7) and human embryonic kidney 293 cell lines (data not shown). In addition, the transcript was differentially expressed in murine 3T3L1 preadipocytes such that increased levels coincided with the onset of lipogenesis after their treatment with a mixture of adipogenic hormones known to stimulate terminal differentiation into adipoctyes12 (Figure S2B).
To assess the stabilities of the WT and truncated p.Arg82∗ proteins, we subcloned WT and mutated constructs into a eukaryotic expression vector containing a carboxy-terminal V5 tag and then transfected them into various cell lines. Both constructs achieved high levels of RNA expression. WT protein was always expressed at higher levels, as demonstrated by immunoblotting at 24 and 48 hr posttransfection (Figure S3A). These findings indicate that the truncated form was unstable and presumably degraded through the proteasome pathway. When cells transfected with WT or p.Arg82∗ protein were treated with the potent proteasome inhibitor MG132, both constructs were present at high levels (Figure S3B).
Recently, complementary shotgun proteomic and microscopic approaches were used for identifying novel components of the centriole.10 One of the candidate proteins identified in this screen was C3orf34, designated by the authors as CEP19. GFP-tagged CEP19 was shown to be preferentially associated with the mother centriole in the centrosome. (Adopting the HGNC change from C3orf34, we now refer to the gene mutated in the MO1 locus as CEP19.) To confirm and further explore this finding, we first expressed V5-tagged CEP19 in the hTERT-immortalized retinal pigment epithelial cell line RPE1-hTERT, which can be induced to form primary cilia. As shown in Figures 3A and 3B, ectopically expressed and tagged CEP19 was localized to the mother centriole and basal body. When we repeated these experiments by using an antibody directed against the endogenous CEP19 in RPE1-hTERT cells, which were stably transfected with a single small interfering RNA expressed from a retroviral vector against either CEP19 or luciferase, the endogenous CEP19 was localized to the basal body of the primary cilia (Figure 3C).
Figure 3.
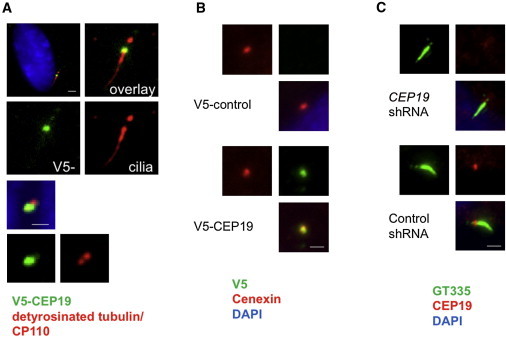
CEP19 Is a Centrosomal Protein Localizing to the Mother Centriole and Basal Body
Ectopic expression of V5-tagged WT CEP19 (V5-CEP19; green) in RPE1-hTERT cells shows subcellular localization at the basal body, as determined by detyrosinated tubulin as a marker for cilia (red, upper panel of A). In nonciliated cells, V5-CEP19 colocalized with one of the two CP110 dots (red, lower panel of A) and Cenexin (red, B), suggesting that CEP19 is expressed at the mother centriole in growing cells. With the use of polyglutamylated tubulin, GT335 (green) as a ciliary marker, endogenous CEP19 was specifically localized at the basal body in quiescent RPE1-hTERT cells (lower panel of C), as determined by loss of signal via knockdown mediated by small hairpin RNA (shRNA; upper panel of C). Scale bars represent 1 μm.
CEP19 Is Highly Conserved in Evolution
CEP19 orthologs, all annotated as hypothetical genes, were readily identified across mammalian, amphibian, avian, and fish species with the use of BLAST searches (Figure S4). In addition to being present in the vertebrates, CEP19 orthologs were also in some early invertebrates, including the starlet sea anemone (34% sequence identity, 56% sequence similarity), a member of the oldest eumetazoan phylum,13 and Trichoplax adhaerens (31% identity, 50% similarity), believed to be the simplest known animal.14 No CEP19 orthologs of approximately the same size were identified through searches of the Drosophila, yeast, or C. elegans databases.
Targeted Deletion of Cep19 in Mice Results in an Obesity Phenotype
We generated KO mice to directly test the hypothesis that loss of the highly conserved CEP19 would result in obesity (Figure 4A). Two independent null mouse C57BL/6 substrains, 6J and 6NTac, were generated and characterized (Figure S5). The heterozygous mice of both strains were fertile, and littermate breeding resulted in a normal distribution of male and female offspring with the expected F1 Mendelian genotype ratios (C57BL/6J: 83 WT, 189 heterozygote, and 96 KO; C57BL/6NTac: 53 WT, 93 heterozygote, and 52 KO). In the C57BL/6J strain, sex-matched mice had similar birth weights, but differences were first apparent between KO and WT males starting at ∼8 and 13 weeks of age for males and females, respectively (Figure 4B). In the C57BL/6NTac KO and WT mice, differences in weight were present by 5 weeks of age for both males and females (Figure 4C). In both strains, when measured at their greatest differences, both male and female KO mice were nearly twice the weight of their age- and sex-matched controls. Total body-fat mass and percentages, determined by MRI, were ∼2-fold greater in Cep19-KO mice than in WT animals (24.4% ± 3.9% and 11.9% ± 1.8%, respectively, n = 10, p = 0.002) (Figure S6). In addition, both Cep19-KO male mice strains were ∼10% longer than their WT sex-matched controls, and KO females were ∼5% longer than WT females (Table S4).
Figure 4.
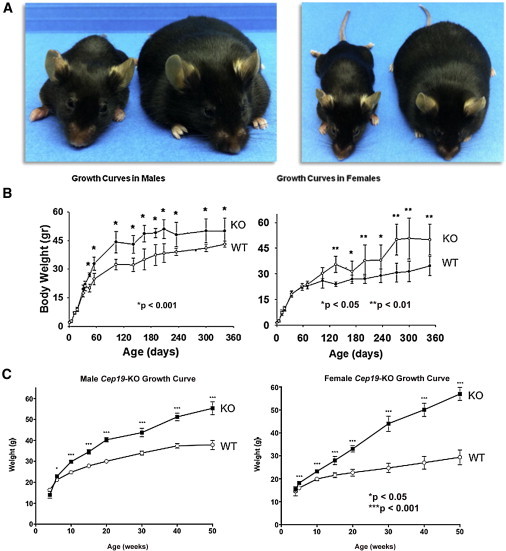
Cep19-KO Mice Are Obese
The murine Cep19 is composed of four exons, and the predicted open reading frame, encoding a 163 amino acid protein, begins in exon 3 and ends with a stop codon in exon 4. Because Cep19 exon 1 is nearly contiguous with the inversely oriented first exon of phosphatidylinositol glycan anchor biosynthesis, class X (Pigx), the KO strategy for both lines involved germline removal of Cep19 exon 3 to avoid disruption of Pigx. Gene expression analysis in two different tissues by two different methods, quantitative RT-PCR and Affymetrix array (data not shown), of the three genes directly flanking Cep19—Pigx, Pak2, and Lrrc33—confirmed that there were no appreciable differences in RNA expression of these genes between WT and KO mice.
(A) Two different views of the same representative WT (left; 22.6 g) and Cep19-KO (right; 57.0 g) females at 36 weeks of age (C57BL/6NTac strain). Weight gain occurred starting at postnatal day 1 (P1). Mice were weaned and separated (five animals per cage) according to their genotype and sex at P30. Mice were provided with normal chow and water ad libitum and weighed for ∼360 days.
(B and C) Growth curves, separated by sex, of C57BL/6J (B) and C57BL/6NTac (C) lines. All graphs show the mean ± SEM calculated from at least three independent experiments.
The C57BL/6J mice were phenotyped in metabolic cages. The KO mice were hyperphagic, as suggested by the fact that food consumption was significantly higher in both male and female KO mice than in their control littermates (Figure S7A). When normalized to LBM, food consumption was similar between Cep19-KO and WT mice (Figure S7B). LBM was examined by MRI performed at 5 months of age and was significantly increased in both Cep19-KO male and female mice. The LBM of male KO mice was on average 25.94 g, 63.9% of their total body weight (TBW); in contrast, the LBM of WT mice was 22.24 g, 73.2% of their TBW (t test, p < 0.003). The LBM of female KO mice averaged 21.2 g, 69% of their TBW; the LBM of WT mice was 17.79 g, 77.9% of their TBW (p < 0.00002; Table S2). Although whole-body oxygen consumption in Cep19-KO mice was lower than that in WT animals, the relationship between oxygen-consumption rate and LBM followed the same regression line (Figure S8A). Moreover, when the rate of oxygen consumption was adjusted for LBM with ANCOVA, the mouse genotype had no significant effect on the rate of oxygen consumption. Similarly, the rate of heat production in both animal groups was independent of the genotype (Figure S8B). Locomotor activity (fed and fasted) was decreased in Cep19-KO mice (Figure S8C). Finally, and suggestive of differences in whole-body substrate oxidation, the RQ was significantly higher in Cep19-KO mice than in WT mice (0.96 ± 0.01 compared to 0.93 ± 0.01, n = 10, p < 0.05; Figure S8D).
Cep19-KO Mice Exhibit Impaired Glucose and Insulin Tolerance
To evaluate carbohydrate metabolism and insulin action, which are impaired in metabolic syndrome, we performed glucose and insulin tolerance tests in 12- and 18-week-old C57BL/6NTac KO and WT mice (Figures 5A and 5B). Fasting glucose and HOMA (homeostatic model assessment) scores in male KO mice were increased at both ages, consistent with an insulin-resistance phenotype (Figures 5C and 5G). Female Cep19-KO mice revealed a similar trend, although it was less pronounced (Figures 5D and 5H). To assess glucose clearance, we performed an intraperitoneal glucose tolerance test. Male 18-week-old KO mice had a markedly impaired glucose tolerance, which was not yet evident in 12-week-old mice (Figure 5E and Figure S9A). Female KO mice showed significant impairment of glucose tolerance at both time points yet, again, to a lesser degree (Figure 5F and Figure S9B).
Figure 5.
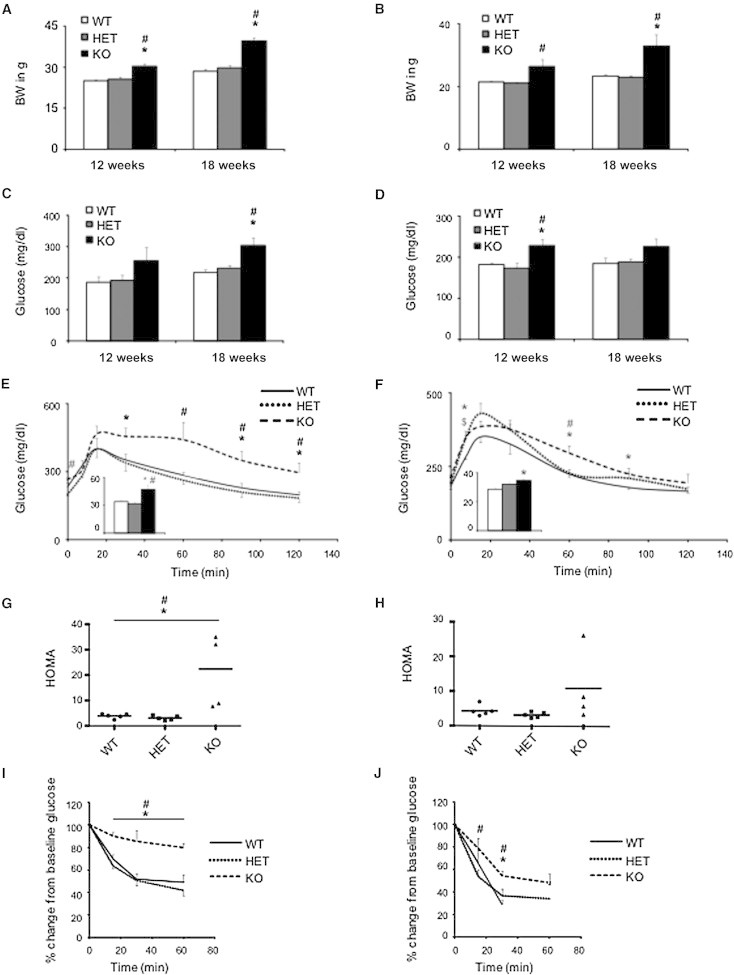
Cep19-KO Mice Are Glucose Intolerant and Insulin Resistant
Body weight at 12 weeks and 18 weeks in male (A) and female (B) mice was increased in Cep19-KO mice. Fasting glucose was assessed at 12 and 18 weeks in male (C) and female (D) mice. Impaired glucose tolerance was observed in 17-week-old male (E) and female (F) Cep19-KO mice. HOMA scores were increased in both male (G) and female (H) 12-week-old Cep19-KO mice exhibiting pronounced insulin resistance. Insulin-tolerance testing resulted in 18-week-old male (I) and female (J) mice. All experiments included four mice per group. ∗p < 0.05, WT versus KO; #p < 0.05, heterozygous (HET) versus KO. All graphs show the mean ± SEM calculated from at least three independent experiments.
Because insulin resistance is associated with dyslipidemia, an important cardiovascular risk factor, the plasma lipid profiles of the KO mice were determined. Male Cep19-KO mice had mildly elevated plasma TG levels at 7 weeks of age, but not at 16 weeks (Figure S9E). Fasting plasma TG levels were significantly elevated in female KO mice at both ages (Figure S9F). No differences were detected in plasma NEFA levels between genotypes in either sex. To probe insulin action in KO mice, we performed intraperitoneal insulin tolerance tests. The ability of insulin to lower glucose was markedly compromised in both male and female KO mice (Figures 5I and 5J), thus confirming the severe insulin-resistance phenotype.
Cep19-KO Mice Have Impaired Hepatic Insulin Signaling
To test whether the observed insulin resistance in C57BL/6NTac Cep19-KO mice was due to compromised insulin signaling, we performed intraportal insulin injections. Insulin receptor β autophosphorylation was significantly impaired in both male and female Cep19-KO mice (Figures 6A and 6B), whereas total insulin receptor expression was not altered (Figure 6A). Further, phosphorylation of protein kinase B (Akt) at Thr308, a downstream insulin signaling mediator, was decreased in KO mice, demonstrating that CEP19 deficiency impairs hepatic insulin signaling in the livers of Cep19-KO mice.
Figure 6.
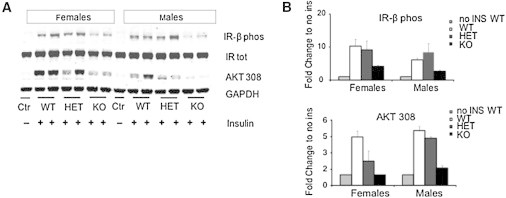
Cep19-Deficient Mice Show Impaired Insulin Signaling in the Liver
(A) Representative immunoblot.
(B) Quantification of the immunoblot analyses (n = 3 per group) of liver samples derived from mice that were sacrificed 15 min after an intraperitoneal injection of insulin. Graphs show the mean ± SEM calculated from at least three independent experiments.
Discussion
Using genomic and biochemical techniques, we have identified the molecular basis of an autosomal-recessive morbid-obesity syndrome, demonstrated to be due to a nonsense mutation in the gene encoding a highly conserved ciliary protein, CEP19. In humans, CEP19 loss of function resulted in a phenotype characterized by morbid obesity, glucose intolerance, dyslipidemia, and insulin resistance. Cep19-KO mice recapitulated this phenotype and permitted the characterization of impaired insulin signaling, which itself plays a central role in the metabolic phenotype. MO1 syndrome, Bardet-Biedl syndrome (MIM 209900), and Alström syndrome (MIM 203800) are the three Mendelian obesity disorders that result from mutations in genes encoding ciliary proteins. MO1 syndrome is unique in that it results in morbid obesity and demonstrates pleiotropy to a lesser extent than the other two ciliopathies. The average BMI for homozygous males and females with the MO1 syndrome was 48.7 kg/m2, which is markedly greater than the mean BMI for affected individuals with either Bardet-Biedl or Alström syndromes (those BMIs range between 30 and 35 kg/m2).15,16 Affected individuals with these two disorders can, however, be morbidly obese; for example, up to 25% of individuals with Bardet-Biedl syndrome have a BMI > 40 kg/m2.17 Affected individuals with MO1 syndrome had primarily metabolic abnormalities, although three individuals (27%) had intellectual disability. In contrast, Bardet-Biedl and Alström syndromes have highly prevalent, non-obesity-associated clinical features, including visual impairment, sensorineural deafness, polydactyly, and renal disease.18,19
The role of ciliary proteins in maintaining a balance between leanness and obesity remains unknown, and thus future studies are required for delineating their pathogenicity in obesity. Moreover, the role of CEP19, whose loss of function results in markedly greater BMI differences and features more restricted to the metabolic phenotype, might provide insights into the obesity phenotype in all three syndromes. Future studies of the Cep19-KO mice should permit such investigations. For example, the availability of mouse embryonic fibroblasts (MEFs) derived from paired Cep19-KO and WT mice permitted the investigation of the effect of CEP19 expression on adipocyte differentiation and lipid accumulation. Loss of CEP19 expression caused the number of cells with lipid accumulation to be ∼2-fold higher than that of WT cells (Figure S10A). This difference was accompanied by increased expression levels of the peroxisome proliferator-activated receptor gamma (PPARG [MIM 601487]; Figure S10B), encoding a key adipocyte-differentiation regulator that induces the expression of adipocyte-specific genes.20 Concomitant with increased PPARG expression, there was also increased expression of adipocyte-specific genes, including leptin (LEP [MIM 164160]), complement factor D (adipsin) (CFD [MIM 134350]), adiponectin, C1Q, and collagen domain containing (ADIPOQ [MIM 605441]), and fatty-acid-binding protein 4, adipocyte (FABP4 [MIM 600434]).
The Cep19-KO mice and affected males with MO1 syndrome were infertile. Examination of the murine testes revealed marked degeneration of spermatogenic cells and seminiferous tubules (Figure S11). Although the Cep19-KO spermatozoa developed flagella, many had a fixed abnormal crooked appearance, and sperm motility was substantially diminished (Movies S1, S2, and S3). These findings would suggest that loss of CEP19 also can affect motile cilia, which are structurally related to primary cilia. The mechanism for these defects in motile cilia is currently unknown, and there are no apparent differences in the rate of ciliogenesis or ciliary length in MEFs with loss of CEP19 function (Figure S12).
In summary, our studies have determined that the inactivation of CEP19 results in a morbid-obesity syndrome. Further studies are required for establishing how the loss of CEP19 function results in morbid obesity and its relationship to appetite control, energy expenditure, and insulin signaling and sensitivity. From an evolutionary perspective, the high degree of CEP19 sequence conservation across species is consistent with the ancient origins of cilia and the relative importance of CEP19 function. By way of comparison, FTO (MIM 610966), whose association with BMI and obesity was demonstrated by multiple GWASs and is the strongest genetic risk factor for obesity,21–24 is not conserved in invertebrates,25,26 suggesting that the role of CEP19 in energy homeostasis might have evolved more than ∼250 million years earlier. Thus, CEP19 defines a highly conserved target for understanding the molecular basis of energy homeostasis and, potentially, the development of strategies for treating obesity and malnutrition.
Acknowledgments
We thank all the family members who participated in this study. J.A.M. was supported in part by a National Institutes of Health (NIH) grant (5R01DK071298), B.D.D. was supported by a March of Dimes award and by an NIH grant (5 R01 HD069647), and M.A.G. received financial support through an American Heart Association grant (10SDG4470014). J.A.M. would like to thank A. Cederbaum, C. Mobbs, and D. Leroith for their thoughtful and critical advice throughout these studies. A.S. thanks A. Ahronhiem for his generous advice and fruitful discussions of the mouse research.
Contributor Information
Adel Shalata, Email: adelsh@clalit.org.il.
John A. Martignetti, Email: john.martignetti@mssm.edu.
Supplemental Data
Web Resources
The URLs for data presented herein are as follows:
1000 Genomes, http://browser.1000genomes.org
Online Mendelian Inheritance in Man (OMIM), http://www.omim.org/
UCSC Genome Browser, http://genome.ucsc.edu
References
- 1.Kopelman P.G. Obesity as a medical problem. Nature. 2000;404:635–643. doi: 10.1038/35007508. [DOI] [PubMed] [Google Scholar]
- 2.Hossain P., Kawar B., El Nahas M. Obesity and diabetes in the developing world—a growing challenge. N. Engl. J. Med. 2007;356:213–215. doi: 10.1056/NEJMp068177. [DOI] [PubMed] [Google Scholar]
- 3.Stunkard A.J., Sørensen T.I., Hanis C., Teasdale T.W., Chakraborty R., Schull W.J., Schulsinger F. An adoption study of human obesity. N. Engl. J. Med. 1986;314:193–198. doi: 10.1056/NEJM198601233140401. [DOI] [PubMed] [Google Scholar]
- 4.Stunkard A.J., Foch T.T., Hrubec Z. A twin study of human obesity. JAMA. 1986;256:51–54. [PubMed] [Google Scholar]
- 5.Price R.A., Stunkard A.J., Ness R., Wadden T., Heshka S., Kanders B., Cormillot A. Childhood onset (age less than 10) obesity has high familial risk. Int. J. Obes. 1990;14:185–195. [PubMed] [Google Scholar]
- 6.Allison D.B., Kaprio J., Korkeila M., Koskenvuo M., Neale M.C., Hayakawa K. The heritability of body mass index among an international sample of monozygotic twins reared apart. Int. J. Obes. Relat. Metab. Disord. 1996;20:501–506. [PubMed] [Google Scholar]
- 7.Friedman J.M. Modern science versus the stigma of obesity. Nat. Med. 2004;10:563–569. doi: 10.1038/nm0604-563. [DOI] [PubMed] [Google Scholar]
- 8.Ramachandrappa S., Farooqi I.S. Genetic approaches to understanding human obesity. J. Clin. Invest. 2011;121:2080–2086. doi: 10.1172/JCI46044. [DOI] [PMC free article] [PubMed] [Google Scholar]
- 9.Farooqi S., O’Rahilly S. Genetics of obesity in humans. Endocr. Rev. 2006;27:710–718. doi: 10.1210/er.2006-0040. [DOI] [PubMed] [Google Scholar]
- 10.Jakobsen L., Vanselow K., Skogs M., Toyoda Y., Lundberg E., Poser I., Falkenby L.G., Bennetzen M., Westendorf J., Nigg E.A. Novel asymmetrically localizing components of human centrosomes identified by complementary proteomics methods. EMBO J. 2011;30:1520–1535. doi: 10.1038/emboj.2011.63. [DOI] [PMC free article] [PubMed] [Google Scholar]
- 11.Alberti K.G., Zimmet P., Shaw J. Metabolic syndrome—a new world-wide definition. A Consensus Statement from the International Diabetes Federation. Diabet. Med. 2006;23:469–480. doi: 10.1111/j.1464-5491.2006.01858.x. [DOI] [PubMed] [Google Scholar]
- 12.Rosen O.M., Smith C.J., Hirsch A., Lai E., Rubin C.S. Recent studies of the 3T3-L1 adipocyte-like cell line. Recent Prog. Horm. Res. 1979;35:477–499. doi: 10.1016/b978-0-12-571135-7.50015-1. [DOI] [PubMed] [Google Scholar]
- 13.Putnam N.H., Srivastava M., Hellsten U., Dirks B., Chapman J., Salamov A., Terry A., Shapiro H., Lindquist E., Kapitonov V.V. Sea anemone genome reveals ancestral eumetazoan gene repertoire and genomic organization. Science. 2007;317:86–94. doi: 10.1126/science.1139158. [DOI] [PubMed] [Google Scholar]
- 14.Srivastava M., Begovic E., Chapman J., Putnam N.H., Hellsten U., Kawashima T., Kuo A., Mitros T., Salamov A., Carpenter M.L. The Trichoplax genome and the nature of placozoans. Nature. 2008;454:955–960. doi: 10.1038/nature07191. [DOI] [PubMed] [Google Scholar]
- 15.Marshall J.D., Bronson R.T., Collin G.B., Nordstrom A.D., Maffei P., Paisey R.B., Carey C., Macdermott S., Russell-Eggitt I., Shea S.E. New Alström syndrome phenotypes based on the evaluation of 182 cases. Arch. Intern. Med. 2005;165:675–683. doi: 10.1001/archinte.165.6.675. [DOI] [PubMed] [Google Scholar]
- 16.Feuillan P.P., Ng D., Han J.C., Sapp J.C., Wetsch K., Spaulding E., Zheng Y.C., Caruso R.C., Brooks B.P., Johnston J.J. Patients with Bardet-Biedl syndrome have hyperleptinemia suggestive of leptin resistance. J. Clin. Endocrinol. Metab. 2011;96:E528–E535. doi: 10.1210/jc.2010-2290. [DOI] [PMC free article] [PubMed] [Google Scholar]
- 17.Moore S.J., Green J.S., Fan Y., Bhogal A.K., Dicks E., Fernandez B.A., Stefanelli M., Murphy C., Cramer B.C., Dean J.C. Clinical and genetic epidemiology of Bardet-Biedl syndrome in Newfoundland: a 22-year prospective, population-based, cohort study. Am. J. Med. Genet. A. 2005;132:352–360. doi: 10.1002/ajmg.a.30406. [DOI] [PMC free article] [PubMed] [Google Scholar]
- 18.Zaghloul N.A., Katsanis N. Mechanistic insights into Bardet-Biedl syndrome, a model ciliopathy. J. Clin. Invest. 2009;119:428–437. doi: 10.1172/JCI37041. [DOI] [PMC free article] [PubMed] [Google Scholar]
- 19.Girard D., Petrovsky N. Alström syndrome: insights into the pathogenesis of metabolic disorders. Nat. Rev. Endocrinol. 2011;7:77–88. doi: 10.1038/nrendo.2010.210. [DOI] [PubMed] [Google Scholar]
- 20.Tontonoz P., Spiegelman B.M. Fat and beyond: the diverse biology of PPARgamma. Annu. Rev. Biochem. 2008;77:289–312. doi: 10.1146/annurev.biochem.77.061307.091829. [DOI] [PubMed] [Google Scholar]
- 21.Frayling T.M., Timpson N.J., Weedon M.N., Zeggini E., Freathy R.M., Lindgren C.M., Perry J.R., Elliott K.S., Lango H., Rayner N.W. A common variant in the FTO gene is associated with body mass index and predisposes to childhood and adult obesity. Science. 2007;316:889–894. doi: 10.1126/science.1141634. [DOI] [PMC free article] [PubMed] [Google Scholar]
- 22.Scuteri A., Sanna S., Chen W.M., Uda M., Albai G., Strait J., Najjar S., Nagaraja R., Orrú M., Usala G. Genome-wide association scan shows genetic variants in the FTO gene are associated with obesity-related traits. PLoS Genet. 2007;3:e115. doi: 10.1371/journal.pgen.0030115. [DOI] [PMC free article] [PubMed] [Google Scholar]
- 23.Thorleifsson G., Walters G.B., Gudbjartsson D.F., Steinthorsdottir V., Sulem P., Helgadottir A., Styrkarsdottir U., Gretarsdottir S., Thorlacius S., Jonsdottir I. Genome-wide association yields new sequence variants at seven loci that associate with measures of obesity. Nat. Genet. 2009;41:18–24. doi: 10.1038/ng.274. [DOI] [PubMed] [Google Scholar]
- 24.Willer C.J., Speliotes E.K., Loos R.J., Li S., Lindgren C.M., Heid I.M., Berndt S.I., Elliott A.L., Jackson A.U., Lamina C., Wellcome Trust Case Control Consortium. Genetic Investigation of ANthropometric Traits Consortium Six new loci associated with body mass index highlight a neuronal influence on body weight regulation. Nat. Genet. 2009;41:25–34. doi: 10.1038/ng.287. [DOI] [PMC free article] [PubMed] [Google Scholar]
- 25.Robbens S., Rouzé P., Cock J.M., Spring J., Worden A.Z., Van de Peer Y. The FTO gene, implicated in human obesity, is found only in vertebrates and marine algae. J. Mol. Evol. 2008;66:80–84. doi: 10.1007/s00239-007-9059-z. [DOI] [PubMed] [Google Scholar]
- 26.Fredriksson R., Hägglund M., Olszewski P.K., Stephansson O., Jacobsson J.A., Olszewska A.M., Levine A.S., Lindblom J., Schiöth H.B. The obesity gene, FTO, is of ancient origin, up-regulated during food deprivation and expressed in neurons of feeding-related nuclei of the brain. Endocrinology. 2008;149:2062–2071. doi: 10.1210/en.2007-1457. [DOI] [PubMed] [Google Scholar]
Associated Data
This section collects any data citations, data availability statements, or supplementary materials included in this article.