

This paper focuses on the C. elegans RNA-binding protein, GLD-1. GLD-1 is a translational repressor whose targets have been difficult to predict. The authors develop a simple biophysical model, which, by taking into account target accessibility, significantly improves target prediction. They find that CDS-located binding sites contribute most to translational repression.
Keywords: RNA-binding protein (RBP), GLD-1, binding site prediction, accessibility, translation repression, stabilization
Abstract
To understand the function of the hundreds of RNA-binding proteins (RBPs) that are encoded in animal genomes it is important to identify their target RNAs. Although it is generally accepted that the binding specificity of an RBP is well described in terms of the nucleotide sequence of its binding sites, other factors such as the structural accessibility of binding sites or their clustering, to enable binding of RBP multimers, are also believed to play a role. Here we focus on GLD-1, a translational regulator of Caenorhabditis elegans, whose binding specificity and targets have been studied with a variety of methods such as CLIP (cross-linking and immunoprecipitation), RIP-Chip (microarray measurement of RNAs associated with an immunoprecipitated protein), profiling of polysome-associated mRNAs and biophysical determination of binding affinities of GLD-1 for short nucleotide sequences. We show that a simple biophysical model explains the binding of GLD-1 to mRNA targets to a large extent, and that taking into account the accessibility of putative target sites significantly improves the prediction of GLD-1 binding, particularly due to a more accurate prediction of binding in transcript coding regions. Relating GLD-1 binding to translational repression and stabilization of its target transcripts we find that binding sites along the entire transcripts contribute to functional responses, and that CDS-located sites contribute most to translational repression. Finally, biophysical measurements of GLD-1 affinity for a small number of oligonucleotides appear to allow an accurate reconstruction of the sequence specificity of the protein. This approach can be applied to uncover the specificity and function of other RBPs.
INTRODUCTION
RNA-binding proteins (RBPs) control many post-transcriptional steps of gene expression (e.g., mRNA localization, stability, and translation rate) for a large number of target RNAs. To unravel this regulatory layer, it is important to identify target sites of individual RBPs, preferably at nucleotide resolution. Both experimental and computational approaches have been utilized to this end, each having its own advantages as well as limitations. On the one hand, experimental high-throughput methods are available, but they have restricted sensitivity and are typically applied to one cell type at a time. On the other hand, computational approaches can be applied transcriptome-wide, irrespective of the expression profile of transcripts, but it is not always clear how to represent the binding specificity of RBPs. RBPs typically bind single-stranded RNAs in a sequence-specific manner (Auweter et al. 2006). However, their cognate binding elements in the RNA are rather short, and it is generally believed that other factors, such as the accessibility of binding sites within folded RNA molecules or the clustering of binding sites which may allow for binding of RBP multimers or multidomain RBPs contribute to their specificity (Ray et al. 2009; Kazan et al. 2010; Zhang et al. 2010; Wang et al. 2011). Here, in the framework of a biophysical model, we explore these possibilities for GLD-1, an important RBP regulator in the germline of the worm Caenorhabditis elegans. GLD-1 contains an hnRNP K homology (KH) RNA-binding domain and is a member of the STAR (signal transducer and activator of RNA metabolism) family of proteins, which also includes the human and mouse Quaking (QKI) proteins. GLD-1 has been shown to bind to 3′ and 5′ UTRs, inducing repression of translation and protection of target mRNAs from decay (Lee and Schedl 2001, 2004). Recently, GLD-1 targets have been determined with transcriptome-wide experimental methods, such as CLIP (Jungkamp et al. 2011) and RIP-Chip (Wright et al. 2011). Moreover, measurements of polysome-associated RNAs in wild-type and gld-1 mutant worms enabled the characterization of downstream effects of GLD-1 binding (Scheckel et al. 2012). These studies expanded the number of GLD-1 target transcripts to around 450 (Jungkamp et al. 2011) and confirmed the dual role of GLD-1 in translation repression and transcript stabilization (Scheckel et al. 2012). Moreover, a quantitative binding score for the prediction of GLD-1 binding sites based on 7-mer motif frequencies was introduced (Wright et al. 2011). Thus, GLD-1 offers a good opportunity to study alternative models of RBP binding specificity, also in relation to the downstream effects of protein binding to RNAs.
RESULTS
Inference of binding motifs from CLIP data and measurements of oligonucleotide–protein binding affinities
CLIP in combination with high-throughput sequencing is becoming the state-of-the-art method for inferring the binding specificity of RBPs, and it has been applied successfully to uncover the binding specificities of, among others, NOVA, FOX2, IGF2BP, PUM, and QKI proteins (Ule et al. 2003; Yeo et al. 2009; Hafner et al. 2010). For GLD-1, four CLIP libraries are already available, which have been obtained through the so-called iPAR-CLIP (in vivo photoactivatable-ribonucleoside-enhanced CLIP) method (Jungkamp et al. 2011). For three of these samples 4-thiouridine (4SU) was used as the photoreactive nucleoside, and for the fourth it was 6-thioguanosine (6SG). We complemented these with one library prepared with the so-called HITS-CLIP method (Darnell 2010; Kishore et al. 2011), in which no photoreactive nucleosides are used and cross-linking is performed with a 254-nm UV light. All CLIP data sets were preprocessed on our CLIPZ server (www.clipz.unibas.ch) (Khorshid et al. 2010), and then the top 500 most frequently CLIPed sites in each library were used to infer over-represented sequence motifs to which GLD-1 presumably binds with the PhyloGibbs motif finder (Siddharthan et al. 2005). We varied the length of the searched motif, but a length of 7 nucleotides seemed to most consistently fit all of the data sets. The iPAR-CLIP data sets yielded generally very similar motifs (Fig. 1), except for the motif derived from iPAR-CLIP 4SU 2 being shifted relative to the others by 1 nucleotide. The motif derived from iPAR-CLIP 6SG had a lower probability for adenine at position 5 as did the binding motif derived from HITS-CLIP, which also differed from the others at position 2, at which the probability for an adenine was decreased, and the last position, at which the probability for cytosine reached almost 1. For reference, we inferred a GLD-1 binding motif based on affinities of 43 7-meric sequences to GLD-1 (see Materials and Methods) that were measured by Wright et al. (2011). The resulting binding motif was similar to those inferred from CLIP, and it also showed less polarized nucleotide frequencies at the positions that differed between the motifs inferred from various CLIP data sets. In particular, the probabilities for adenines at positions 2 and 5 and for cytosine at position 3 were much lower than in motifs derived from iPAR-CLIP (Fig. 1, bottom, right). These results indicate that differences in the motifs inferred from different CLIP data sets probably reflect intrinsic biases in the cross-linking methods (Sugimoto et al. 2012). The derived weight matrices are given in the Supplemental Material.
FIGURE 1.

GLD-1 binding motifs. GLD-1 binding motifs from the 500 most frequently CLIPed sites of four iPAR-CLIP libraries (Jungkamp et al. 2011) and one HITS-CLIP library, inferred with PhyloGibbs (Siddharthan et al. 2005). Additionally, a motif was derived from measured binding affinities to 43 short oligonucleotides (Wright et al. 2011; see Materials and Methods).
Transcriptome-wide prediction of GLD-1 binding
To evaluate the predictive power of the inferred motifs for GLD-1 binding, we used a framework that was previously introduced for prediction of transcription-factor binding sites (Rajewsky et al. 2002) to compute the expected number of GLD-1 binding sites in a transcript (see Materials and Methods). We then correlated this number with the enrichment of the transcript in GLD-1 RIP-Chip (Wright et al. 2011) and we used the Spearman correlation coefficient as a measure for the predictive power of the binding motif (a similar figure based instead on the Pearson correlation coefficients is shown in the Supplemental Material). We included in the analysis 1652 transcripts with germline tag >4 (Wang et al. 2009), which are considered “expressed” in the C. elegans germ line. The Spearman correlation coefficient was somewhat higher when motifs from iPAR-CLIP were used for target prediction (0.43, 0.42, 0.43, 0.39 for iPAR-CLIP 4SU 1,2,3 and 6SG, respectively) compared with predictions based on motifs derived from HITS-CLIP (0.34) and from measured binding affinities to oligonucleotides (0.38) (Fig. 2A, second bar of each color). As a reference we calculated the average correlation between RIP-Chip enrichment and the number of expected binding sites predicted for randomized motifs generated by shuffling the columns of individual weight matrices. The poor correlation obtained in this setting indicates that all motifs predict bona fide targets of GLD-1 (Fig. 2A, first bar of each block).
FIGURE 2.
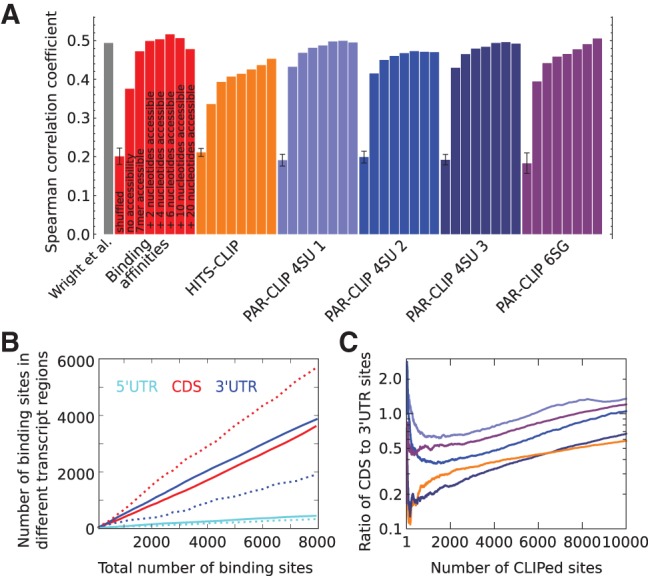
Predictive power of GLD-1 binding motifs. (A) Spearman correlation coefficient of RIP-Chip enrichment (Wright et al. 2011) with expected number of binding sites in whole transcripts (see Materials and Methods) for all GLD-1 binding motifs derived from various CLIP experiments (indicated in the labels below the x-axis). The Spearman correlation coefficient between RIP-Chip enrichment and transcript scores computed by Wright et al. (2011) is shown in the first column. For each weight matrix, 10 permutations were generated, maintaining the relative nucleotide frequencies within columns. The first bar in a colored block corresponding to one motif shows the average correlation coefficient obtained for the 10 randomized weight matrices. For each individual motif, additional columns show the Spearman correlation coefficient without and upon inclusion of the probability for a 7-mer, 9-mer, 11-mer, 13-mer, 17-mer, or 27-mer centered on the binding site to be accessible, calculated with RNAplfold (Bernhart et al. 2006; see Materials and Methods). (B) Number of predicted binding sites in 5′ and 3′ UTRs and CDSs in dependence of the total number of predicted sites using the GLD-1 binding model with the motif inferred from binding affinities without (dashed lines) and with inclusion of the probability for a 13-mer to be accessible (solid lines). (C) Ratio of CLIPed sites in CDSs to UTRs in five CLIP libraries (color code same as in A) sorted by the number of reads of CLIPed sites.
Previous studies focused on the GLD-1 binding sites located in 3′ or 5′ untranslated transcript regions (Lee and Schedl 2001, 2004; Ryder et al. 2004; Jungkamp et al. 2011; Wright et al. 2011). Sites in the coding domain were not found to contribute to the enrichment of transcripts in RIP-Chip (Wright et al. 2011). The GLD-1 CLIP data, however, reveal many binding sites in coding regions (Fig. 2C) and the model that we introduced above predicts, in fact, more binding sites in coding regions (CDS) than in 3′- and 5′-UTR regions (UTRs), irrespective of the threshold on the number of binding sites (Fig. 2B, dashed lines).
Accessibility of binding sites in the RNA is important for GLD-1 binding
One possible explanation behind the discrepancies in the number of predicted and identified sites in coding regions resides in the relative accessibility of binding sites. RNA molecules are not rigid, but fold into three-dimensional structures that also interact with proteins. Consequently, different occurrences of a sequence motif in a transcript generally have different accessibilities for RBPs. Taking this into account has been found to improve the detection of functional miRNA (Kertesz et al. 2007; Hausser et al. 2009) and siRNA (Hofacker and Tafer 2010) binding sites. To explore whether target-site accessibility is an important factor in GLD-1 binding, we used RNAplfold (Bernhart et al. 2006) to calculate the probability that any subsequence of a specified length within a transcript is single stranded and hence accessible for the RBP to bind. Including this probability in the binding model (see Materials and Methods) significantly improved the Spearman correlation with RIP-Chip enrichment for all of the above derived GLD-1 binding motifs (Fig. 2A, third bar of each color). The highest concordance with the RIP-Chip enrichment (Spearman correlation coefficient 0.47) was reached for the motif derived from oligonucleotide binding affinities. This may indicate that the sequence specificity that we inferred from CLIP data may already be confounded by differential accessibility of different sequence motifs such that explicitly taking into account the sequence-dependent accessibility of GLD-1 binding sites only slightly improve the prediction of the RIP-Chip data. We observed an additional increase in the correlation between the binding score and the RIP-Chip enrichment when we required that slightly wider regions (9, 11, or 13 nucleotides) centered on the GLD-1 binding motif be in single-stranded conformation for GLD-1 to bind (Fig. 2A). These results suggest that the structural accessibility of putative GLD-1 binding sites contributes to GLD-1 binding.
Wright et al. (2011) introduced a quantitative “GLD-1 binding code” based on a combination of linear regression coefficients and weight matrix scores of 80 7-mers that were enriched in transcripts that bind GLD-1. The Pearson correlation coefficient between the binding score of a transcript and its enrichment in GLD-1 RIP-Chip was found to be 0.64. Reanalyzing these data we found that the Spearman correlation coefficient was 0.49 (Fig. 2A, gray bar), comparable to that given by our biophysical model of GLD-1 binding that includes binding-site accessibility.
It is noteworthy that the relative numbers of predicted GLD-1 binding sites in UTRs and CDSs changed substantially upon inclusion of accessibility. Namely, independent on the cutoff for the total number of predicted binding sites, the number of binding sites in UTRs was always higher than that in CDSs (Fig. 2B, solid lines) when the accessibility of sites was taken into account. These results suggest that a biophysical model that uses a weight matrix representation of GLD-1 binding specificity and takes into account the relative accessibility of sequence motifs inside the structure of the host transcript has so far the best explanatory power for RIP-Chip data.
We further investigated whether a similar model can describe the binding of the human homolog of GLD-1, the Quaking (QKI) protein. Applying the GLD-1 binding model to human transcripts reveals a good correlation between the expected number of predicted binding sites and the enrichment of transcripts in QKI RIP-Chip measured for 7819 human transcripts (Fig. 3A; Hafner et al. 2010). Thus, our model may generalize to other RBPs of the STAR protein family containing KH-binding domains.
FIGURE 3.

General specificity of KH-binding domains and dimer binding motifs. (A) Spearman correlation coefficient of QKI RIP-Chip enrichment (Hafner et al. 2010) with the expected number of binding sites in human transcripts for all GLD-1 binding motifs. (B) Sketch of dimeric, bipartite, and reverse bipartite binding motifs that we considered in the model. (C) Spearman correlation coefficient of GLD-1 RIP-Chip enrichment (Wright et al. 2011) with the expected number of binding sites in whole transcripts calculated using a dimer, bipartite, and reverse bipartite binding configuration for all 7-mer GLD-1 binding motifs.
Clustering of binding motifs in bipartite and dimer binding sites
Like other RBPs of the STAR family, GLD-1 also contains two Quaking domains (Qua1 and Qua2). Of these, Qua1 serves as a homodimerization domain (Beuck et al. 2010), and it has been suggested that GLD-1 dimers can recognize bipartite binding sites consisting of the full 7-meric binding motif preceded, at a variable distance, by an occurrence of a half (last four positions) binding motif (Galarneau and Richard 2009). To determine whether such GLD-1 binding sites can improve the prediction of GLD-1 binding data, we extended the binding model by additionally allowing for the possibility of binding of protein dimers. We tested three binding-site configurations sketched in Figure 3B, namely, a dimeric site, a half site followed by a full site, and a full site followed by a half site. Reasoning that RNA molecules have some flexibility, we allowed the number of linker nucleotides in the bipartite and dimer motifs to vary between 0 and 20 nucleotides. The relative frequencies of binding sites with different linker lengths were optimized with an expectation maximization algorithm (van Nimwegen 2007), and the relative frequencies at maximal Spearman correlation of expected number of binding sites with RIP-Chip enrichment were used to predict GLD-1 binding sites. We did not find that inclusion of these types of motifs improves the prediction of RIP-Chip enrichment of transcripts (Spearman correlation coefficient 0.33–0.44 compared with 0.34–0.43 when taking into account only the 7-meric motif) (Fig. 3C), indicating that the specificity of GLD-1 binding is not due to binding of protein dimers in the configurations that we tested here.
Predicted GLD-1 target transcripts undergo stabilization and translational inhibition
To assess the power of our model in identifying biologically relevant targets of GLD-1, we sought to determine whether the predicted targets undergo translational repression (measured as the ratio of the fraction of polysome-associated RNA in wild-type compared with gld-1 mutant worms) (Scheckel et al. 2012) or stabilization (measured as the enrichment of mRNAs in the gonads of wild-type worms over gld-1 mutants) (Scheckel et al. 2012). For reference, we analyzed the predictive power that the enrichment of a transcript in RIP-Chip or the number of reads derived from the transcript in a CLIP experiment have for translational inhibition and mRNA stabilization. Figure 4 shows how well the prediction score of transcripts reflects the degree of translational repression or stabilization. More specifically, the y-axis indicates the median prediction rank among the most stabilized or translationally inhibited n transcripts as a function of n, shown on the x-axis. We found that RIP-Chip enrichment and, to a lesser extent, the number of CLIP reads explain best the functional effects, whereas computational models have a lower performance (Fig. 4A,B; cf. black and gray lines with colored lines for computational models). Our GLD-1 binding model has a better performance in predicting the extent of translational inhibition than the model of Wright et al. (2011) (Fig. 4A), which appears to only predict accurately the ∼100 most stabilized transcripts. Interestingly, discarding the low-affinity sites from the computation of the expected number of sites per transcript strongly improves the prediction of these most stabilized transcripts by our GLD-1 binding model (Fig. 4B, cf. orange and red lines). This suggests that mRNA stabilization requires the interaction of GLD-1 with high-affinity sites or with the 3′ UTRs, where high-affinity sites appear to be preferentially located. Finally, we performed similar analysis using different weight matrices with and without inclusion of the accessibility of binding sites. We found that similarly to prediction of RIP-Chip data, accessibility strongly improves the prediction of stabilized and translationally inhibited targets, and that binding motifs derived from measurements of oligonucleotides affinity for GLD-1 lead to an overall better prediction of GLD-1 functional effects compared with binding motifs derived from CLIPed sites (Fig. 4C,D).
FIGURE 4.
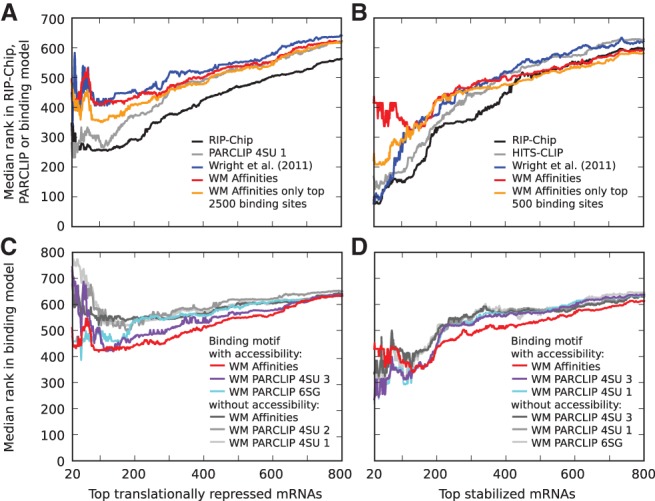
Translational repression and stabilization in target transcripts. Median ranks in different data sets and computational models of (A,C) the transcripts whose translation is most strongly inhibited (translation rate was estimated as the ratio of the fraction of polysomal to total mRNA in wild-type worms compared with this fraction in gld-1 mutants) and (B,D) the transcripts that undergo the strongest stabilization (estimated as the ratio of mRNA levels in wild-type gonads compared with gld-1 mutant gonads). (A,B) Experimental measurements, RIP-Chip enrichment (black), and total number of CLIP reads per transcript (gray) better explain functional responses than computational predictions. For clarity, only the curves for the most predictive CLIP samples, which were the iPAR-CLIP 4SU 1 and HITS-CLIP, respectively, are shown. The computational models shown are those from Wright et al. (2011) (blue) and our biophysical GLD-1 binding model (red) that used the sequence specificity inferred from binding affinities and including the probability for accessibility of a 13-mer. The orange curve corresponds to the same biophysical model, but the expected number of sites per transcript was computed only based on the indicated number of highest affinity sites. The best improvement in the prediction of (A) translational inhibition was achieved with a cutoff of ∼2500 binding sites, while (B) a cutoff of ∼500 binding sites was best for stabilization. (C,D) Prediction of functional target transcripts is improved upon inclusion of the probability that sites are accessible. For clarity, shown are only the three best-performing binding motifs for each case.
Binding sites located in different regions may have distinct functional effects
The analysis described above suggested that in contrast to transcript stabilization, which appears to be mainly mediated through high-affinity GLD-1 binding sites, translational repression does not depend solely on such sites. Prediction of translational repression improved by considering ∼2500 binding sites, including those with medium scores, as opposed to considering only the top ∼500 binding sites, which we found to be predictive of transcript stabilization (Fig. 4A,B). Since the highest-affinity binding sites are located predominantly in the UTRs (Fig. 2B), we sought to determine whether binding sites that are located in different transcript regions have different functional effects. We used a linear regression model and determined the fractions of variances of either translational repression or mRNA stabilization, which could be explained by the sum of posterior probabilities for binding sites in 5′ UTRs, CDSs, or 3′ UTRs (Fig. 5A). For reference, we applied the same method to explain the enrichment of transcripts in RIP-Chip in terms of binding sites in different transcript regions. As previously described by Wright et al. (2011), RIP-Chip enrichment could be explained to a large extent by GLD-1 binding to the 3′ UTRs (∼60% of the explained variance) and the total fraction of variance explained by the model was ∼28%. Similarly, transcript stabilization seems to also be mostly dependent on GLD-1 binding sites in 3′ UTRs (∼30% of explained variance), but binding sites in 5′ UTRs and CDSs also contribute (each 15%–20%). In striking contrast, the largest contribution to translational repression appears to come from GLD-1 binding sites in the CDSs (>60% of the variance explained), independent of the cutoff on the affinity of binding sites. This is not due to the fact that CDSs are longer, on average, than UTRs, because we obtain the result even if we use the density of sites in a given transcript region instead of the expected number of sites (data not shown). A 10-fold cross-validation, performed by determining regression coefficients from 90% of the data and calculating the contributions to explained variances in the other 10% of the data, further supports the role for binding sites in the coding region in translational repression (Fig. 5B). Interestingly, in contrast to the ∼100 very high affinity sites, that are preferentially located at the beginning and end of coding regions, most of the CDS sites have a relatively uniform distribution along coding regions (data not shown).
FIGURE 5.
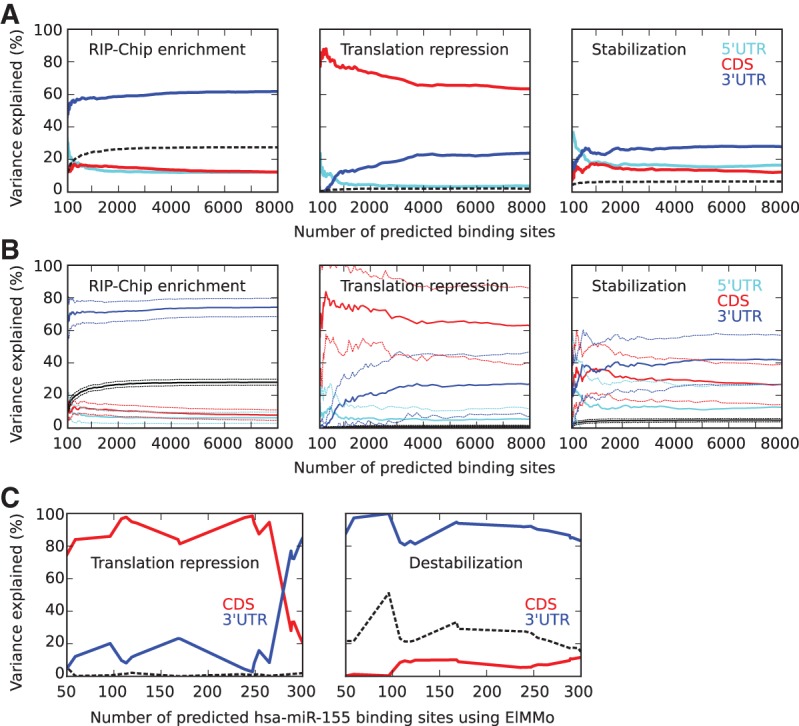
Differential contribution of binding sites in different transcript regions to functional responses, translation inhibition, and mRNA stabilization. (A) Contributions to the total variance explained (black) of binding sites in 5′ UTR (cyan), CDS (red), and 3′ UTR (blue) in RIP-Chip enrichment, translation repression, and transcript stabilization as a function of the total number of predicted binding sites taken into account, calculated with a linear regression model. (B) Average (solid) and standard deviation (dashed) of contributions of binding sites in 5′ UTR (cyan), CDS (red), and 3′ UTR (blue) to the total variance explained (black) in 10% of the data, when training the linear regression model on the other 90% of the data, averaged over 100 random partitions of the data. (C) Contributions to the total variance explained (black) in translation repression and destabilization of human transcripts after miR-155 transfection (Guo et al. 2010) of binding sites located in CDS and 3′ UTR, as a function of the total number of predicted binding sites (using ElMMo) (Gaidatzis et al. 2007), calculated with a linear regression model. To better assess the contribution of site location to the functional response, we limited the linear regression to transcripts with predicted miR-155 binding sites in both CDS and 3′ UTR.
Relative to RIP-Chip enrichment and mRNA stabilization, the fraction of the total variance in translational repression measured by polysome profiling that is explained by the model is relatively small (2% vs. 30% and 6%). To determine whether this is more generally the case, we performed the same computation to explain translational repression and transcript destabilization in human cells transfected with a microRNA. MicroRNA-guided Argonaute proteins are also known to bind both CDSs and 3′ UTRs (Hafner et al. 2010; Hausser et al. 2013) and to affect both the stability and translation rate of mRNAs (Bartel 2009). We used miR-155 binding sites predicted in CDS and 3′ UTR by the ElMMo algorithm (Gaidatzis et al. 2007) and the mRNA-seq and polysome profile data provided by Guo et al. (2010). As shown in Figure 5C, while transcript destabilization measured by mRNA-seq is explained quite well by binding sites in the 3′ UTRs, translational repression is explained again mostly by binding sites in the CDSs. Furthermore, the total variance in translational repression that is explained by the model is also much lower compared with the total variance in transcript destabilization, as we previously found for GLD-1. In contrast, for the HuR protein that has been reported to regulate alternative splicing, mRNA localization, and polyadenylation and could thus serve as a negative control, the binding sites determined by Lebedeva et al. (2011) explain a very small fraction of the total variance in transcript stabilization (0.77%) and translational repression (0.64%) measured by Lebedeva et al. (2011). A possibility that we cannot exclude is that the estimates of translation rates obtained through polysomal profiling are inherently less accurate than the estimates of mRNA stability obtained through mRNA-seq.
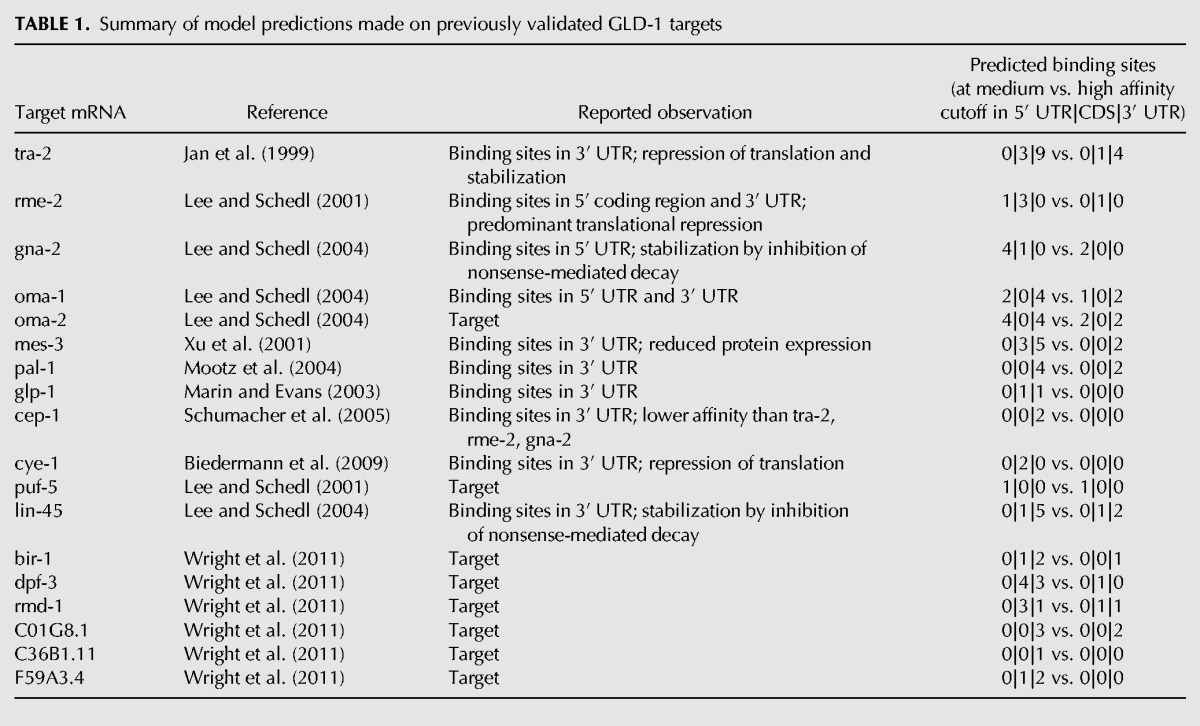
To further illustrate the insight provided by our model, in Table 1 we summarized the experimental observations of model predictions for a few well-known and well-studied GLD-1 target transcripts. Our model appears to predict very well the location of the GLD-1 binding sites, and when the relationship between the location of GLD-1 binding sites and the downstream response was explicitly drawn (e.g., for the tra-2, rme-2, gna-2, and cep-1 genes), the finding matches our model's prediction. Additional interesting examples for a putative differential function of binding sites in UTRs and CDSs are as follows: GLD-1 is predicted to bind to its own mRNA in the 3′ UTR and gld-1 mRNA is strongly stabilized (log2 enrichment of gonad mRNA in wild-type over gld-1 mutant worms 3.37; rank position in GLD-1 binding model 2), but it is not translationally repressed (log2 ratio of fraction of polysome-associated RNA in wild-type compared with gld-1 mutant worms 0.09; rank position 795). On the other hand, the gak-1 (germline-enhanced AT-HooK protein) transcript has predicted GLD-1 binding sites in the CDS and, consistently with our prediction, it is strongly repressed in translation (log2 ratio of fraction of polysome-associated RNA in wild-type compared with gld-1 mutant worms -1.31; rank position 18) but not stabilized (log2 enrichment of gonad mRNA in wild-type over gld-1 mutant worms 0.02; rank position 823) upon binding of GLD-1. A list of transcripts with their enrichment in RIP-Chip and CLIP, their level of stabilization and translational repression, as well as the number of binding sites in different transcript regions predicted by our model (at medium- and high-affinity cutoff) is available as a Supplemental Table.
TABLE 1.
Summary of model predictions made on previously validated GLD-1 targets
DISCUSSION
We proposed a binding model to explain the binding specificities of RBPs. Based on the sequence motif of the RBP and the predicted position-specific probabilities of subsequences containing putative binding sites to be in single-stranded conformations, the model allows us to estimate the expected number of binding sites for the RBP in each transcript. The binding model was applied to the C. elegans RBP GLD-1 that is involved in post-transcriptional control in the germline of worms. Binding sites of GLD-1 have already been studied previously, providing a large amount of transcriptome-wide data to test and verify the proposed biophysical binding model.
We derived binding motifs for GLD-1 from CLIP data as well as from binding affinities to short oligonucleotides. The resulting binding motifs were similar to those previously reported for GLD-1 and the predictive power of binding models that used different motifs were in a similar range. The highest Spearman correlation coefficient between the expected number of binding sites in transcripts and their RIP-Chip enrichment (0.52) was achieved when the probability of binding sites being accessible (in single-stranded conformation) were taken into account. The fact that the binding motif derived from binding affinities performed best in predicting the enrichment of transcripts in RIP-Chip may be a consequence of the fact that the sites obtained through CLIP already reflect a number of different properties that contribute to RBP binding, such as the nucleotide sequence and the structural accessibility of a binding site. Measuring binding affinities of an RBP to a set of oligonucleotides allows one to separate sequence from structural effects and may enable a more accurate quantification of the relative contributions of each factor.
The inclusion of the accessibility of a putative binding site in the binding model increased the correlation with measured RIP-Chip enrichment, and appeared to specifically allow a more accurate estimation of binding in transcript-coding regions.
Our analysis does not support a model in which GLD-1 binds predominantly as an oligomer, since neither bipartite nor dimer binding motifs improved the correlation with RIP-Chip enrichment. A similar conclusion was reached by Wright et al. (2011). In principle, it may still be that GLD-1 binds as a dimer to binding sites that are far apart on the linear RNA sequence but are brought in close proximity through RNA folding. Jungkamp et al. (2011) speculated about this binding mode, in particular as a mechanism for blocking translation initiation.
The functionality of predicted target transcripts was supported by their behavior in wild-type and gld-1 mutant worms. Furthermore, in contrast to the previously proposed “GLD-1 binding code,” the biophysical binding model can predict not only GLD-1 targets that undergo stabilization, but also targets that undergo translational repression. A linear regression model surprisingly revealed that binding sites in the CDS contribute most to translational repression. The underlying mechanism may simply be by blocking translation elongation (Petersen et al. 2006), but it needs to be further investigated. In contrast, the high-affinity binding sites located primarily in 3′ UTRs appear to mediate predominantly transcript stabilization. It should be pointed out that we only had indirect measurements of mRNA stabilization (mRNA levels in wild-type compared with mutant gonads) and translation (abundance of polysome-bound fragments in wild-type and mutant, correcting for the difference in mRNA abundance). Ideally, one would like to use direct estimates of mRNA decay rates and translation rates. These may yield a higher fraction of explained variance, particularly for translation, for which this fraction is small. It will be very interesting to learn whether binding to transcript coding regions is a general mechanism through which RBPs affect the rate of translation.
MATERIALS AND METHODS
Deriving binding energies of individual nucleotides from binding affinities
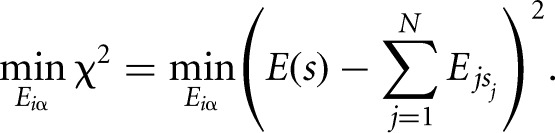
The total binding energy of an RNA–RBP complex is composed of binding energy contributions of nucleotides at each position in the binding site. If these contributions are assumed to be independent of each other, the total binding energy can be written as the sum of the binding energies of the individual nucleotides in the binding motif of length N:
 |
We derive the binding energy contributions of each nucleotide at each position of a binding motif from a set S of measured binding affinities of an RBP to short nucleotide sequences s by minimizing the difference between the predicted binding energy (the sum of individual energy contributions of each nucleotide in the sequence  ) and the measured energy, E(s), over all sequences in set S:
 |
At the minimum, the derivatives with respect to all individual binding energy contributions Eiα, where α denotes the nucleotide (A, C, G, or U) at position i in the motif, are 0:
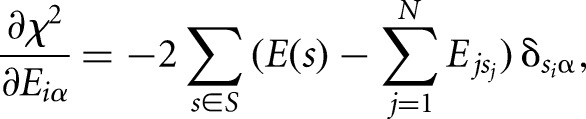 |
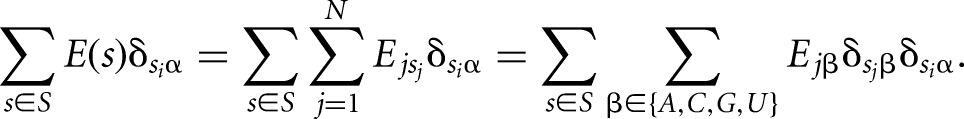
where δ is the Kronecker delta function, which takes the value 1 if nucleotide Si is α and 0 otherwise. Rearranging this equation leads to the following expression:
 |
Dividing both sides by the total number of sequences that have nucleotide α at position i:
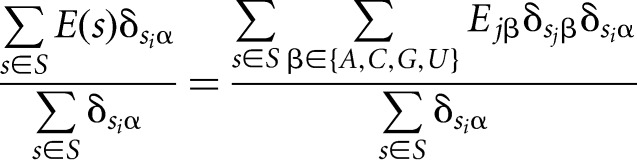 |
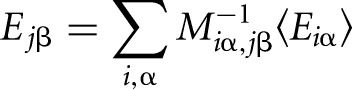
leads, on the left-hand side, to the average binding energy of all sequences that have nucleotide α at position i, while the right-hand side represents a multiplication of the matrix whose entries are the fraction of sequences with nucleotide α at position i that also have nucleotide β at position j, with the vector of the unknown individual binding energy contributions of each nucleotide at each position:
 |
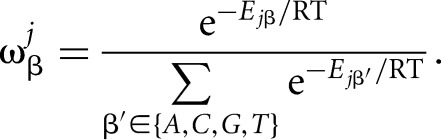
The individual contribution to the total binding energy of nucleotide β at position j is obtained as
 |
and it can be converted into the probability  for nucleotide β at position j by
 |
The Python code for the inference of a weight matrix from a set of binding affinities is available in the Supplemental Material.
Predicting binding sites in a sequence with and without accessibility
As described in van Nimwegen (2007), the expected number of binding sites in a sequence can be calculated as the sum of posterior probabilities of binding sites at every position in a transcript. The posterior probability for a binding site at a certain position i is given by
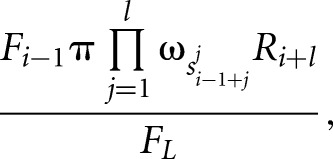 |
where F and R are the forward and backward partition sums that are calculated by iteratively summing up the probabilities of all possible configurations of bound sites and free nucleotides starting from the first or from the last nucleotide in the given sequence, respectively. For example, the forward sum at position L is given by
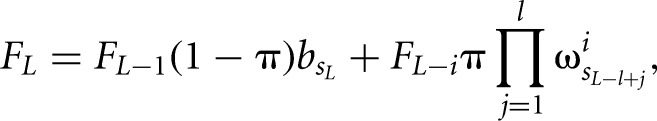 |
where π is the prior probability for a binding site,  is the background probability of the nucleotide found in the sequence s at position L, and
  is the probability of observing the nucleotide SL−l+i at position i of the binding site.
The expected number of binding sites is then calculated by summing up the posterior probabilities for binding sites at every position in a transcript divided by the forward sum over the entire transcript:
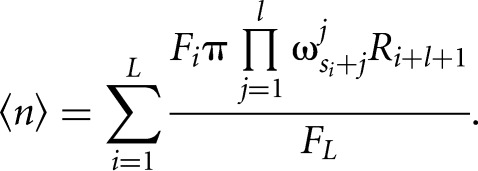 |
The accessibility of predicted binding sites is taken into account in the computation by multiplying the likelihood of a subsequence given the weight matrix with the probability that the subsequence is in single-stranded conformation. The probability of any subsequence of length l to be in single-stranded conformation, Paccessible(i … i + l), are calculated for every position in the transcript using RNAplfold (Bernhart et al. 2006) with the options window length W = 80 and span for base-pairing L = 40.
The formula for the expected number of binding sites is additionally divided by the prior probability for nonbinding nucleotides, replacing the prior probability of binding sites by a concentration c of the RBP:
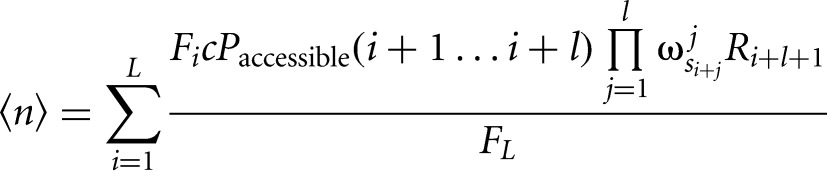 |
and the iterative forward sum is given by
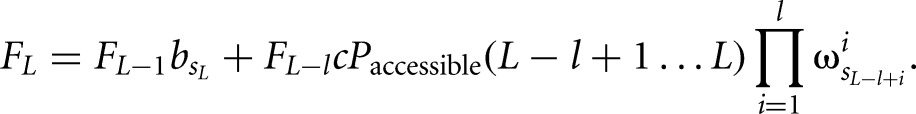 |
The concentration of the RBP needs to be estimated. Here, we used the maximization of the Spearman correlation of expected number of binding sites with RIP-Chip enrichment as an optimization criterion.
HITS-CLIP
C. elegans animals from strain WS5777 carrying the rescuing transgene gld-1(op236); opIs455 (Pgld-1::gld-1(genomic)::STREP/HA::gld-1 3′UTR) were bleached and their progeny grown on plates for 68 h at 20°C until they reached the L4/adult stage where translational regulation has been observed to be most prominent. Worms were harvested and irradiated with UV-B (3 kJ/m2) as described (Zisoulis et al. 2011). Approximately 200,000 worms were used for one HITS-CLIP experiment. Following irradiation, washing the worms, and centrifugation, worm pellets were lysed by sonication in RIPA buffer (25 mM HEPES-K at pH 7.5, 100 mM KCl, 1% [v/v] NP-40, 0.25% [v/v] Sodium Deoxycholate, 0.1% [v/v] SDS, 0.5 mM DTT, protease inhibitor cocktail [Roche]). Cleared lysates were treated with RNase T1 (Fermentas) (final concentration 1 unit/μL) for 15 min at 22°C. Subsequently, GLD-1::STREP/HA fusion proteins were immunoprecipitated with Strep-Tactin Sepharose (IBA) for 1 h at 4°C. RNA labeling and library preparation were carried out according to the PAR-CLIP protocol (Hafner et al. 2010). cDNA libraries were sequenced with Genome Analyzer IIx (Illumina).
Analyzed data sets
Raw sequencing data of four GLD-1 iPAR-CLIP experiments from Jungkamp et al. (2011) were downloaded from Gene Expression Omnibus (GEO; www.ncbi.nlm.nih.gov/geo; accession number: GSE33569) and uploaded to our CLIPZ server (www.clipz.unibas.ch) (Khorshid et al. 2010) for mapping and annotation of sequence reads. The top 500 CLIPed sites selected based on copy number were subjected to a motif analysis using PhyloGibbs with the parameters: -D 0 -m 7 -N 0 -r -z 2 -y 250 (Siddharthan et al. 2005).
RIP-Chip enrichment of transcripts and measured binding affinities to short oligonucleotide sequences were taken from the Supplemental data of Wright et al. (2011) and log2 array expression levels of total mRNA, mRNA in gonads, and polysomal mRNA in wild-type and gld-1 mutant worms were found in the Supporting Information of Scheckel et al. (2012). The translational repression of an mRNA was calculated as: log2(polysomal mRNA level in wild type) − log2(total mRNA level in wild type) − log2(polysomal mRNA level in gld-1 mutant) + log2(total mRNA level in gld-1 mutant) and stabilization of a transcript as: log2(gonad mRNA level in wild type) − log2(gonad mRNA level in gld-1 mutant).
SUPPLEMENTAL MATERIAL
Supplemental material is available for this article.
ACKNOWLEDGMENTS
We thank Erik van Nimwegen and the whole Zavolan group for discussions. This work was supported by the SNF Sinergia grant CRSII3_127454.
Footnotes
Freely available online through the RNA Open Access option.
REFERENCES
- Auweter SD, Oberstrass FC, Allain FH 2006. Sequence-specific binding of single-stranded RNA: Is there a code for recognition? Nucleic Acids Res 34: 4943–4959 [DOI] [PMC free article] [PubMed] [Google Scholar]
- Bartel DP 2009. MicroRNAs: Target recognition and regulatory functions. Cell 136: 215–233 [DOI] [PMC free article] [PubMed] [Google Scholar]
- Bernhart SH, Hofacker IL, Stadler PF 2006. Local RNA base pairing probabilities in large sequences. Bioinformatics 22: 614–615 [DOI] [PubMed] [Google Scholar]
- Beuck C, Szymczyna BR, Kerkow DE, Carmel AB, Columbus L, Stanfield RL, Williamson JR 2010. Structure of the GLD-1 homodimerization domain: Insights into STAR protein-mediated translational regulation. Structure 18: 377–389 [DOI] [PMC free article] [PubMed] [Google Scholar]
- Biedermann B, Wright J, Senften M, Kalchhauser I, Sarathy G, Lee MH, Ciosk R 2009. Translational repression of cyclin E prevents precocious mitosis and embryonic gene activation during C. elegans meiosis. Dev Cell 17: 355–364 [DOI] [PubMed] [Google Scholar]
- Darnell RB 2010. HITS-CLIP: Panoramic views of protein–RNA regulation in living cells. Wiley Interdiscip Rev RNA 1: 266–286 [DOI] [PMC free article] [PubMed] [Google Scholar]
- Gaidatzis D, van Nimwegen E, Hausser J, Zavolan M 2007. Inference of miRNA targets using evolutionary conservation and pathway analysis. BMC Bioinformatics 8: 69. [DOI] [PMC free article] [PubMed] [Google Scholar]
- Galarneau A, Richard S 2009. The STAR RNA binding proteins GLD-1, QKI, SAM68 and SLM-2 bind bipartite RNA motifs. BMC Mol Biol 10: 47. [DOI] [PMC free article] [PubMed] [Google Scholar]
- Guo H, Ingolia NT, Weissman JS, Bartel DP 2010. Mammalian microRNAs predominantly act to decrease target mRNA levels. Nature 466: 835–840 [DOI] [PMC free article] [PubMed] [Google Scholar]
- Hafner M, Landthaler M, Burger L, Khorshid M, Hausser J, Berninger P, Rothballer A, Ascano M Jr, Jungkamp AC, Munschauer M, et al. 2010. Transcriptome-wide identification of RNA-binding protein and microRNA target sites by PAR-CLIP. Cell 141: 129–141 [DOI] [PMC free article] [PubMed] [Google Scholar]
- Hausser J, Landthaler M, Jaskiewicz L, Gaidatzis D, Zavolan M 2009. Relative contribution of sequence and structure features to the mRNA binding of Argonaute/EIF2C–miRNA complexes and the degradation of miRNA targets. Genome Res 19: 2009–2020 [DOI] [PMC free article] [PubMed] [Google Scholar]
- Hausser J, Syed AP, Bilen B, Zavolan M 2013. Analysis of CDS-located miRNA target sites suggests that they can effectively inhibit translation. Genome Res 23: 604–615 [DOI] [PMC free article] [PubMed] [Google Scholar]
- Hofacker IL, Tafer H 2010. Designing optimal siRNA based on target site accessibility. Methods Mol Biol 623: 137–154 [DOI] [PubMed] [Google Scholar]
- Jan E, Motzny CK, Graves LE, Goodwin EB 1999. The STAR protein, GLD-1, is a translational regulator of sexual identity in Caenorhabditis elegans. EMBO J 18: 258–269 [DOI] [PMC free article] [PubMed] [Google Scholar]
- Jungkamp AC, Stoeckius M, Mecenas D, Grün D, Mastrobuoni G, Kempa S, Rajewsky N 2011. In vivo and transcriptome-wide identification of RNA binding protein target sites. Mol Cell 44: 828–840 [DOI] [PMC free article] [PubMed] [Google Scholar]
- Kazan H, Ray D, Chan ET, Hughes TR, Morris Q 2010. RNAcontext: A new method for learning the sequence and structure binding preferences of RNA-binding proteins. PLoS Comput Biol 6: e1000832. [DOI] [PMC free article] [PubMed] [Google Scholar]
- Kertesz M, Iovino N, Unnerstall U, Gaul U, Segal E 2007. The role of site accessibility in microRNA target recognition. Nat Genet 39: 1278–1284 [DOI] [PubMed] [Google Scholar]
- Khorshid M, Rodak C, Zavolan M 2010. CLIPZ: A database and analysis environment for experimentally determined binding sites of RNA-binding proteins. Nucleic Acids Res 39: D245–D252 [DOI] [PMC free article] [PubMed] [Google Scholar]
- Kishore S, Jaskiewicz L, Burger L, Hausser J, Khorshid M, Zavolan M 2011. A quantitative analysis of CLIP methods for identifying binding sites of RNA-binding proteins. Nat Methods 8: 559–564 [DOI] [PubMed] [Google Scholar]
- Lebedeva S, Jens M, Theil K, Schwanhäusser B, Selbach M, Landthaler M, Rajewsky N 2011. Transcriptome-wide analysis of regulatory interactions of the RNA-binding protein HuR. Mol Cell 43: 340–352 [DOI] [PubMed] [Google Scholar]
- Lee MH, Schedl T 2001. Identification of in vivo mRNA targets of GLD-1, a maxi-KH motif containing protein required for C. elegans germ cell development. Genes Dev 15: 2408–2420 [DOI] [PMC free article] [PubMed] [Google Scholar]
- Lee MH, Schedl T 2004. Translation repression by GLD-1 protects its mRNA targets from nonsense-mediated mRNA decay in C. elegans. Genes Dev 18: 1047–1059 [DOI] [PMC free article] [PubMed] [Google Scholar]
- Marin VA, Evans TC 2003. Translational repression of a C. elegans Notch mRNA by the STAR/KH domain protein GLD-1. Development 130: 2623–2632 [DOI] [PubMed] [Google Scholar]
- Mootz D, Ho DM, Hunter CP 2004. The STAR/Maxi-KH domain protein GLD-1 mediates a developmental switch in the translational control of C. elegans. Development 131: 3263–3272 [DOI] [PubMed] [Google Scholar]
- Petersen CP, Bordeleau ME, Pelletier J, Sharp PA 2006. Short RNAs repress translation after initiation in mammalian cells. Mol Cell 21: 533–542 [DOI] [PubMed] [Google Scholar]
- Rajewsky N, Vergassola M, Gaul U, Siggia ED 2002. Computational detection of genomic cis-regulatory modules applied to body patterning in the early Drosophila embryo. BMC Bioinformatics 3: 30. [DOI] [PMC free article] [PubMed] [Google Scholar]
- Ray D, Kazan H, Chan ET, Peña Castillo L, Chaudhry S, Talukder S, Blencowe BJ, Morris Q , Hughes TR 2009. Rapid and systematic analysis of the RNA recognition specificities of RNA-binding proteins. Nat Biotechnol 27: 667–670 [DOI] [PubMed] [Google Scholar]
- Ryder SP, Frater LA, Abramowitz DL, Goodwin EB, Williamson JR 2004. RNA target specificity of the STAR/GSG domain post-transcriptional regulatory protein GLD-1. Nat Struct Mol Biol 11: 20–28 [DOI] [PubMed] [Google Scholar]
- Scheckel C, Gaidatzis D, Wright JE, Ciosk R 2012. Genome-wide analysis of GLD-1-mediated mRNA regulation suggests a role in mRNA storage. PLoS Genet 8: e1002742. [DOI] [PMC free article] [PubMed] [Google Scholar]
- Schumacher B, Hanazawa M, Lee MH, Nayak S, Volkmann K, Hofmann ER, Hengartner M, Schedl T, Gartner A 2005. Translational repression of C. elegans p53 by GLD-1 regulates DNA damage-induced apoptosis. Cell 120: 357–368 [DOI] [PubMed] [Google Scholar]
- Siddharthan R, Siggia ED, van Nimwegen E 2005. PhyloGibbs: A Gibbs sampling motif finder that incorporates phylogeny. PLoS Comput Biol 1: e67. [DOI] [PMC free article] [PubMed] [Google Scholar]
- Sugimoto Y, König J, Hussain S, Zupan B, Curk T, Frye M, Ule J 2012. Analysis of CLIP and iCLIP methods for nucleotide-resolution studies of protein-RNA interactions. Genome Biol 13: R67. [DOI] [PMC free article] [PubMed] [Google Scholar]
- Ule J, Jensen KB, Ruggiu M, Mele A, Ule A, Darnell RB 2003. CLIP identifies Nova-regulated RNA networks in the brain. Science 302: 1212–1215 [DOI] [PubMed] [Google Scholar]
- van Nimwegen E 2007. Finding regulatory elements and regulatory motifs: A general probabilistic framework. BMC Bioinformatics 8 Suppl 6: S4. [DOI] [PMC free article] [PubMed] [Google Scholar]
- Wang X, Zhao Y, Wong K, Ehlers P, Kohara Y, Jones SJ, Marra MA, Holt RA, Moermann DG, Hansen D 2009. Identification of genes expressed in the hermaphrodite germ line of C. elegans using SAGE. BMC Genomics 10: 213. [DOI] [PMC free article] [PubMed] [Google Scholar]
- Wang X, Juan L, Lv J, Wang K, Sanford JR, Liu Y 2011. Predicting sequence and structural specificities of RNA binding regions recognized by splicing factor SRSF1. BMC Genomics 12 Suppl 5: S8. [DOI] [PMC free article] [PubMed] [Google Scholar]
- Wright JE, Gaidatzis D, Senften M, Farley BM, Westhof E, Ryder SP, Ciosk R 2011. A quantitative RNA code for mRNA target selection by the germline fate determinant GLD-1. EMBO J 30: 533–545 [DOI] [PMC free article] [PubMed] [Google Scholar]
- Xu L, Paulsen J, Yoo Y, Goodwin EB, Strome S 2001. Caenorhabditis elegans MES-3 is a target of GLD-1 and functions epigenetically in germline development. Genetics 159: 1007–1017 [DOI] [PMC free article] [PubMed] [Google Scholar]
- Yeo GW, Coufal NG, Liang TY, Peng GE, Fu XD, Gage FH 2009. An RNA code for the FOX2 splicing regulator revealed by mapping RNA-protein interactions in stem cells. Nat Struct Mol Biol 16: 130–137 [DOI] [PMC free article] [PubMed] [Google Scholar]
- Zhang C, Frias MA, Mele A, Ruggiu M, Eom T, Marney CB, Wang H, Licatalosi DD, Fak JJ, Darnell RB 2010. Integrative modeling defines the Nova splicing-regulatory network and its combinatorial controls. Science 329: 439–443 [DOI] [PMC free article] [PubMed] [Google Scholar]
- Zisoulis DG, Yeo GW, Pasquinelli AE 2011. Comprehensive identification of miRNA target sites in live animals. Methods Mol Biol 732: 169–185 [DOI] [PubMed] [Google Scholar]