Abstract
A combination of a microfluidic device with a light modulation system was developed to detect the oxygen consumption rate (OCR) of a single developing zebrafish embryo via phase-based phosphorescence lifetime detection. The microfluidic device combines two components: an array of glass microwells containing Pt(II) octaethylporphyrin as an oxygen-sensitive luminescent layer and a microfluidic module with pneumatically actuated glass lids above the microwells to controllably seal the microwells of interest. The total basal respiration (OCR, in pmol O2/min/embryo) of a single developing zebrafish embryo inside a sealed microwell has been successfully measured from the blastula stage (3 h post-fertilization, 3 hpf) through the hatching stage (48 hpf). The total basal respiration increased in a linear and reproducible fashion with embryonic age. Sequentially adding pharmacological inhibitors of bioenergetic pathways allows us to perform respiratory measurements of a single zebrafish embryo at key developmental stages and thus monitor changes in mitochondrial function in vivo that are coordinated with embryonic development. We have successfully measured the metabolic profiles of a single developing zebrafish embryo from 3 hpf to 48 hpf inside a microfluidic device. The total basal respiration is partitioned into the non-mitochondrial respiration, mitochondrial respiration, respiration due to adenosine triphosphate (ATP) turnover, and respiration due to proton leak. The changes in these respirations are correlated with zebrafish embryonic development stages. Our proposed platform provides the potential for studying bioenergetic metabolism in a developing organism and for a wide range of biomedical applications that relate mitochondrial physiology and disease.
INTRODUCTION
The zebrafish (Danio rerio) is an important vertebrate model organism, and zebrafish embryos offer many advantages over cell lines and isolated tissues. Small size, optical transparency of complex organs, and ease of culture make zebrafish embryos and larvae attractive organisms for in vivo genetic and toxicology studies.1 Recently, microfluidic devices have been used to systematically evaluate the phenotypic changes in zebrafish exposed to toxic and clinical drugs in a controlled physical and chemical environment.2, 3 Wlodkowic et al. proposed a miniaturized array system for automated trapping, immobilization, and microperfusion of zebrafish embryos.4, 5 The time-lapse imaging of the trapped embryos provides analytical developmental data for testing an anti-angiogenic compound. Yang et al.6 and Yu et al.7 developed a microfluidic array system combined with a concentration gradient generator for phenotype-based evaluations of the toxic and teratogenic potentials of clinical drugs on zebrafish; several morphological parameters of the developing embryos were precisely evaluated to determine the effects of the drugs. However, the phenotype-based evaluation in these studies merely used a high-resolution imaging system to qualitatively score the morphological changes in zebrafish caused by the toxic and clinical drugs. Quantitative in vivo measurements of the metabolic activity and mitochondrial function of zebrafish embryos are necessary to screen for the physiological effects of drugs and environmental agents on zebrafish embryos, especially during early life stages.
In cellular assays and bioreactors, the rapid determination of cell viability is frequently accomplished by monitoring cellular metabolic activity via oxygen consumption. Monitoring cellular oxygen consumption provides useful information when studying critical biochemical pathways, including mitochondrial function, apoptosis, metabolic alterations caused by various stimuli or diseases, and toxicological responses to various compounds.8 In our previous work, we developed a digital light modulation system that utilizes a modified commercial digital micromirror device (DMD) projector. The system is equipped with a UV light-emitting diode (LED) as a light modulation source and spatially directs excited light toward a microwell array device to measure the oxygen consumption rate (OCR) of single cells via phase-based phosphorescence lifetime detection.9 The in situ OCR variation of single cells infected by Dengue virus with different multiplicities of infection was also successfully measured in real time. However, the mitochondrial function in cell lines, tissues, and embryos was not monitored continually over long periods by sequentially adding pharmacological inhibitors of bioenergetic pathways in our previous work. Therefore, we attempt to continually monitor mitochondrial function in combination with metabolic inhibitors to assess bioenergetics in a physiologically relevant whole organism model, the zebrafish embryo. Due to their external development and small size, zebrafish embryos are particularly suitable for metabolic analysis.
Stackley et al. utilized a commercial microplate-based extracellular flux (XF-24) analyzer (Seahorse Bioscience Inc., USA) for respiration measurements to assay the mitochondrial and non-mitochondrial bioenergetics in developing zebrafish embryos.10 However, these measurements require the use of specialized 96-well microplates to perform the respiratory measurements; a capture screen is added on the top of each well to ensure that the embryos remain in the measurement chamber throughout the assay. A small chamber volume was temporarily created by lowering a piston-like probe into the well for the respiratory measurements. This microplate-based assay is a “semi-closed” design in which the temporary chamber is exposed to oxygen from the atmosphere, causing leakage. The oxygen leakage hampers the ability to measure the OCR of a single zebrafish embryo inside a well, especially for an embryo at an early development stage (3 hpf) with less oxygen consumption. The isolation of a single zebrafish embryo in a closed and small chamber is necessary to amplify the changes in oxygen consumption during an O2 measurement to measure the OCR of a single zebrafish embryo. The closed chamber prevents ambient oxygen to access the measurement volume; thus, the oxygen decrease within the chamber directly relates to the actual biological oxygen consumption.
In this study, a combination of a microfluidic device with a light modulation system was developed to detect the OCR of a single developing zebrafish embryo via phase-based phosphorescence lifetime detection. The microfluidic device combines two components: an array of glass microwells deposited with oxygen-sensitive luminescent layers and a microfluidic module with pneumatically actuated glass lids above the microwells to controllably seal the microwells of interest. The phosphorescence lifetime was calculated by measuring the phase shift between the reference (modulated excitation light) and corresponding phosphorescence signals to directly measure the luminescence decay time. The automated, pneumatically actuated glass lids allow for multiple, long-term measurements and are able to controllably seal the specific microwell of interest. The isolation of a single zebrafish embryo in a closed and small microwell enables us to measure the OCR of a single zebrafish embryo at an early development stage with less oxygen consumption. The OCR of a developing single zebrafish embryo inside a sealed microwell has been successfully measured from the blastula stage (3 h post-fertilization, hpf) through the hatching stage (48 hpf). Sequentially adding pharmacological inhibitors of bioenergetic pathways allows us to perform respiratory measurements of a single zebrafish embryo at key developmental stages and thus monitor changes in mitochondrial function in vivo that are coordinated with embryonic development. We have successfully performed the measurement of the bioenergetic profiles of a single developing zebrafish embryo at 3, 7, 12, 24, 36, and 48 hpf inside a microfluidic device. The total basal respiration is partitioned into the non-mitochondrial respiration, mitochondrial respiration, respiration due to adenosine triphosphate (ATP) turnover, and respiration due to proton leak. The ability to measure the metabolic partitioning of embryonic respiration among these subcategories can provide a better understanding of the root cause of mitochondrial dysfunction. Our proposed platform demonstrates the feasibility for the first time of studying bioenergetic metabolism in vivo in a single developing zebrafish embryo inside a microfluidic device, providing a physiologically relevant view of the in vivo respiration and metabolic profile.
MATERIALS AND METHODS
Principle of operation
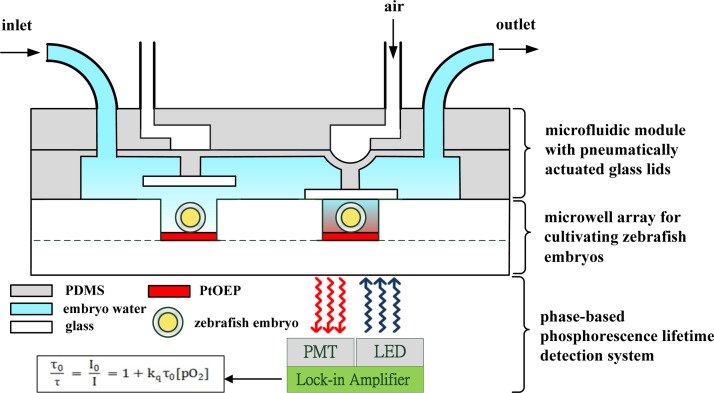
The microfluidic device combines two components: an array of glass microwells deposited with Pt(II) octaethylporphyrin (PtOEP) as the oxygen-sensitive luminescent layer and a microfluidic module with pneumatically actuated lids above the microwells to controllably seal the microwells of interest, as shown in Fig. 1. The developing zebrafish embryos were placed in each of the 2 × 2 glass microwells, which were 2.3 mm in diameter, 1 mm deep, and spaced 17 mm apart, as a proof of concept. Each microwell only can accommodate a single embryo, leaving little room for any movement. After the embryos settle down, a microfluidic module with pneumatically actuated lids was set above the microwells to controllably seal the microwells. An air-pressure system, described in our previous work,9 was used to pneumatically actuate the glass lids (5 mm in diameter) to controllably seal the microwells. A regulated compressed-air source was connected to multiple three-way solenoid valves (Lee Inc., United States), where each valve was controlled by a custom LabVIEW program (National Instruments, Inc.) to switch rapidly between atmospheric and input pressure. High pressure air was used to press a rounded glass lid attached to the end of a piston onto a single microwell to seal the microwell of interest (Fig. 1). The lid blocked any oxygen diffusion into or out of the microwell that contained the embryo. To measure the OCR of a single zebrafish embryo, especially for an embryo at an early development stage with less oxygen consumption, a single embryo must be isolated in a closed and small microwell to amplify the changes in oxygen consumption during an O2 measurement. After the release of the air pressure, the glass lids were raised within 1 s to open the microwell and replenish the microwell with fresh medium. The microfluidic device with the embryos was placed on a heating stage at 28.5 °C and was periodically perfused with fresh embryo water every 60 min through the inlet of the microfluidic module by a programmable peristaltic pump (TP-320, E-Chrom Tech Co., Taiwan) to maintain the survival of the zebrafish embryos during the long-term embryo development. For the examination of the metabolic profiles of a single zebrafish embryo, aqueous solutions containing specific pharmacological inhibitors of bioenergetic pathways can be introduced through the inlet of the microfluidic module at specific time-points (hpf) of embryonic development stages to monitor changes in mitochondrial function (Table TABLE I.).
Figure 1.
A schematic of a microfluidic device to detect the oxygen consumption rates of a single developing zebrafish embryo by tracking the oxygen concentration of the medium over time via phase-based phosphorescence lifetime detection. The microfluidic device combines two components: an array of glass microwells deposited with PtOEP as an oxygen-sensitive luminescent layer and a microfluidic module with pneumatically actuated lids above the microwells to controllably seal the microwells of interest. The phase-based phosphorescence lifetime detection system utilizes a light modulation system, which is equipped with a UV LED as a light modulation source. The long-term cellular OCR measurement was repeated over time via a periodic three-stage operation for replenishing the microwell with fresh medium, sealing the microwell, and measuring the oxygen concentration.
TABLE I.
The developmental stages of a zebrafish embryo and the OCR measured at these stages.
| hpf | Developmental stage | OCR (pmol O2/min/embryo) |
|---|---|---|
| 3 | Blastula | 20.23 |
| 7 | Gastrula | 32.64 |
| 12 | Segmentation | 42.16 |
| 24 | Segmentation/pharyngula transition | 63.45 |
| 36 | Mid-pharyngula | 99.25 |
| 48 | Hatching | 124.40 |
The OCR of a single developing zebrafish embryo inside a sealed microwell was measured by tracking the oxygen concentration of the medium over time via phase-based phosphorescence lifetime detection. To this end, we set up a light modulation system, which was equipped with a UV LED as a light modulation source, to direct the exciting light toward the microfluidic device. A programmable motorized X-Y stage was used to spatially direct the modulated excitation light toward the sealed microwell of interest for the OCR measurements. The phosphorescence lifetime was calculated by measuring the phase shift between the reference (modulated excitation light) and the corresponding phosphorescence signals to directly measure the luminescence decay time without the need for high-speed data acquisition hardware or complicated and expensive facilities. The relationship among the oxygen concentration, phase shift (θ), and lifetime (τ) is described in Sec. 2C. To enable repeatable and long-term OCR measurements, each OCR measurement of a single embryo inside a microwell was performed in a three-stage operation. In the first stage, denoted the O-stage, we raised the lid to unseal the microwell for a few minutes by releasing the air pressure in the microfluidic module to replenish the microwell with fresh medium, thus re-equilibrating and restoring the embryo to a normal status. In the second stage, denoted the S-stage, we lowered the lid to seal the microwell by applying air pressure and waiting for a few minutes for the embryo to stabilize before performing the OCR measurement. In the third stage, denoted the M-stage, we performed the OCR measurement for a preset period via phase-based phosphorescence lifetime detection. The long-term OCR measurement of a single embryo was repeated over time by periodically repeating the three-stage operation of replenishing the microwell with fresh medium, sealing the microwell, and measuring the oxygen concentration. The time for each stage was 60 s for the O-stage, 180 s for the S-stage, and 180 s for the M-stage, unless otherwise stated.
Fabrication of the microfluidic device
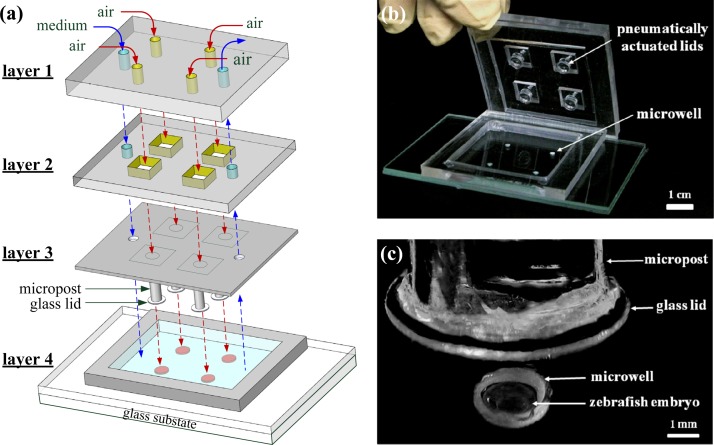
The microfluidic device combines two components: an array of glass microwells deposited with PtOEP and a microfluidic module with pneumatically actuated lids above the microwells to controllably seal the microwells of interest. Figure 2 shows an exploded drawing and images of the microfluidic device. The microfluidic device was assembled using three layers (layers 1–3) of polydimethylsiloxane (PDMS) structures to serve as a microfluidic module and one layer (layer 4) of a glass substrate with 2 × 2 microwells inside a PDMS microchamber. The glass substrate with 2 × 2 microwells was fabricated by a combination of two glass slides of 1 mm thickness. The top slide was first drilled by an emery drill-bit to form 2 × 2 holes that were 2.3 mm in diameter, 1 mm deep, and spaced 17 mm apart. The top slide was then irreversibly bonded with a flat glass slide at high temperature (550 °C). The glass microwells were chosen because their low diffusivity to oxygen increases the sensor stability and sensitivity.
Figure 2.
(a) An expanded drawing and (b) an image of the microfluidic device, which was assembled using three layers (layers 1–3) of PDMS structures that served as a microfluidic module and one layer (layer 4) of a glass substrate with 2 × 2 microwells inside a PDMS microchamber. (c) Close-up of one microwell containing a single 24 hpf zebrafish embryo.
Platinum octaethylporphyrin (PtOEP, λex = 381 nm, λem = 646 nm, from Aldrich, USA) was used as the oxygen-sensitive luminescent layer and was deposited into the microwells to monitor the oxygen concentration in each microwell. PtOEP displays strong room-temperature phosphorescence with a high quantum yield and long lifetime (ca. 100 μs). First, a 7 wt. % solution of polystyrene (PS, average MW of 280 000, from Aldrich, USA) dissolved in toluene and containing PtOEP at a concentration of 180 mM was prepared and spin-coated on the glass substrate with the 2 × 2 microwells at 1000 rpm for 30 s. The spin-coated films were dried at room temperature and stored in the dark prior to use. The PtOEP film on the surface of the glass substrate outside the microwells can be easily scraped and removed with a scalpel. The PtOEP film thickness on the bottom surface of the microwells was approximately 1 μm.
The microfluidic module with pneumatically actuated glass lids was assembled using the 3 layers (layers 1–3) of PDMS structures, as shown in Figs. 2a, 2b. For detailed descriptions of the fabrication of the microfluidic module, refer to our previous work on cellular OCR measurements.9 The aqueous solution (denoted with a blue dashed line) and air pressure (denoted with a red dashed line) can be introduced from layer 1 to layer 2 via six holes. Finally, the glass substrate with 2 × 2 microwells (layer 4) was adhered to the microfluidic module using double-sided adhesive (410 M, 3 M, USA) for ease of operation. For long-term operation, the microfluidic module and glass substrate were especially clamped between two PMMA plates to prevent the leakage. The glass substrate with 2 × 2 microwells was disposable, but the microfluidic module was able to be reused for each measurement.
Light modulation system for phase-based lifetime detection
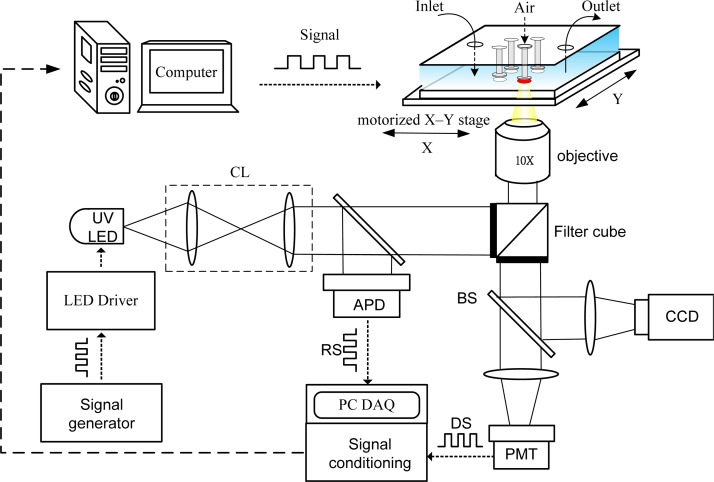
A schematic of the light modulation system for the phase-based phosphorescence lifetime detection is shown in Fig. 3. The light modulation system utilized a high power UV LED (390 nm, 3 W, EDISON OPTO) equipped with collimating lens as the light modulation source, and a programmable motorized X-Y stage was used to spatially direct the excitation light toward the sealed microwell of interest to determine the OCR via phase-based phosphorescence lifetime detection. The reference signal (RS) was recorded by measuring the light intensity of the modulated excitation light using an amplified photo-detector (ET-2030A, Electro-Optics Technology, Inc.) via a 50/50 beam splitter (BS). The detection signal (DS) was recorded by simultaneously measuring the light intensity of the corresponding phosphorescence with a photo-multiplier tube (PMT-R928, Hamamatsu) and a cooled CCD camera (CoolSNAP HQ2, Photometrics) in real time along with the reference LED signal. The RS from the modulated excitation light and the DS from phosphorescence were both recorded on a computer via a USB DAQ card (USB-6251, National Instruments), followed by a signal conditioning process. The excitation LED was modulated at 5 kHz, which enabled phase-based lifetime detection and low-frequency filtering to be performed with the signal conditioning circuitry to subtract any DC interference signal that resulted from ambient lighting. Detailed descriptions of the facility setup, data acquisition, and the phase-based phosphorescence lifetime detection have been reported in our previous work.9, 11
Figure 3.
A schematic of the light modulation system equipped with a UV LED as the light modulation source. A programmable motorized X-Y stage was used to spatially direct the modulated excitation light toward the sealed microwell of interest to determine the OCR via phase-based phosphorescence lifetime detection. (CL: collimating lens; BS: beam splitter; RS: reference signal; DS: detection signal; APD: amplified photo-detector; and PMT: photo-multiplier tube).
The phosphorescence lifetime was calculated by measuring the phase shift (θ) between the reference LED signal (modulated excitation light) and the detected phosphorescence signal to calculate the luminescence lifetime (τ) via phase-based phosphorescence lifetime detection. The relationship between the phase shift (θ) and the lifetime (τ) can be approximated by the following:
| (1) |
where ν is the modulation frequency. In this study, a modulation frequency of ν = 5 kHz was used to measure the luminescence decay time for phase-based phosphorescence lifetime detection. The phase shift (θ) between the reference and detected signals was determined by digital lock-in analysis. Calibration tests on the phase shift (θ) versus the dissolved oxygen (DO) concentration were performed by introducing DO concentrations of 0, 4, 8, 15, and 20 mg/l into the device. The luminescence lifetime (τ) was related to the DO concentration by the Stern–Volmer relationship.9
Organism and pharmacological inhibitors
The zebrafish (AB strain, obtained from the G.fish Animal Model Co., Taiwan) were housed in a ratio of 2 females to 1 male in stand-alone aquaria with a recirculating system. The fish were kept on a 14 h light/10 h dark cycle, and the culture temperature was set at 27 ± 1 °C, according to standard methods.12 Males and females were kept separate until the night before spawning. Then, the zebrafish embryos were collected in a sedimentation tank by the addition of purpose-built embryo traps prior to spawning. The newly fertilized embryos were transferred into Petri dishes filled with embryo water (60 mg/l, Instant Ocean salt in ddH2O). The fertilized embryos were maintained in an incubator at 28.5 °C and their development was measured in hours post-fertilization (hpf). We collected embryos at 3 hpf, 7 hpf, 12 hpf, 24 hpf, 36 hpf, and 48 hpf for experimentation. These time-points fall within the blastula (3 hpf), gastrula (7 hpf), segmentation (12 hpf), segmentation/pharyngula transition (24 hpf), mid-pharyngula (36 hpf), and hatching (48 hpf) stages of zebrafish embryonic development (Table TABLE I.).
Oligomycin, carbonyl cyanide 4-(trifluoromethoxy) phenylhydrazone (FCCP), and sodium azide were obtained from Sigma-Aldrich (St. Louis, MO). The final concentrations of the pharmacological inhibitors used in our experiments were prepared according to the data of Stackley et al.10 The final concentration of the oligomycin was 9.4 μM for all stages of embryos; 1.875 μM FCCP for 3–12 hpf and 2.5 μM FCCP for 24–48 hpf; and 6.25 μM sodium azide for 3–36 hpf and 1.25 μM sodium azide for 48 hpf. The pharmacological inhibitors, which were used at these final concentrations, were able to produce the maximum change in respiration without inducing death within the experimental timeframe. Concentrated stocks of oligomycin and FCCP were prepared in DMSO at 10 mM and 20 mM, respectively. A concentrated stock of sodium azide (5 M) was prepared in phosphate buffered saline.
EXPERIMENTAL RESULTS AND DISCUSSION
OCR of a single zebrafish embryo within a microwell
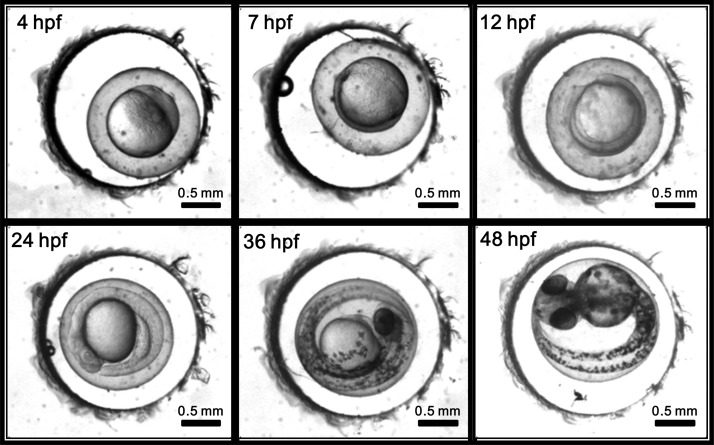
To check whether the proposed microfluidic device could be used as a platform for long-term culture, healthy embryos at 1 hpf were obtained and placed in the microwells. Each microwell accommodated a single embryo inside. The microfluidic device with embryos was placed on a heating stage at 28.5 °C and was periodically perfused with fresh embryo water every 60 min through the inlet of the microfluidic module to maintain the survival of the embryos. Figure 4 shows the images of a single developing embryo inside a microwell taken at various time points of development (hpf) to show the long-term development and survival. As shown in the figure, the embryos developed normally and grew from the blastula stage (3 hpf) to the hatching (48 hpf) stage inside a microwell, suggesting the feasibility of evaluating the OCR of a single developing zebrafish embryo inside a microfluidic device. We have successfully measured the OCR of a single developing zebrafish embryo inside a sealed microwell during the blastula (3 hpf), gastrula (7 hpf), segmentation (12 hpf), segmentation/pharyngula transition (24 hpf), mid-pharyngula (36 hpf), and hatching (48 hpf) stages.
Figure 4.
Images of a single developing embryo inside a microwell taken at various time points of development from the blastula (3 hpf) to the hatching (48 hpf) stage to show the long-term development and survival.
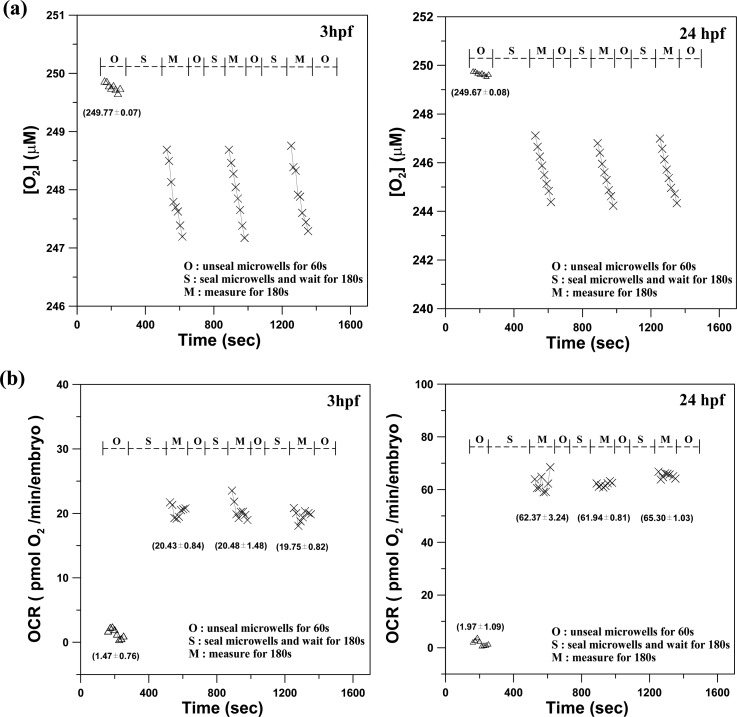
Figure 5a shows representative results of the aqueous oxygen concentration over time for a single developing zebrafish embryo, measured at 3 hpf and 24 hpf. At the start of the oxygen consumption measurement, we raised the lid for 3 min to replenish the microwell with fresh surrounding medium to re-equilibrate the embryo to normal status (O-stage). During the O-stage, the aqueous oxygen concentration was maintained at an approximately constant value of 249.7 μM over time. The oxygen consumed by a single embryo inside a microwell was not measurable in an open large chamber because the consumed oxygen was rapidly replenished by the surrounding medium. The lid was lowered to create a temporarily small, sealed chamber volume in the microwell during the S-stage. After waiting for a few minutes for the single embryo to stabilize, we performed the phase-based phosphorescence lifetime detection for 180 s to measure the aqueous oxygen concentration (M-stage). The aqueous oxygen concentration gradually decreased with time during the M-stage. The slight variation in the oxygen concentration consumed by a single embryo was successfully measured by diffusionally isolating a single embryo in a small, temporary chamber volume to amplify the changes in [O2] during the measurement. Using the microfluidic module to controllably seal the microwells, we successively performed 3 measurements by periodically sealing the glass microwell. Each measurement period involved the three-stage operation for replenishing the microwell with fresh medium (O-stage), sealing the microwell (S-stage), and measuring the oxygen concentration (M-stage). The impermeability of the sealed microwells to the surroundings was previously confirmed.9
Figure 5.
(a) The time variation of the oxygen concentration [O2] and (b) the oxygen consumption rate of a single developing zebrafish embryo (OCR(t), −d[O2]/dt) at 3 hpf and 24 hpf inside microwells for 3 successive measurements. These measurements were performed by a periodic three-stage operation of replenishing the microwell with fresh medium (O-stage), sealing the microwell (S-stage), and measuring the oxygen concentration (M-stage). (Mean ± SEM; n > 8).
To calculate transient changes in the oxygen consumption rate (OCR(t), -d[O2]/dt), time-based differentiation was used to calculate -d[O2]/dt from the measured [O2] time-lapse data shown in Fig. 5a. The measured [O2] time-lapse data were filtered using a 7-point wide, second-order polynomial, first-order derivative Savitzky-Golay kernel (0.107, 0.071, 0.036, 0, −0.036, −0.071, −0.107).13 This method provides additional smoothing of the calculated differentiated signal to alleviate the amplification of data noise during the -d[O2]/dt calculation. Figure 5b shows the oxygen consumption rate of a single embryo over time (OCR(t), in pmol O2/min/embryo) at 3 hpf and 24 hpf inside a microwell for the 3 successive measurements that were performed by periodically sealing the glass microwell. The measured OCR(t) presents the basal respiration, which is the minimal OCR required to support basic physiological functions. For the unsealed microwells (O-stage), the mean OCR remains at a value of approximately zero (1.47 ± 0.76 and 1.97 ± 1.09 pmol O2/min/embryo for 3 hpf and 24 hpf, respectively) due to the invariant oxygen concentration, as shown in Fig. 5a. The mean OCR values of a single developing embryo at 3 hpf were 20.43 ± 0.84, 20.48 ± 1.48, and 19.75 ± 0.82 pmol O2/min/embryo for the 3 successive measurements, which were performed by periodic sealing of the microwells. The mean OCR values of a single embryo at 24 hpf were 62.37 ± 3.24, 61.94 ± 0.81, and 65.3 ± 1.03 pmol O2/min/embryo. The mean OCR value calculated for each measurement period at 3 hpf and 24 hpf did not vary significantly over the repeated measurements. The repeatable and consistent measurements indicated that the oxygen measurements did not adversely affect the physiological state of the measured embryo. The average OCR values of a single embryo at 3 hpf and 24 hpf were 20.23 and 63.45 pmol O2/min/embryo, which are close to the values of 13.5 and 60.2 pmol O2/min/embryo that were previously validated by utilizing the commercial microplate-based XF-24 analyzer.10
Total basal respiration during the development of a single zebrafish embryo
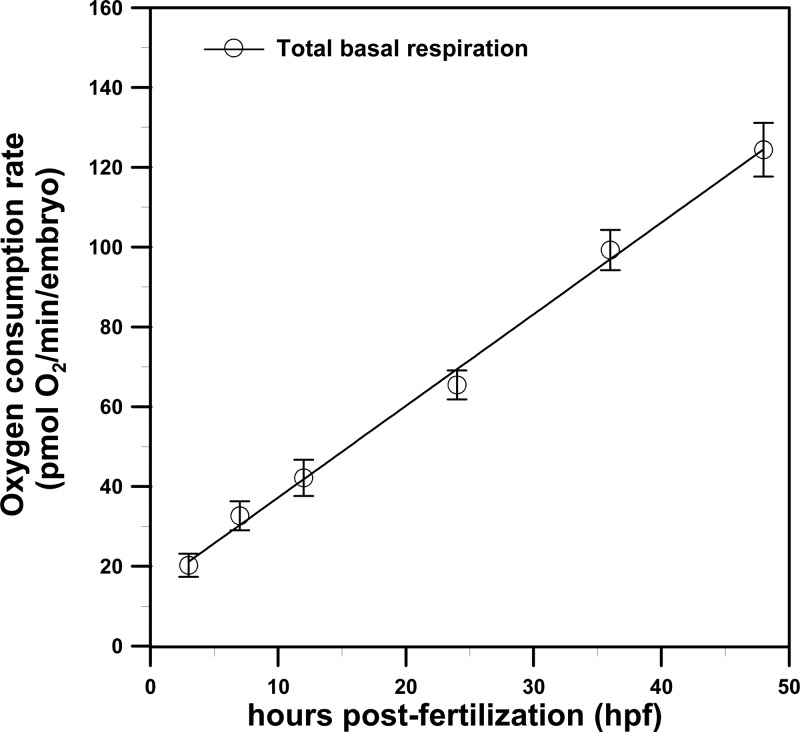
Figure 6 shows the total basal respiration (OCR, in pmol O2/min/embryo) during the development of a single zebrafish embryo for the blastula (3 hpf), gastrula (7 hpf), segmentation (12 hpf), segmentation/pharyngula transition (24 hpf), mid-pharyngula (36 hpf), and hatching (48 hpf) stages inside a microfluidic device. We performed four separate runs using the 2 × 2 glass microwells at each time point, and embryos from different breeding pairs were used to account for possible individual differences. As shown in Fig. 6, the total basal respiration increased in a linear and reproducible fashion with embryonic age from 3 to 48 hpf during zebrafish embryonic development. The linear increase in total respiration measured by our proposed method is consistent with previous reports.10, 14 The increase in total respiration has been proven for the most part to correspond to the increase in mitochondrial quantity with embryonic age, as measured by the mitochondrial protein, COX IV (an index of mitochondrial content).10
Figure 6.
The total basal respiration (OCR, in pmol O2/min/embryo) during the development of a single zebrafish embryo in the blastula (3 hpf), gastrula (7 hpf), segmentation (12 hpf), segmentation/pharyngula transition (24 hpf), mid-pharyngula (36 hpf), and hatching (48 hpf) stages inside a microfluidic device. (Mean ± SEM; n = 4 from 2 × 2 microwells).
Bioenergetic profiles of a single developing zebrafish embryo
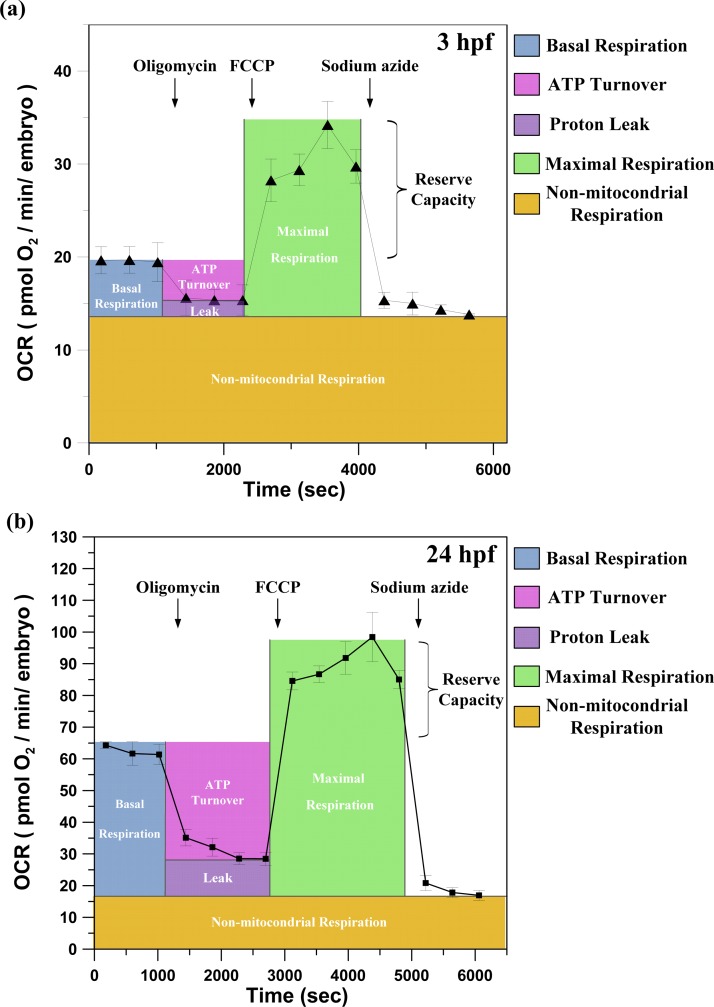
For the examination of the metabolic profiles of a single developing zebrafish embryo, aqueous solutions containing specific pharmacological inhibitors of bioenergetic pathways were sequentially introduced through the inlet of the microfluidic module at specific development time points (hpf) to monitor the in vivo changes in mitochondrial function that are coordinated with embryonic development. Figures 7a, 7b show representative results of the metabolic profiles of a single developing zebrafish embryo at 3 hpf and 48 hpf by sequentially adding pharmacological inhibitors of bioenergetic pathways. With the usage of the specific pharmacological inhibitors, the total basal respiration can be partitioned into non-mitochondrial respiration, mitochondrial respiration, respiration due to ATP turnover, and respiration due to proton leak. As shown in Figure 7, in the first series of measurements, the basal oxygen consumption of a single developing zebrafish embryo is established through three repeats of each O-stage (60 s)/S-stage (180 s)/M-stage (180 s) cycle. At the end of the third cycle, oligomycin, an inhibitor of mitochondrial ATP synthase, was introduced to inhibit adenosine diphosphate (ADP) phosphorylation and thus decrease respiration. The mechanism of oligomycin is to inhibit the proton channel of ATP synthase, thus blocking phosphorylation of ADP to ATP. This decrease in basal respiration (OCR) in response to oligomycin is then related to the proportion of mitochondrial activity that is coupled to ATP turnover. To estimate the maximal potential respiration sustainable by the zebrafish embryo, a proton ionophore (uncoupler) of FCCP was introduced into the device. Immediately upon exposure to the uncoupler, the oxygen consumption increased as the mitochondrial inner membrane became permeable to protons, and the electron transfer was no longer controlled by the proton gradient. An important feature emerging from this assay is the mitochondrial reserve capacity (also termed reserve or spare respiratory capacity), which is calculated by subtracting the FCCP-stimulated rate from the basal OCR. The reserve capacity is an index of the mitochondrial energy reserves that are in place to increase energy production in the face of increased bioenergetic demand during acute and chronic stress.15 Finally, treatment with sodium azide, which inhibits Complex I of the electron transport chain, blocks the respiratory chain; thus, only the non-mitochondrial fraction of the total basal respiration will be measured. We have successfully measured the metabolic profiles of a single developing zebrafish embryo at 3, 7, 12, 24, 36, and 48 hpf.
Figure 7.
The metabolic profiles of a single developing zebrafish embryo at (a) 3 hpf and (b) 48 hpf, measured by sequentially adding pharmacological inhibitors of bioenergetic pathways. The time courses are annotated to show the relative contribution of non-mitochondrial respiration, respiration due to ATP turnover, respiration due to proton leak, maximal OCR after the addition of FCCP, and reserve capacity of a single developing zebrafish embryo. (oligomycin: inhibits ATP synthase; FCCP: an uncoupler that allows maximal respiration; and sodium azide inhibits total mitochondrial respiration) (Mean ± SEM; n > 8).
Metabolic partitioning of embryonic respiration during various developmental stages
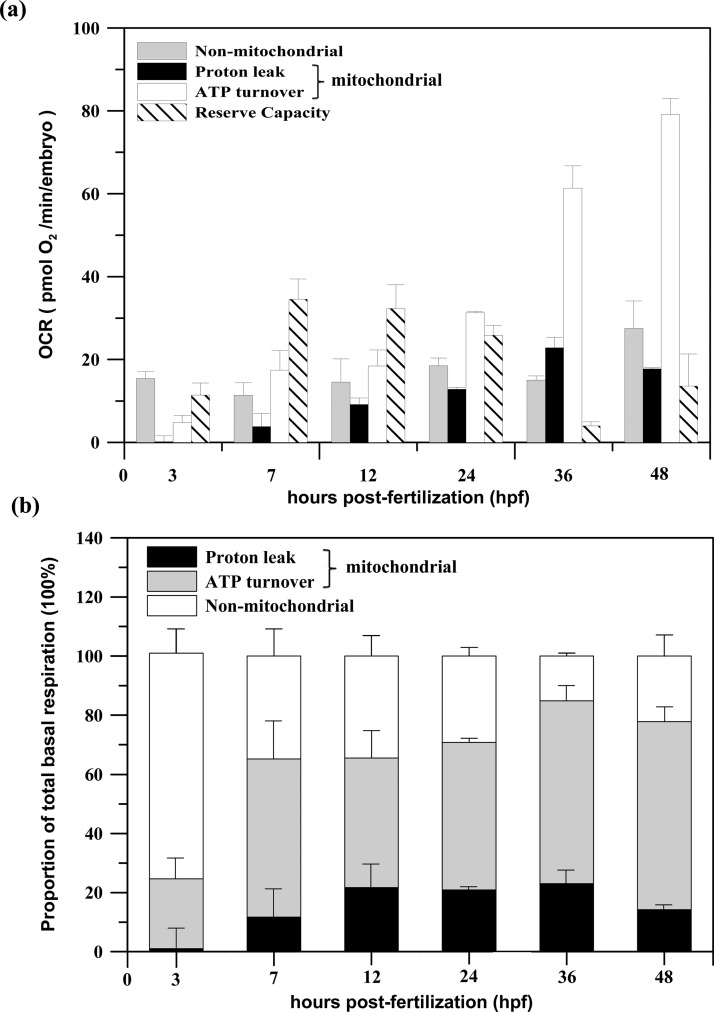
Figure 8a shows the variation of the components of the total basal respiration and the mitochondrial reserve capacity in pmol O2/min/embryo with developmental stage at 3, 7, 12, 24, 36, and 48 hpf. Total basal respiration is composed of a non-mitochondrial fraction and a mitochondrial fraction, which is further composed of the parts of the respiration associated with proton leak and with ATP turnover. By calculating the percentage that each fraction of respiration contributes to total the basal respiration (100%), the change of the partitioning of the total basal respiration with regard to the zebrafish embryonic development can be determined, as shown in Figure 8b. The proportion of the total respiration due to non-mitochondrial respiration (white, in Fig. 8) was greatest at 3 hpf in the blastula stage and then gradually decreased until 36 hpf. This observed result might be attributed to the rapid cell division in early embryogenesis, which requires a large amount of glycolysis-generated energy (non-mitochondrial respiration). Energy is produced by at a much faster rate by the glycolysis process than through oxidative phosphorylation (mitochondrial respiration). Glycolysis has previously been shown to be essential for very early embryonic development, and glycolysis significantly decreases with ages.16 Moreover, the lowest respiration due to proton leak (black) was found at 3 hpf, which lies just in the beginning of the process by which new mitochondria are formed in massive quantities in the cell (termed mitochondrial biogenesis).17 The proton leak through the fully developed mitochondrial inner membrane to the matrix can prompt mitochondrial respiration. Thus, the minimum in the leak levels at 3 hpf might be because these newly nascent mitochondria might not be fully developed or fully functional, thus stimulating increased mitochondrial respiration at the early embryo stage. We also found that the mitochondrial reserve capacity was greatest at 7 hpf in the gastrulation stage and then decreased with embryonic development (slash, in Fig. 8a). The highest observed FCCP response might be due to the significant increase in the number of these newly formed mitochondria at this stage. The increase in the mitochondrial mass has been proven to be one of the possible mechanisms for the increase in the mitochondrial reserve capacity.15 After 3 hpf, the mitochondrial respiration, which is associated with proton leak (black) and ATP turnover (gray), gradually increased. The high proton leak levels after 7 hpf, during the segmentation stage (10–24 hpf) of the embryo, indicate that the mitochondria are now fully functional.17 The moderately high proton leak could reduce free radical production and increase the sensitivity of metabolic reactions to effectors, which would benefit a developing embryo during the segmentation stage.18 Prior to hatching, increased cardiac activity at 48 hpf could result in the increase in both mitochondrial and non-mitochondrial respiration by decreasing the respiration due to proton leak.19
Figure 8.
(a) The variation in the components of the total basal respiration and the mitochondrial reserve capacity in pmol O2/min/embryo with developmental stage at 3, 7, 12, 24, 36, and 48 hpf. The total basal respiration is composed of a non-mitochondrial fraction and a mitochondrial fraction, which is further composed of the parts of respiration associated with proton leak and with ATP turnover. (b) The change in the partitioning of the total basal respiration with zebrafish embryonic development, determined by calculating the percentage that each fraction of respiration contributes to the total basal respiration (100%). (Mean ± SEM; n = 4 from 2 × 2 microwells).
The trend in the metabolic partitioning of embryonic respiration shown in Fig. 8 is consistent with reports by other groups who used the commercial microplate-based extracellular flux (XF-24) analyzer to assess respiration and the coupling of respiration to mitochondrial function.10 The mechanisms for the change in the mitochondrial and non-mitochondrial respiration correlated with zebrafish embryonic development still require intensive study in conjunction with other biochemical assays to provide additional information; determining these mechanisms could be outside the scope of this study. Our proposed platform demonstrates the feasibility for the first time of studying bioenergetic metabolism in vivo in a single developing zebrafish embryo inside a microfluidic device, providing a physiologically relevant view of the in vivo respiration and metabolic profile.
CONCLUSIONS
The proposed microfluidic device, which comprises an array of glass microwells and a microfluidic module with pneumatically actuated glass lids to controllably seal the microwells of interest, enables real-time OCR monitoring of a developing single zebrafish embryo via phase-based phosphorescence lifetime detection. The isolation of a single zebrafish embryo in a closed and small chamber enables us to amplify the changes in oxygen consumption for measurements of the OCR of a single zebrafish embryo at an early development stage with low oxygen consumption. We also demonstrated the capability of assaying mitochondrial and non-mitochondrial bioenergetics in the developing zebrafish embryo in our proposed platform by sequentially adding pharmacological inhibitors of bioenergetic pathways. We have successfully for the first time measured the bioenergetic profiles of a single zebrafish embryo from the blastula stage (3 hpf) through the hatching stage (48 hpf) inside a microfluidic device by monitoring oxygen consumption rates. Changes in mitochondrial and non-mitochondrial respiration are correlated with zebrafish embryonic development stages. The microfluidic device can be easily extended from the current proof of concept of the 2 × 2 glass microwells into large-scale microwell arrays (such as 96 and 384 microwells) for a high-throughput respirometric assay due to its ease of fabrication. Our proposed platform with high sensitivity and reproducibility provides the potential for studying bioenergetic metabolism in vivo in a developing organism and for a wide range of biomedical applications that relate mitochondrial physiology and disease, including reproductive biology, aquaculture research, production and testing of therapeutic agents, developmental biology, and aging.
ACKNOWLEDGMENTS
This work was partially supported by the National Science Council, Taiwan, through Grant NSC 102-2221-E-019-015-MY2.
References
- Ali S., Champagne D. L., Spaink H. P., and Richardson M. K., Birth Defects Res. C 93(2), 115–133 (2011). 10.1002/bdrc.20206 [DOI] [PubMed] [Google Scholar]
- Wlodkowic D., Khoshmanesh K., Akagi J., Williams D. E., and Cooper J. M., Cytometry, Part A 79A(10), 799–813 (2011). 10.1002/cyto.a.21070 [DOI] [PubMed] [Google Scholar]
- Sivagnanam V. and Gijs M. A. M., Chem. Rev. 113(5), 3214–3247 (2013). 10.1021/cr200432q [DOI] [PubMed] [Google Scholar]
- Akagi J., Khoshmanesh K., Evans B., Hall C. J., Crosier K. E., Cooper J. M., Crosier P. S., and Wlodkowic D., PLoS ONE 7(5), e36630 (2012). 10.1371/journal.pone.0036630 [DOI] [PMC free article] [PubMed] [Google Scholar]
- Khoshmanesh K., Akagi J., Hall C. J., Crosier K. E., Crosier P. S., Cooper J. M., and Wlodkowic D., Biomicrofluidics 6(2), 024102–024114 (2012). 10.1063/1.3699971 [DOI] [PMC free article] [PubMed] [Google Scholar]
- Yang F., Chen Z., Pan J., Li X., Feng J., and Yang H., Biomicrofluidics 5(2), 024115-024113 (2011). 10.1063/1.3605509 [DOI] [PMC free article] [PubMed] [Google Scholar]
- Choudhury D., van Noort D., Iliescu C., Zheng B., Poon K.-L., Korzh S., Korzh V., and Yu H., Lab Chip 12(5), 892–900 (2012). 10.1039/c1lc20351g [DOI] [PubMed] [Google Scholar]
- Hynes J., O'Riordan T. C., Curtin J., Cotter T. G., and Papkovsky D. B., J. Immunol. Methods 306(1–2), 193–201 (2005). 10.1016/j.jim.2005.09.003 [DOI] [PubMed] [Google Scholar]
- Huang S.-H., Hsu Y.-H., Wu C.-W., and Wu C.-J., Biomicrofluidics 6(4), 044118-044116 (2012). 10.1063/1.4772604 [DOI] [PMC free article] [PubMed] [Google Scholar]
- Stackley K. D., Beeson C. C., Rahn J. J., and Chan S. S. L., PLoS ONE 6(9), e25652 (2011). 10.1371/journal.pone.0025652 [DOI] [PMC free article] [PubMed] [Google Scholar]
- Huang S.-H., Tsai C.-H., Wu C.-W., and Wu C.-J., Sens. Actuators, A 165(2), 139–146 (2011). 10.1016/j.sna.2010.10.011 [DOI] [Google Scholar]
- Westerfield M., The Zebrafish Book. A Guide for the Laboratory Use of Zebrafish (Danio rerio) (University of Oregon Press, Eugene, 2000). [Google Scholar]
- Gerencser A. A., Neilson A., Choi S. W., Edman U., Yadava N., Oh R. J., Ferrick D. A., Nicholls D. G., and Brand M. D., Anal. Chem. 81(16), 6868–6878 (2009). 10.1021/ac900881z [DOI] [PMC free article] [PubMed] [Google Scholar]
- Mendelsohn B. A., Kassebaum B. L., and Gitlin J. D., Dev. Dyn. 237(7), 1780–1788 (2008). 10.1002/dvdy.21581 [DOI] [PMC free article] [PubMed] [Google Scholar]
- Hill B. G., Benavides G. A., J. R.Lancaster, Jr., Ballinger S., Dell'Italia L., Jianhua Z., and Darley-Usmar V. M., Biol. Chem. 393(12), 1485–1512 (2012). 10.1515/hsz-2012-0198 [DOI] [PMC free article] [PubMed] [Google Scholar]
- Facucho-Oliveira J. M. and St. John J. C., Stem Cell Rev. Rep. 5(2), 140–158 (2009). 10.1007/s12015-009-9058-0 [DOI] [PubMed] [Google Scholar]
- Beeson C. C., Beeson G. C., and Schnellmann R. G., Anal. Biochem. 404(1), 75–81 (2010). 10.1016/j.ab.2010.04.040 [DOI] [PMC free article] [PubMed] [Google Scholar]
- Rolfe D. F. and Brand M. D., Biosci Rep. 17(1), 9–16 (1997). 10.1023/A:1027327015957 [DOI] [PubMed] [Google Scholar]
- Jacob E., Drexel M., Schwerte T., and Pelster B., Am. J. Physiol. Regulatory Integrative Comp. Physiol. 283(4), R911–R917 (2002). 10.1152/ajpregu.00673.2001 [DOI] [PubMed] [Google Scholar]


