Abstract
A microfluidic diffusion diluter to create stable chemical gradients across an array of cell cultures was demonstrated. The device enabled concentration based studies to be conducted at 256 different concentrations across individual, low shear cell cultures. A gradient of staurosporine on cells stained with Mitotracker Deep Red (MTDR) showed a concentration-based effect on cell apoptosis across the cell culture array.
Introduction
Interactions between cells and the external environment play a vital role in drug discovery for various diseases.1 Extracellular components in the culture environment affect cell characteristics such as morphology, adhesion, locomotion, and gene expression.2 Numerous methods have been used to modulate the chemical environment of biological samples, including techniques such as electrochemistry,3 UV or laser irradiation,4,5 plasma polymerization, and microfluidic gradient systems.1,6–7 However, those methods require sophisticated and time-consuming fabrication methods in most cases.8 Microfluidic methods on the other hand have distinct advantages for gradient formation including low consumption of reagents, precise control of reactions, and high throughput fabrication of devices.8–13 Cell culture gradient systems should operate under sterile conditions, with temporally stable concentration gradients and minimal maintenance.14 When compared to other cell culture systems, microfluidic chips satisfy most of the requirements mentioned above. Several studies have shown microfluidic devices can be used to examine the effect of concentration gradients on cell proliferation, differentiation and signaling processes.12–16
Lateral concentration gradients can be generated by diffusional mixing of two or more laminar streams.10,16–21 Compared to convection-based gradient generators, diffusion- based gradient generators have minimal shear stress and preserve cell to cell communication.2, 20Locascio and coworkers21 introduced a diffusion-based gradient generator for cell assays. Although it showed stable gradient formation, the number of concentrations that could be tested on cells was limited.
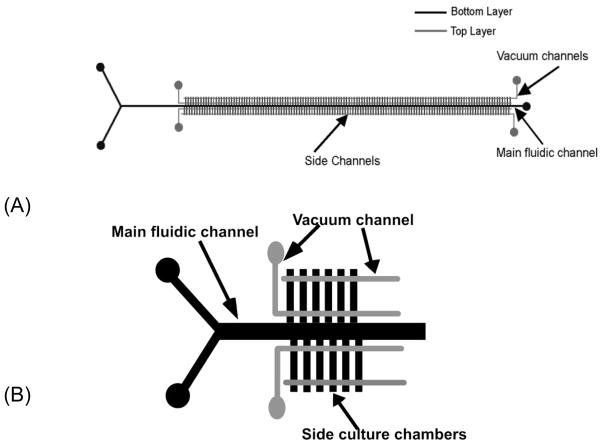
The Vanapalli group has recently described a system for generating tunable gradients across a two-phase droplet array.6 This approach can be used for screening cells as well as a host of other reaction or physical studies. In our own lab we have developed low-shear culture systems to study cell response to changes in environment and stimuli. In the present study, we have developed a diffusion diluter chip capable of generating a concentration gradient across 128 or 256 discrete culture chambers (Figure 1)
Figure 1.
(A) Schematic representation of microfluidic device to create the chemical gradient. Gray lines indicate control channels in the top layer. Black lines represent fluidic channels in the bottom layer. There are 128 repeat side channel units. (B) Enlarged image of a portion of the chip (not all culture chambers are shown).
Cremer and co-workers 22 first introduced a diffusion-based gradient generator to produce 11 streams of different concentrations. In this communication, we exploit diffusional mixing in a center channel, allowing a reagent and buffer to mix as a function of distance and to diffuse into culture channels. This low-shear geometry has been exploited by our group and others for stable cell culture and analysis.23–25 Since this chip design is capable of culturing colonies of cells under low shear stress, cells can be exposed to stable concentration gradients for long term.
To illustrate the application in this novel microfluidic device to a real time- cell based assay, we monitored the fluorescence intensity of cancer cells stained with Mitotracker Deep Red and exposed to a chemical gradient of staurosporine. These preliminary experiments show that the device is capable of generating gradients across cells, producing dose-response analyses over a hundreds of concentration values.
Experimental
Materials and Reagents
SU-8 2015 photoresist and developer were purchased from Micro Chem. Poly(dimethylsiloxane) (PDMS) and curing agent were purchased from Ellesworth Adhesives. Perfluorooctyltrichlorosilane was obtained from Alfa Aesar. Phosphate Buffered Saline (PBS, pH 7.4) was purchased from VWR. Fluorescein was purchased from Fluka. RPMI 1640 medium and fetal bovine serum were obtained from Hyclone. Penicillin-streptomycin stabilized solution was purchased from Sigma. Propidium iodide (PI) was purchased from Invitrogen.
Cells and cell culture
Ramos human lymphocytes (ATCC #CRL-1596) were obtained from American Type Culture Collection (ATCC). Ramos cells were maintained in culture flasks with RPMI 1640 medium supplemented with 10% fetal bovine serum and 20mL/L penicillin-streptomycin stabilized solution. The culture was incubated at 37°C and 5% CO2. Cells were subcultured weekly or as needed.
Device Fabrication
The design of the device (Fig. 1A) was drawn in software and printed out by CAD/Art services to create masks. The main fluidic mixing channel was 4.5 cm in length and 300 μm in width. Each side of the main channel had 128 side channels, each 1 mm in length and 150 μm in width. Control channels in the top layer were 4 cm in length and 150 μm in width. Molds for both layers were created on 4 inch diameter silicon wafers using SU-8 2015 photoresist. Wafers were spin coated to create molds with channel depths of ~38 μm. The surface of the silicon wafer was protected using perfluorooctyltrichlorosilane to finalize the mold.
The top layer (control layer) was made using a 5:1 ratio of PDMS pre-polymer and curing agent. The mixture was baked at 95 °C for 1 hour. A 20:1 mixture of PDMS pre-polymer and curing agent was used to create the lower, thin fluidic layer. The mixture was first poured onto a silicon wafer and spin coated at 2000 rpm for 30 s. The spin coated fluidic layer was baked for 30 min at 70 °C. After 45–60 minutes, holes were punched in the top layer and the two PDMS layers were then aligned. The two layers were baked at 120 °C for more than 3 hours to seal them together. After punching holes for inlet connections, the PDMS device was then sealed onto a glass slide using an oxygen plasma system.
Gradient Formation and Visualization
In order to visualize the concentration gradients, a stream of PBS with 1.4 μM fluorescein dye and a stream containing only PBS buffer were injected into the mixing channel at 0.02 mL/hr. The flow rates of the two streams were controlled by a syringe pump (KD Scientific) and allowed to run for 45 min to create a stable concentration gradient. Fluorescence observation was achieved using an inverted epifluorescence microscope (IX71, Olympus). Images were taken using a cooled CCD camera and analyzed using Image J (Version 1.45, National Institutes of Health).
Staurosporine Gradient and Apoptosis Assay
A Ramos cell suspension in RPMI 1640 medium was stained with Mitotracker Deep Red (0.1μM) for 45 min in the incubator at 37 °C. After 45 minutes, cells were resuspended in RPMI medium and were injected into the device. Cells were seeded into the culture channels using vacuum actuation.26 Extra cells in the main channel were washed away using RPMI medium. Once cells were loaded into the side channels, a stream of staurosporine (1μM) in RPMI medium and a stream of RPMI medium were injected into the mixing channel at 0.02 mL/hr for 30 min to establish a staurosporine gradient. The staurosporine stream was then switched to RPMI medium and flowed for another 30 minutes. Cells were then analyzed by epifluorescence microscopy.
Ethanol Gradient and Cell Viability Assay
Cells were seeded into the chip as mentioned previously. Once cells were loaded into the side channels, a stream of Ethanol (50%) and propidium iodide in PBS and a stream containing only propidium iodide in PBS were injected into the mixing channel at 0.02 mL/hr for 30 min to establish an ethanol gradient. Propidium iodide was used to stain dead cells for viability measurements.
Theory
Mixing of the two fluid streams occurs at the Y-junction (denoted as x = 0), and continuous along the main channel as a function of distance. The culture channel height is smaller than the width, and all culture channels are sealed at their distal ends. Therefore we can assume that the flow of fluid into the side channel is near zero and pressure is constant. Mass transport into and out of the culture channels occurs mainly via diffusion with a small convection component.23–27 Mixing of the compound of interest and buffer in the main fluidic channel is impacted by both diffusion and convection. We assume that flow is laminar along the chip length (0 < x < L, −h < y < h), and that the velocity of the flow is zero at the interface between the side channels and main channel (i.e. the main channel edge). The viscosity of both fluid streams is assumed to be equal (μ). In this case the y component of the velocity is equal to zero, and the x component of the velocity (u) and the gradient of the pressure for both substances are the same and are subjected to Poiseuille equation: 27
| (1) |
According to Fick’s law, the diffusion flux is proportional to the gradient of the concentration.28
| (2) |
where J is the diffusion flux, D is the anisotropic matrix of the diffusion coefficients, C is the concentration and (X,Y) is the position. Note the anisotropy inside main channel and inside microchannels are mutually inverse due to geometry.
Considering conservation of mass, the change in concentration can be expressed by:
| (3) |
| (4) |
For COMSOL simulations we assume that C = 1 on inlet and C = 0, on inlet . At the chip outlet, when X=L, we assume a mixed boundary condition.27 COMSOL is a simulation software package for various physics and engineering applications. This theoretical treatment will be used in future work to assist in calibration of concentrations throughout the chip.
Results and Discussion
The microfluidic device is shown in Figure 3A. Food coloring dyes were added for visualization. As the pumps injected liquid, diffusional mixing occurred as a function of distance. As seen in Figure 3A, the two dyes mixed together and created an orange color at the end of the main channel. Side channels on the red dye side of the stream decrease in red dye, but increase in green dye, as a function of distance. The opposite occurs in side channels on the green dye side of the stream. Simulation of the chip (Figure 3B) indicates a range of concentrations can be formed in the device.
Figure 3.

A) Photograph of a diffusion-diluter culture gradient chip (Scale bar = 1 cm). Red and green food coloring dyes were introduced into the device from the two inlets to aid in visualization. There were 128 repeating side channel units on each side of the main channel. As the dyes mix along the channel length, the local concentration in each culture channel differs from its neighbors. B) Simulation results for the diffusion diluter culture gradient chip, showing a range of concentrations across the device. Assume that dye concentration of the dye flow through upper side is equals to 1 and zero in the opposite side.
In order to visualize the stable gradient, we flowed fluorescein dye (1.4 μM) from one inlet and PBS buffer from the other inlet at 0.02 mL/hr. The solutions started diffusional mixing at the Y-junction of the main channel. In our device, diffusional mixing occurred over ~8 mm before the liquid streams interacted with the side channels (Figure 2).
Figure 2.
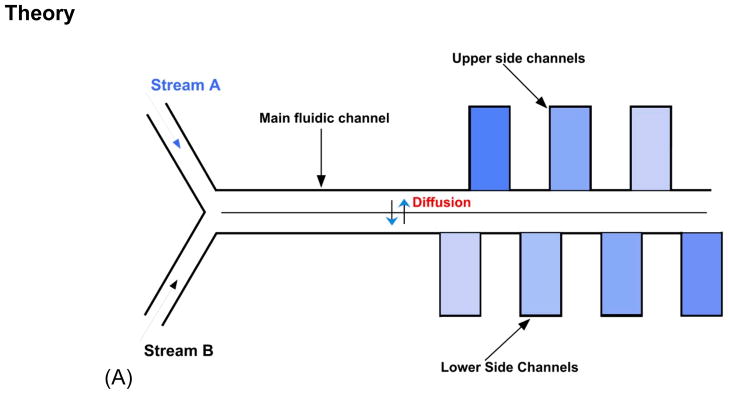
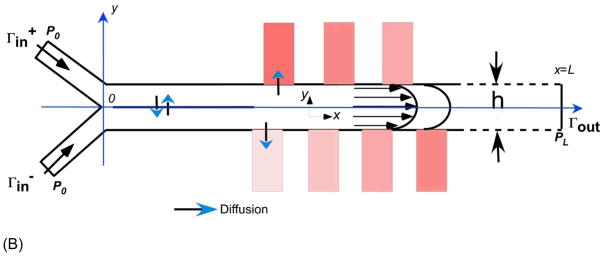
(A) Visualization of microfluidic diffusion diluter and how gradient generates. (B) Scheme of the domain for the simulation of fluid flow and diffusion-convection process in microfluidic diffusion diluter. Rectangles on each side of the main channel represent cell culture chambers. The color change represents changes in concentration along the laminar mixing channel. A table with values of parameters is listed as Supporting Information.
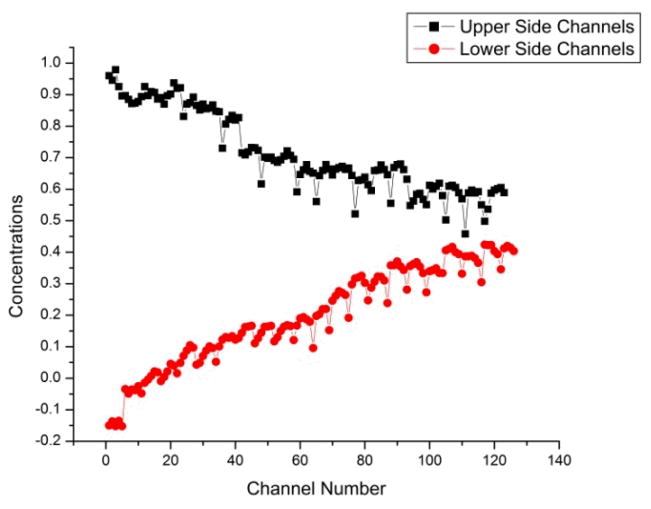
Figure 4 quantifies dye concentration for each side channel in both sides of the device. As seen in Figure 4, the concentration of the upper side channels decreased with distance, while it increased for lower side channels. As diffusional mixing occurred as a function of distance, fluorescein dye was diluted, thus the concentration decreased in the upper side channels. As the dye and buffer mixed along the main channel, the dye concentration increased in the lower side channel sets. Thus, we were able to create stable chemical gradient in a culture array microfluidic chip. In this case, there is a gap in the chemical gradient.
Figure 4.
The relationship between the concentration of the dye with distance along the chip (channel number). Black squares represent the concentration of the dye in upper side channels and red circles represent the concentration of the dye in lower side channels. Concentration values are obtained after the calibration of the chip.
According to the concentration values shown in Figure 4, at some position the concentrations of both the upper and lower side channels will equilibrate. In this case if the number of channels was increased up to 132 channels, the concentration gradient will be equilibrated at 132nd channel. This is calculated using the two equations given for each linear plot of the upper and lower side channel intensities (Figure 4). It is therefore possible by controlling fluid flow or using longer chips, to have a complete concentration gradient in a single chip.
When generating a chemical gradient, the device should be able to achieve a stable gradient quickly with long-term stability. In addition, the system should be capable of changing the concentration profile as needed. The system should also limit the exposure of cells to appreciable fluid flow and should also minimize reagent consumption.29 The chip used in this study was able to create stable chemical gradients in 30–90 min that could be maintained for long experiment durations (hours). Since the flow rates can be changed at any time this device was capable of changing the concentration profile in each channel while maintaining a gradient. The volume of each side channels was 5.7 nL. Therefore, reagent consumption was minimal and mass transport to side channels was rapid. This system has advantages over other systems, as cells can be exposed to gradients with less reagent consumption and with less shear stress on cells.29, 30 Although there are many diffusion based gradients introduced, those methods have not been able to minimize convection effects or cell shear stress.32, 33
The standard deviation of fluorescence under gradient conditions from the entrance to the back of a culture channel was 4.9 %. When there was no gradient, standard deviation of florescence intensity within the side channel was 4.8 % (see Supporting Information). Thus the difference in dye distribution along the length of an individual culture chamber was negligible, due in part to the small volume of each chamber. The difference in fluorescence intensity between neighboring culture chambers under non-gradient conditions was 3.9%. Therefore, we can assume that there was minimal variation in concentration within each side channel once the gradient was established. It is interesting to note that we were able to create fixed concentrations within each side channel. As we do not have to consider concentration variation inside the side channels, this approach can be applied to variety of cell culture experiments such as apoptosis assays, viability assays, as well as to measure cellular response to different drug concentrations.
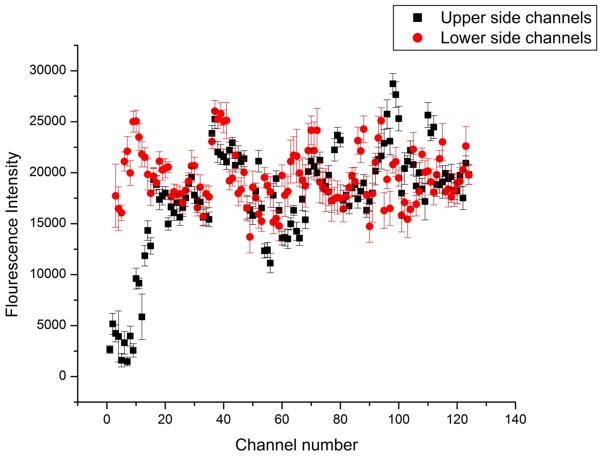
In this case, staurosporine (1 μM) in RPMI medium was introduced in the upper fluid stream and RPMI medium was introduced into the lower stream. MTDR is a fluorescent dye that stains mitochondria of live cells that is released in mitochondrial-mediated apoptosis.34 Mitochondrial membrane potential is decreased in apoptotic cells and protein release happens through opening of the mitochanodrial permeability transition pore.35 As a result of dilution of MTDR flourophore inside the cell, fluorescence intensity will decrease during apoptosis.36 As the staurosporine concentration decreased across the upper channel set, the rate of apoptosis of cells should decrease. Thus, the fluorescence intensity of MTDR increased as a function of distance (Figure 5). As seen in Figure 5, even though the MTDR intensity increased for first 20 channels of the upper side channel set as we expected, after that the intensity showed fluctuations rather than a gradual increase. These fluctuations are due largely to cell-to-cell variation. After the 20th cell culture channel, the concentration of staurosporine was too low to induce apoptosis during the duration of the experiment (45 minutes). COMSOL simulations were used to predict the concentration values of staurosporine in each channel. The predicted concentrations of staurosporine are 0.75 μM, 0.58 μM, 0.55 μM, 0.53 μM and 0.52 μM in 1st, 5th, 15th, 20th and 30th upper side channels, respectively. The concentration values obtained from simulation results showed a sharp decrease in concentration from the 1st channel to the 5th channel. When compared with the experimental results shown in Figure 5, the 1st to 20th upper side channels show a sudden increase in MTDR intensity, which corresponds to a decrease in staurosporine concentration. Although concentration values predicted here will be refined in future work, we can obtain an approximation of the change in drug concentration in different culture wells. In future work we will further validate our simulations and develop IC50 curves for drugs using hundreds of concentration points.
Figure 5.
The relationship of fluorescence intensity of Ramos cells stained with Mitotracker Deep Red (MTDR) and cultured in the chip under a staurosporine gradient. Under these experimental conditions, apoptosis was induced in the cells in culture channels 1–20 (denoted by reduced fluorescence in those channels), after which the concentration of staurosporine was too low to induce apoptosis in the experimental time frame (45 minutes).
We expect that longer analysis times or higher initial concentrations of staurosporine will yield steeper gradients. These effects will be explored in future work. With this preliminary study we have shown that this chip design was able to create a drug gradient on suspended cancer cells. An added benefit of our approach is that the gradient generating streams do not pass directly over cells, maintaining a low shear environment that will not affect cell function or behavior. In addition, this chip can be used with suspended cells and does not require an anchoring step.23
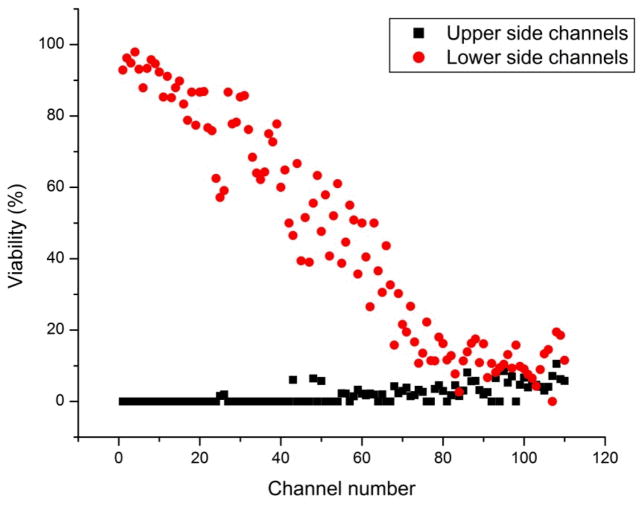
In order to demonstrate the effect of a broader gradient of an agent of interest on cells, an ethanol gradient was established in the chip. As expected, viability decreased along the lower side channels as ethanol concentration increased as a function of distance. Conversely, as ethanol concentration decreased along the upper stream, culture channels on that side of the chip showed increased viability as a function of distance. Ethanol was used as a proof of principle to show a range of viabilities across the culture wells. PI staining identified dead cells along the channel (Figure 6). As expected, the lower culture channels initially exposed to buffer showed high viability. Culture channels along the lower side of the chip showed decreased viability as the ethanol concentration increased. As the diffusion occurred between ethanol and PBS, the viscosity of the fluid passing through channels changed as a function of time. Thus a change of viscosity may cause velocity change for the fluid flow.37 Although viscosity change has an effect on fluid velocity, the purpose of this experiment was to show a steeper gradient effect on cells. Even though there is a change in velocity of fluid inside microchannels, that change could be negligible due to channel size and the fact that the end of each culture channel was sealed. In future work, we will model changes to fluid viscosity where applicable. Although a chemical gradient was established across the culture channels there were some fluctuations of concentrations in individual wells. These fluctuations are due in part to optical effects in the PDMS chip. We will develop a rapid calibration method to correct for channel-to-channel fluctuations and provide accurate concentration values for each culture channel. Using mathematical simulations we will validate the calibration method in order to find the local concentration in each side channel.
Figure 6.
Viability of Ramos cells cultured in the chip under an ethanol gradient. A gradient of 50% ethanol in Phosphate Buffer Saline was established across the chip (0–50% ethanol total range). In this case, 50% ethanol was introduced in the upper fluid stream and Phosphate Buffer Saline was introduced into the lower stream.
Conclusions
We have designed a microfluidic diffusion diluter to create stable chemical gradients in 256 cell cultures. Using this device in drug discovery will be more advantageous in terms of producing well-defined and reproducible gradients. Simulation results from COMSOL could be used to predict values of concentrations in drug discovery processes. Comparison between computational data and experimental results proved that we can create stable chemical gradient and find the correct concentration in each channel. The simplicity of this device in fabrication as well as in handling will be a distinct advantage in many cell-based assays. In addition, the small physical footprint, reduction in the amount of reagent used, and ability to provide gradient microenvironments to cells under low shear stress makes this approach attractive for a variety of cell-based studies.
Supplementary Material
Acknowledgments
We would like to thank Dr. Siva Vanapalli, of the Department of Chemical Engineering, for his thoughtful comments on this manuscript. This work was supported by grant from the National Institutes of Health (Grants RR025782 and GM103550) and the Robert A. Welch Foundation (Grant D-1667).
References
- 1.He J, Du Y, Villa-Uribe JL, Hwang C, Li D, Khademhosseini A. Adv Funct Mater. 2010;20:131–137. doi: 10.1002/adfm.200901311. [DOI] [PMC free article] [PubMed] [Google Scholar]
- 2.Keenan TM, Folch A. Lab on a Chip. 2008;8:34–57. doi: 10.1039/b711887b. [DOI] [PMC free article] [PubMed] [Google Scholar]
- 3.Zhang X, Gao X, Jiang L, Qin J. Langmuir. 2012;28(26):10026–32. doi: 10.1021/la300821r. [DOI] [PubMed] [Google Scholar]
- 4.Lo CT, Throckmorton DJ, Singh AK, Herr AE. Lab on a Chip. 2008;8:1273. doi: 10.1039/b804485f. [DOI] [PubMed] [Google Scholar]
- 5.Hypolite CL, McLernon TL, Adams DN, Chapman KE, Herbert CB, Huang CC, Distefano MD, Hu WS. Bioconjugate Chem. 1997;8:658. doi: 10.1021/bc9701252. [DOI] [PubMed] [Google Scholar]
- 6.Sun M, Bithi SS, Vanapalli SA. Lab Chip. 2011;11:3949–3952. doi: 10.1039/c1lc20709a. [DOI] [PubMed] [Google Scholar]
- 7.Weibel DB, Whitesides GM. Curr Opin Chem Biol. 2006;10:584–591. doi: 10.1016/j.cbpa.2006.10.016. [DOI] [PubMed] [Google Scholar]
- 8.Hartmann DM, Nevill JT, Wyrick D, Votaw GA, Crenshaw HC. Lab Chip. 2009;9:2332–2338. doi: 10.1039/b902291k. [DOI] [PubMed] [Google Scholar]
- 9.Dhumpa R, Roper MG. Analytica Chimica Acta. 2012;743:9–18. doi: 10.1016/j.aca.2012.07.006. [DOI] [PMC free article] [PubMed] [Google Scholar]
- 10.Kuhn P, Wilson K, Patch MG, Stevens RC. Curr Opin Chem Biol. 2002;6:704–710. doi: 10.1016/s1367-5931(02)00361-7. [DOI] [PubMed] [Google Scholar]
- 11.Chung BG, Lin F, Jeon NL. Lab Chip. 2006;6:764–8. doi: 10.1039/b512667c. [DOI] [PubMed] [Google Scholar]
- 12.Diao J, Young L, Kim S, Fogarty EA, Heilman SM, Zhou P, Shuler ML, Wu M, De Lisa MP. Lab Chip. 2006;6:381–388. doi: 10.1039/b511958h. [DOI] [PubMed] [Google Scholar]
- 13.Park JY, Kim SK, Woo D, Lee E, Kim J, Lee S. Stem Cells. 2009;27:2646–2654. doi: 10.1002/stem.202. [DOI] [PubMed] [Google Scholar]
- 14.Abhyankar VV, Lokuta MA, Huttenlocherb A, Beebe DJ. Lab Chip. 2006;6:389–393. doi: 10.1039/b514133h. [DOI] [PubMed] [Google Scholar]
- 15.Millera OJ, Harrak AE, Mangeat T, Bareta JC, Frenza L, Debsa BE, Mayota E, Samuelsc ML, Rooneyd EK, Dieue P, Galvand M, Linkc DR, Griffiths AD. PNAS. 2012;109:378–383. doi: 10.1073/pnas.1113324109. [DOI] [PMC free article] [PubMed] [Google Scholar]
- 16.Lynn NS, Tobet S, Henry CS, Dandy DS. Anal Chem. 2012;84:1360–1366. doi: 10.1021/ac202314n. [DOI] [PubMed] [Google Scholar]
- 17.Weigl BH, Bardell RL, Cabrera CR. Advanced Drug Delivery Reviews. 2003;55(3):349–77. doi: 10.1016/s0169-409x(02)00223-5. [DOI] [PubMed] [Google Scholar]
- 18.Dertinger SK, Chiu DT, Jeon NL, Whitesides GM. Anal Chem. 2001;73:1240–1246. [Google Scholar]
- 19.Jen CP, Hsiao JH, Maslov NA. Sensors. 2012;12:347–358. doi: 10.3390/s120100347. [DOI] [PMC free article] [PubMed] [Google Scholar]
- 20.Ruan J, Wang L, Xu M, Cui D, Zhou X, Liu D. Materials Science and Engineering. 2009;29:674–679. [Google Scholar]
- 21.Atencia JR, Cooksey GA, Locascio LE. Lab Chip. 2012;12:309–316. doi: 10.1039/c1lc20829b. [DOI] [PubMed] [Google Scholar]
- 22.Holdena A, Kumarb S, Castellanaa ET, Beskokb A, Cremer PS. Sensors and Actuators. 2003;92:199–207. [Google Scholar]
- 23.Liu K, Dang D, Harrington T, Bayer K, Pappas D. Langmuir. 2008;24:5955–5960. doi: 10.1021/la8003917. [DOI] [PubMed] [Google Scholar]
- 24.Liu K, Tian Y, Burrows SM, Reif RD, Pappas D. Analytica Chimica Acta. 2009;651:85–90. doi: 10.1016/j.aca.2009.08.007. [DOI] [PubMed] [Google Scholar]
- 25.Khanal G, Chung K, Solis-Wever X, Johnson B, Pappas D. The Analyst. 2011;136:3519–3526. doi: 10.1039/c0an00845a. [DOI] [PMC free article] [PubMed] [Google Scholar]
- 26.Kolnik M, Tsimring LS, Hasty J. Lab on a Chip. 2012;12:4732–4737. doi: 10.1039/c2lc40569e. [DOI] [PMC free article] [PubMed] [Google Scholar]
- 27.Kirby BJ. Micro- and Nanoscale Fluid Mechanics: Transport in Microfluidic Devices. 1. Cambridge University; 2010. [Google Scholar]
- 28.Philibert J. Diffusion Fundamentals. 2005;2:1.1–1.10. [Google Scholar]
- 29.Sahai R, Martino C, Castrataro P, Menciassi A, Ferrari A, Beltram F, Cecchini M. Microelectronic Engineering. 2011;88:1689–1692. [Google Scholar]
- 30.Irimia D, Geba DA, Toner M. Anal Chem. 2006;78:3472–3477. doi: 10.1021/ac0518710. [DOI] [PMC free article] [PubMed] [Google Scholar]
- 31.Amarie D, Glazier JA, Jacobson SC. Anal Chem. 2007;79:9471–9477. doi: 10.1021/ac0714967. [DOI] [PMC free article] [PubMed] [Google Scholar]
- 32.Jang Y, Hancock MJ, Kim SB, Selimovi S, Sim WY, Baeab H, Khademhosseini A. Lab Chip. 2011;11(19):3277–86. doi: 10.1039/c1lc20449a. [DOI] [PMC free article] [PubMed] [Google Scholar]
- 33.Kim C, Lee K, Kim JH, Shin KS, Lee K, Kim TS, Kang JY. Lab Chip. 2008;8:473–479. doi: 10.1039/b714536e. [DOI] [PubMed] [Google Scholar]
- 34.Scarletta JL, Sheardb PW, Hughesa G, Ledgerwooda EC, Kuc HH, Murphy MP. FEBS Letters. 2000;475(3):267–272. doi: 10.1016/s0014-5793(00)01681-1. [DOI] [PubMed] [Google Scholar]
- 35.Machado NG, Alves MG, Carvalho RA, Oliveira PJ. Cardiovasc toxicol. 2009;9:211–227. doi: 10.1007/s12012-009-9055-1. [DOI] [PubMed] [Google Scholar]
- 36.Iyer D, Ray R, Pappas D. 2012 submitted. [Google Scholar]
- 37.Wensink EJW, Hoffmann AC, van Maaren PJ, van der Spoel D. J Chem Phys. 2003;119(14):7308–7317. [Google Scholar]
Associated Data
This section collects any data citations, data availability statements, or supplementary materials included in this article.


