

Abstract
Objective
ABT-751, a novel orally available antitubulin agent, is mainly eliminated as inactive glucuronide (ABT-751G) and sulfate (ABT-751S) conjugates. We performed a pharmacogenetic investigation of ABT-751 pharmacokinetics using in-vitro data to guide the selection of genes for genotyping in a phase I trial of ABT-751.
Methods
UDP-glucuronosyltransferase (UGT) and sulfotransferase (SULT) enzymes were screened for ABT-751 metabolite formation in vitro. Forty-seven cancer patients treated with ABT-751 were genotyped for 21 variants in these genes.
Results
UGT1A1, UGT1A4, UGT1A8, UGT2B7, and SULT1A1 were found to be involved in the formation of inactive ABT-751 glucuronide (ABT-751G) and sulfate (ABT-751S). SULT1A1 copy number (> 2) was associated with an average 34% increase in ABT-751 clearance (P= 0.044), an 18% reduction in ABT-751 AUC (P = 0.045), and a 50% increase in sulfation metabolic ratios (P=0.025). UGT1A8 rs6431558 was associated with a 28% increase in glucuronidation metabolic ratios (P =0.022), and UGT1A4*2 was associated with a 65% decrease in ABT-751 Ctrough (P = 0.009).
Conclusion
These results might represent the first example of a clinical pharmacokinetic effect of the SULT1A1 copy number variant on the clearance of a SULT1A1 substrate. A-priori selection of candidate genes guided by in-vitro metabolic screening enhanced our ability to identify genetic determinants of interpatient pharmacokinetic variability.
Keywords: ABT-751, drug development, drug metabolism, pharmacogenetics, phase I, sulfotransferase, UDP-glucuronosyltransferase
Introduction
The face of drug development is developing rapidly toward biomarker-based approaches for enriching the population of responsive patients [1]. However, pharmacokinetics remain one of the most important determinants of the target–drug interaction, and inadequate drug concentration at the target might prevent drug activity. Most anticancer agents have wide interindividual pharmacokinetic variability, and their systemic exposure after standard doses can vary 2–10-fold among patients [2]. During drug development, the inability to predict the variation in exposure might prevent the identification of safe and effective dosing of the chemotherapy, leading to early termination of development programs.
The process by which new drugs are developed should be supported by the identification of the genetic component of pharmacokinetic variation. After the identification of the main elimination pathways from either animal disposition or mass balance studies in humans, we hypothesize that an economical and efficient approach would be to use preclinical data on drug disposition to inform a pharmacogenetic study. We applied this principle in a phase I trial of ABT-751.
ABT-751 is a novel oral antitubulin agent that binds to the colchicine-binding site of β-tubulin, a site distinct from that of other anticancer antimitotic drugs [3]. It has been evaluated in adult and pediatric patients with advanced cancer in phase I clinical trials [4–7]. Pharmacological data from early clinical trials show that the glucuronide (ABT-751G) and sulfate (ABT-751S) conjugates are two major and inactive metabolites of ABT-751 [8,9]. The area under the plasma concentration–time curves (AUCs) of the conjugated forms of ABT-751 were two- to three-fold higher than that of the parent compound [8], indicating a major role of phase II metabolism in ABT-751 clearance. Renal clearance of ABT-751 was negligible compared with the total clearance, indicating that ABT-751 is primarily eliminated through hepatic metabolism [8].
Human UDP-glucuronosyltransferase (UGT) and sulfotransferase (SULT) enzymes belong to two distinct superfamilies. Several human isoforms with overlapping specificities are responsible for the metabolism of numerous drugs, environmental toxins, and endogenous compounds [10]. Similar to many other substrates [11–13], germline genetic variation in UGT and SULT may impact the interpatient variability in the disposition of ABT-751. In this study, we demonstrate how to perform an optimized pharmacogenetic assessment of a novel anticancer agent during its early phase of development and to describe the pharmacogenetic associations.
Methods
Patients, study design, and treatment plan
Human investigations were performed after review and approval by the Biological Sciences Division/University of Chicago Hospitals Institutional Review Board and in accordance with Federal Wise Assurance for the protection of human participants. Participants provided written informed consent before being enrolled. Patients were eligible for the study if they had a solid tumor or non-Hodgkin lymphoma refractory to standard therapy. Patient characteristics are shown in Table 1. Details on the patient eligibility and evaluation, and results on safety and efficacy are reported in Supplemental digital content 1 (http://links.lww.com/FPC/A599). ABT-751 was administered orally once daily (QD) or twice daily (BID) for 21 consecutive days, followed by a 7-day recovery period (28-day cycle). The starting dose for the QD regimen was 25mg (flat dose), which was subsequently escalated to 50mg, and then in 50 mg increments thereafter. After 25 mg QD was found to be safe, the BID regimen was initiated in parallel with 25mg BID, with subsequent dose escalations by 25 mg BID. Dose escalation proceeded separately for QD and BID regimens. Three patients were initially enrolled at each dose level using a standard ‘3+3’ design [14]. If no patient experienced dose-limiting toxicity (DLT) during cycle 1, dose escalation proceeded to the next level. Results of the dose escalation and DLTs are reported in Supplemental digital content 2 (http://links.lww.com/FPC/A600).
Table 1.
Patient characteristics
| N | |
|---|---|
| Number of patients enrolled | 73 |
| With pharmacokinetic data | 66 |
| With pharmacokinetic data and genotype | 47 |
| Age (years) | |
| Median | 61 |
| Range | 29–80 |
| Sex | |
| Female | 31 |
| Male | 42 |
| Ethnicitya | |
| Caucasian | 54 |
| Black | 13 |
| Asian | 2 |
| Hispanic | 3 |
| Otherb | 1 |
| Cancer diagnosis | |
| Colorectal | 25 |
| Prostate | 9 |
| Mesothelioma | 5 |
| Other | 34 |
| Number of cycles/patient | |
| Median | 2 |
| Range | 1–13 |
| Dosing schedule | |
| Daily | 41 |
| Twice daily | 32 |
Self-reported ethnicity.
50% White Hispanic and 50% Native American.
Pharmacokinetics
Blood samples were collected on day 1 of the first administration at cycle 1 before dosing, and at 0.5, 1, 2, 4, 6, and 8 h after dosing. A predose sample was also obtained at day 15. Plasma concentrations of ABT-751, ABT-751G, and ABT-751S were measured using liquid chromatography with tandem mass spectrometry as described previously [8]. Pharmacokinetic parameters for ABT-751 were estimated using noncompartmental methods and included maximal concentration (Cmax), time to Cmax (Tmax), and the area under the concentration–time curve from 0 to the last time point (AUC0–8). Metabolic AUC ratios of metabolite over ABT-751 and clearance of ABT-751 (calculated as dose/AUC) were also determined. On day 15, plasma predose concentration (Ctrough) of ABT-751 was measured.
In-vitro screening of recombinant UGTs and kinetic analyses
Microsomes from recombinant UGT1A1, 3, 4, 6, 7, 8, 9, 10, and UGT2B4, 7, 15, 17, as well as negative control insect cell microsomes were obtained from BD Gentest (Woburn, Massachusetts, USA). Human liver microsomes (HLMs) (n=15) were prepared using differential centrifugation methods [15], with livers obtained with human participant approval through the Liver Tissue Procurement and Distribution System funded by NIH contract #N01-DK-9-2310. To screen for UGT activity, incubations were performed in duplicate for 120 min as described previously for morphine [16] using 300 mg of protein and 200 μmol/l ABT-751.
ABT-751G formation rates were measured at 277 nm by high-performance liquid chromatography (HPLC) using a YMC AM-312 C18 column (5 μm, 150 mm × 6.0 mm) and a YMC ODS-AM S-5 guard column (120 A, 4.0 × 20 mm; Waters Corp., Milford, Massachusetts, USA). The mobile phase consisted of acetonitrile (A) and 0.05 mol/l ammonium acetate (pH 5.5) (B) at 1.2 ml/min using the following gradient: 0–15 min 25% A and 75% B, 15.1–20 min from 25% A and 75% B to 75% A and 25% B, and 20.1–30 min 75% A and 25% B. ABT-751G standards (range: 1–125 μmol/l) were processed as described above. 4-Methyl-N-(4-nitrophenyl) benzene-sulfonamide (1.4 mmol/l; Sigma-Aldrich, St Louis, Missouri, USA) was used as an internal standard. Kinetic studies were carried out in duplicate with ABT-751 (0.01 to 1 mmol/l) using the selected UGTs that showed glucuronidation activity on the initial screen. Vmax was normalized by the relative protein expression as described previously [17]. Apparent kinetic values were calculated using SigmaPlot 9.0 (Systat Software Inc., Richmond, California, USA).
In-vitro screening of recombinant SULTs and kinetic analyses
cDNA sequences for human cytosolic SULT1A1*1, 1A1*2, 1A1*3, 1A2, 1A3/1A4, 1B1, 1C2, 1E1, 2A1, 2B1a, 2B1b, and 4A1 were used to transfect COS-1 cells [18]. SULT1A1*2 and *3 are variant isoforms of the SULT1A1*1 reference sequence isoform [19]. Cytosol preparations obtained from the transfected cells were used as the source of recombinant human SULT proteins using cells transfected with ‘empty’ vector as controls. Screening experiments were conducted with SULT isoforms, 0.4 μmol/l [35S]-PAPS, and a range of ABT-751 concentrations (0.0001–1 mmol/l), according to a previous study [20]. ABT-751 dissolved in DMSO served as the acceptor substrate. Kinetic experiments were conducted with recombinant SULT isoforms that showed appreciable activity with ABT-751 (0.2–1 mmol/l). Apparent kinetic values were calculated according to Cleland [21].
Genotyping of UGT and SULT variants
DNA and pharmacokinetic information was available from 47 patients. Twenty-one variants in the UGT1A1, UGT1A4, UGT1A8, UGT2B7, and SULT1A1 genes were selected for genotyping (Table 2) according to our in-vitro screen for ABT-751 conjugation. UGT genotyping methods and primers are listed in Supplemental digital content 1 (http://links.lww.com/FPC/A599) and Supplemental digital content 3 (http://links.lww.com/FPC/A601). Previously established genotyping methods were used for SULT1A1 single-nucleotide polymorphisms (SNPs) [24] and copy number variation [11]. UGT and SULT genotype frequencies and the analysis of Hardy–Weinberg equilibrium are described in Supplemental digital content 4 (http://links.lww.com/FPC/A602).
Table 2.
UGT and SULT variants selected for genotyping
| Gene | Rs number | Location | Variant | Base change | Genotyping method |
|---|---|---|---|---|---|
| UGT1A8 | rs1042597 | Exonic | UGT1A8*2 | 518 C>G | SBE-DHPLC |
| rs1042605 | Exonic | UGT1A8*1a | 765 A >G | SBE-DHPLC | |
| rs1551285 | Intronic | – | C> A | SBE-DHPLC | |
| rs6431558 | Intronic | – | T >C | SBE-DHPLC | |
| UGT1A4 | rs6755571 | Exonic | UGT1A4*2 | 70 C> A | SBE-DHPLC |
| rs12468274a | Exonic | – | 448 T>C | SBE-DHPLC | |
| rs2011404 | Exonic | – | 471 T>C | SBE-DHPLC | |
| rs871514 | Intronic | – | T >C | PCR-sequencing | |
| rs13401281 | Intronic | – | T >G | PCR-sequencing | |
| UGT1A1 | rs4124874 | 5′-UTR | – | – 3279 G> T | SBE-DHPLC [22] |
| rs10929302 | 5′-UTR | – | – 3156 G>A | SBE-DHPLC [22] | |
| rs4624373 | 5′-UTR | – | – 2951 A >G | SBE-DHPLC | |
| rs3755319 | 5′-UTR | – | – 1352 A >C | SBE-DHPLC | |
| rs8175347 | Promoter | UGT1A1*28 | (TA)5, 6, 7, 8 | PCR-sizing (GeneScan) [22] | |
| UGT2B7 | rs62298861 | Intronic | – | Int1 + 985 A >G | SBE-DHPLC [23] |
| rs7668258 | Promoter | – | – 161 T>C | SBE-DHPLC [23] | |
| SULT1A1 | rs3760091b | Promoter | – | – 624 G>C | Hebbring et al. [11] |
| rs750155 | Promoter | – | – 396 G> A | Hebbring et al. [11] | |
| rs9282861 | Exonic | SULT1A1*2 | 638 G> A | Hebbring et al. [11] | |
| rs1801030 | Exonic | SULT1A1*3 | 667 A >G | Hebbring et al. [11] | |
| Copy number (2, 3, 4, 5) | – | – | Copy number (2, 3, 4, 5) | Hebbring et al. [11] |
LD, linkage disequilibrium; SBE-DHPLC, single base extension-denaturing high-performance liquid chromatography; SULT, sulfotransferase; UGT, UD-Pglucuronosyltransferase; 5′-UTR, 5′-untranslated region.
In LD with UGT1A4*3.
In LD with SULT1A1*2.
Statistics and data analysis
The association between UGT and SULT variants and the pharmacokinetics of ABT-751 was assessed by linear regression. The primary analyses were carried out using the pharmacokinetic parameters at day 1 in patients of all ethnicities (self-reported). The pharmacokinetic parameters used in this analysis were the dose-normalized AUCs and Cmax of ABT-751, ABT-751G, and ABT-751S, the AUC metabolite/parent ratios, and ABT-751 clearance. We also analyzed the association between gene variants and dose-normalized ABT-751 Ctrough levels at day 15. To meet the assumption of a normal distribution of the data in the linear regression, pharmacokinetic parameters were natural log-transformed. To describe the magnitude of the SNP effect on ABT-751 pharmacokinetics, percent changes were calculated from untransformed data. The genetic association was tested for three models: recessive, dominant, and additive. For the associations that were significant in univariate analysis, we also tested the robustness of these associations using clinical demographics (which were significant in univariate analysis) as covariates in a multivariate analysis. The clinical demographics were sex, height, weight, and age. A P value less than 0.05 (two sided) was used as a cutoff for statistical significance, not corrected for multiple comparisons. Because of the small sample size and the number of comparisons, the P values for the associations are nominal. Hardy–Weinberg equilibrium was also evaluated for all the variants (P<0.01 for significance).
Results
Our approach started with screening 24 expression systems for human UGT and SULT enzymes for ABT-751 conjugation. Of the 12 UGTs, UGT1A1, UGT1A4, UGT1A8, and UGT2B7 could glucuronidate ABT-751 (Table 3). We compared the catalytic properties of the human UGTs highly expressed in the human liver with those from pooled HLMs. UGT1A1, UGT1A4, and UGT2B7 showed kinetics similar to those of HLMs. Expression systems for common variant isoforms of SULT1A1 were also tested for ABT-751 sulfation. Only SULT1A1*1, *2, *3, and SULT2b showed SULT activity against ABT-751. SULT1A1*2 and *3 showed reduced Vmax and increased Km (in particular SULT1A1*2) compared with SULT1A1*1, the reference sequence SULT1A1 enzyme. Despite showing sulfation activity toward ABT-751, SULT2B1b showed a very low Vmax compared with SULT1A1*1.
Table 3.
Apparent enzyme kinetics for glucuronidation and sulfation of ABT-751
| Microsomes or isoforms | Km (μmol/l) (mean±SE) | Vmax (pmol/min/mg) (mean±SE) | Vmax (U/mg protein)a (mean±SE) | Vmax/Km (μl/min/mg) (unnormalized) | Relative level of expressed proteinb | Relative Vmax | Relative Vmax/Km (μl/min/mg) (normalized) |
|---|---|---|---|---|---|---|---|
| Pooled HLM | 114.2±16.2 | 150.9±6.5 | – | 1.3 | – | – | – |
| UGT1A1 | 82.8±7.8 | 60.0±1.7 | – | 0.7 | 0.4 | 150.0 | 1.8 |
| UGT1A4 | 43.3±5.3 | 54.3±1.5 | – | 1.3 | 0.6 | 90.5 | 2.2 |
| UGT1A8 | 36.7±7.1 | 141.9±5.7 | – | 3.9 | 1 | 141.9 | 3.9 |
| UGT2B7 | 58.4±4.5 | 41.8±0.8 | – | 0.7 | – | – | – |
| SULT1A1*1 | 88.4±18.0 | – | 25.3±2.7 | – | – | – | – |
| SULT1A1*2 | 164.8±16.7 | – | 5.4±0.4 | – | – | – | – |
| SULT1A1*3 | 109.0±8.3 | – | 3.7±0.2 | – | – | – | – |
| SULT2B1b | 120.6±6.4 | – | 0.8±0.002 | – | – | – | – |
HLM, human liver microsomes; Km, Michaelis constant; SULT, sulfotransferase; UGT, uridine 5′-diphosphoglucuronosyltransferase; Vmax, maximum velocity.
One unit of enzyme activity represents the formation of 1 nmol of acceptor sulfate per hour of incubation at 37°C.
The expression of UGT1A8 was expressed arbitrarily as the basal UGT1A expression level.
The screening of candidate isoforms led to the selection of the UGT1A1, UGT1A4, UGT1A8, UGT2B7, and SULT1A1 genes for genotyping in cancer patients phenotyped for ABT-751 pharmacokinetics. Of these five genes, variants were selected according to a combination of different criteria, including their expected frequency in a European population (alleles with a frequency of 0.10 or higher), evidence of functionality, and haplotype tagging from available resequencing data. This approach led to the selection of 21 variants for genotyping.
Using both parent drug and metabolite pharmacokinetics, we tested the association between selected gene variants and interpatient variability in ABT-751 disposition. SULT1A1 copy number variation (>2 SULT1A1 gene copies) was associated with an average 18% reduction in ABT-751 AUC (P=0.045, n=42), a 34% increase in ABT-751 clearance (P=0.044, n=42), and a 50% increase in sulfation metabolic ratios (P=0.025, n=42; Fig. 1a–c). The number of SULT1A1 copies (i.e. 2 vs. 3 vs. 4 vs. 5) was also associated with increased sulfation metabolic ratios, showing a clear gene–dosage effect (P=0.027, n=42; Fig. 1d). UGT1A8 rs6431558 was associated with a 28% increase in glucuronidation metabolic ratios (P=0.022, n=47; Fig. 2a). UGT1A4*2 was associated with a 65% reduction in Ctrough (P=0.009, n=37; Fig. 2b). None of the clinical demographics had any effect on the pharmacokinetic parameters described in the above associations in univariate analysis (P>0.05, data not shown). They were not tested in multivariate analysis. None of the other gene variants showed an association with ABT-751 pharmacokinetic parameters (P>0.05, data not shown). Because of the small sample set, we did not test for a correlation between SNPs and the presence of DLT. Patients with DLT had higher dose-normalized ABT-751 AUC (mean±SD=0.21±0.05 h/l, n=7) than patients who did not experience DLT (0.16±0.05, n=40; P=0.03). At the dose intervals tested in this study, the pharmacokinetics of ABT-751 (Table 4) is linear, consistent with previous reports [8,25].
Fig. 1.

SULT1A1 genetic association with ABT-751 pharmacokinetics. Association between 2 vs. >2 SULT1A1 copy number and (a) ABT-751 AUC, (b) ABT-751 clearance, and (c) sulfation metabolic ratios (ABT-751S AUC/ABT-751 AUC). Association of 2 vs. 3 vs. 4 vs. 5 SULT1A1 copy number and sulfation metabolic ratios (d). Natural log-transformed data are shown. Horizontal lines represent the mean value of the log-transformed data.
Fig. 2.
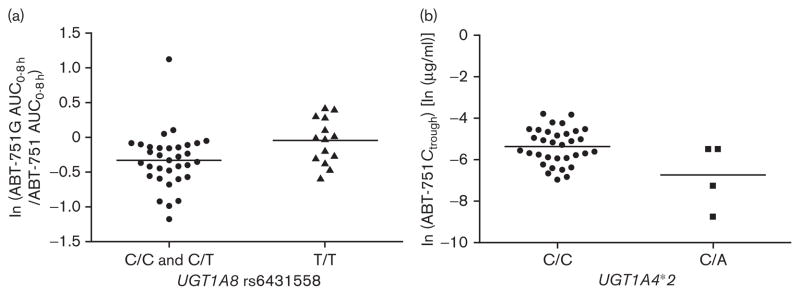
UGT1A4 and UGT1A8 genetic associations with ABT-751 pharmacokinetics. Associations between (a) UGT1A8 rs6431558 and glucuronidation metabolic ratios (ABT-751G AUC/ABT-751 AUC) and (b) UGT1A4*2 and ABT-751 Ctrough. Natural log-transformed data are shown. Horizontal lines represent the mean value of the log-transformed data.
Table 4.
Pharmacokinetic results
| Regimen | Analyte | ABT-751 dose (mg) | Cycle 1 Day 1 |
Cmax (μg/ml) | AUC0–8 (μg*h/ml) | Tmax (h) | CL (L/h) | Cycle 1 Day 15 |
Ctrough (μg/ml) |
|---|---|---|---|---|---|---|---|---|---|
| N | N | ||||||||
| QD | ABT-751 | 150 | 2 | 5.99±3.65 | 17.68±1.61 | 1.3±1.1 | 8.52±0.77 | 2 | 0.84±0.51 |
| 200 | 23 | 9.06±4.54 | 32.00±10.97 | 2.0±1.3 | 7.25±3.59 | 19 | 0.54±0.45 | ||
| 250 | 3 | 10.92±3.34 | 45.54±10.46 | 1.3±0.6 | 5.70±1.40 | NA | – | ||
| BID | ABT-751 | 25 | 1 | 2.03 | 5.54 | 0.75 | 4.51 | 1 | 0.26 |
| 50 | 2 | 4.23±1.00 | 13.19±2.13 | 0.8±0.3 | 3.84±0.62 | 1 | 0.48 | ||
| 100 | 10 | 5.60±2.18 | 18.47±4.96 | 2.5±2.6 | 6.05±2.80 | 8 | 1.09±0.60 | ||
| 125 | 6 | 4.98±1.96 | 19.80±5.14 | 1.7±0.5 | 6.76±2.14 | 6 | 1.16±0.77 | ||
| QD | ABT-751G | 150 | 2 | 2.64±0.17 | 15.45±0.86 | 4.0±0.0 | 9.72±0.54 | 2 | 2.56±1.34 |
| 200 | 23 | 4.55±1.68 | 25.70±11.10 | 4.5±2.2 | 9.56±5.4 | 19 | 2.07±1.28 | ||
| 250 | 3 | 4.47±1.28 | 27.65±9.30 | 3.3±2.3 | 9.66±2.78 | NA | – | ||
| BID | ABT-751G | 25 | 1 | 0.65 | 4.24 | 4.0 | 5.89 | 1 | 1.00 |
| 50 | 2 | 1.44±0.49 | 8.44±2.89 | 5.0±1.4 | 6.29±2.16 | 1 | 3.28 | ||
| 100 | 10 | 3.28±2.48 | 18.28±15.02 | 4.7±2.3 | 8.05±4.56 | 8 | 7.23±11.10 | ||
| 125 | 6 | 3.18±1.56 | 17.28±8.31 | 4.7±2.4 | 8.99±5.23 | 6 | 3.65±1.47 | ||
| QD | ABT-751S | 150 | 2 | 4.16±1.22 | 25.16±10.13 | 4.0±0.0 | 6.49±2.61 | 2 | 3.24±2.75 |
| 200 | 23 | 7.37±3.16 | 38.12±16.08 | 4.0±2.4 | 6.56±4.80 | 19 | 2.07±1.24 | ||
| 250 | 3 | 8.18±3.53 | 39.01±12.80 | 3.0±2.6 | 6.94±2.48 | NA | – | ||
| BID | ABT-751S | 25 | 1 | 0.85 | 5.87 | 4.0 | 4.26 | 1 | 1.40 |
| 50 | 2 | 1.80±0.00 | 11.09±0.33 | 4.0±2.8 | 4.51±0.14 | 1 | 1.70 | ||
| 100 | 10 | 3.44±1.53 | 20.03±11.47 | 4.6±2.1 | 8.16±8.63 | 8 | 5.31±5.73 | ||
| 125 | 6 | 4.52±2.27 | 23.70 ± 9.67 | 3.7±2.0 | 6.28±3.22 | 6 | 4.18±1.73 | ||
| QD | ABT-751G/ABT-751 | 150 | 2 | – | 0.88±0.03 | – | – | – | – |
| 200 | 23 | – | 0.83±0.31 | – | – | – | – | ||
| 250 | 3 | – | 0.60±0.10 | – | – | – | – | ||
| BID | – | 25 | 1 | – | 0.77 | – | – | – | – |
| 50 | 2 | – | 0.63±0.12 | – | – | – | – | ||
| 100 | 10 | – | 1.00±0.77 | – | – | – | – | ||
| 125 | 6 | – | 0.85±0.29 | – | – | – | – | ||
| QD | ABT-751S/ABT-751 | 150 | 2 | – | 1.40±0.45 | – | – | – | – |
| 200 | 23 | – | 1.33±0.85 | – | – | – | – | ||
| 250 | 3 | – | 0.84±0.09 | – | – | – | – | ||
| BID | – | 25 | 1 | – | 1.06 | – | – | – | – |
| 50 | 2 | – | 0.85±0.11 | – | – | – | – | ||
| 100 | 10 | – | 1.13±0.56 | – | – | – | – | ||
| 125 | 6 | – | 1.21±0.47 | – | – | – | – |
Data are expressed as mean±SD.
ABT-751G, ABT-751 glucuronide; ABT-751S, ABT-751 sulfate; AUC0–8, partial area under the plasma concentration–time curve from time 0 to 8 h; BID, twice daily; CL, clearance; Cmax, maximum observed plasma concentration; Ctrough, plasma predose concentration at day 15; NA, not available; QD, once daily; Tmax, time to Cmax.
Discussion
The knowledge of the key determinants of drug disposition can facilitate the development of biomarkers to individualize drug dosing. In particular, for first-in-human studies, a typical preclinical in-vitro analysis for a new molecular entity may cover only CYP450s and p-glycoprotein [26]. Only recently has the FDA provided guidance for including UGTs in the panel of screened enzymes [27]. These screenings aim to identify the potential for drug–drug interactions, rather than select candidate genes for genotyping in early studies.
However, when a drug is mainly eliminated by conjugation, such as ABT-751, a different set of assays should be run to elucidate the specific metabolic isoforms likely to inactivate the drug in question. Available prediction models based on structure similarity to known probes are not accurate enough to predict substrate specificity of the major enzymes of metabolism. We have performed several enzyme screenings using expression systems and liver fractions, allowing the identification of the candidate genes of drug disposition for future investigation [16,17,28–31]. This prioritization significantly narrowed the number of genes to be interrogated for common variation in patients receiving pharmacological treatment, and has led to germline biomarkers of clinical use, such as the UGT1A1*28 allele [22]. This model was applied successfully to ABT-751, a novel oral antitubulin agent.
One of the major factors responsible for interpatient variability in pharmacokinetics is the presence of functional variants in genes of drug metabolism. For ABT-751, the main elimination pathway is through glucuronidation and sulfation into inactive metabolites [8]. The UGT and SULT superfamilies combined comprise more than 25 human isoforms. In this study, the in-vitro activity screens for ABT-751 conjugation led us to identify the major genes responsible for ABT-751 conjugation. This approach restricted the genetic investigation of associations with pharmacokinetics to only five candidate genes, instead of interrogating all the 25 UGTs and SULTs, reducing incremental costs and limiting the number of testable hypotheses.
Pharmacogenetic associations might be pharmacologically relevant when performed in a setting of carefully selected genes, established SNP functionality, and detailed pharmacokinetic assessment. For example, despite the small number of patients in our study and potential confounding of dose escalation, SULT1A1 copy number variation was shown to affect ABT-751 disposition. Increased copy numbers of SULT1A1 increased the clearance of the parent drug through sulfation into inactive and more easily extracted sulfated metabolites of ABT-751. By measuring the AUC of the ABT-751 sulfated metabolite, we were able to confirm that this effect is mediated through sulfation, as the ABT-751 sulfation ratios increased in parallel with the increase in the number of SULT1A1 copies (Fig. 1d). The SULT1A1 gene–dosage effect on the ABT-751 metabolic ratios strikingly mirrors previous observations on ex-vivo hepatic SULT1A1 activity made by investigators in our group [11]. It should be kept in mind that the statistical significance of these findings has not been corrected for multiple testing. However, the collected evidence from this paper might represent the first example of a clinical pharmacokinetic effect of the SULT1A1 copy number variant on the clearance of a SULT1A1 substrate. As SULT1A1 is the most highly expressed hepatic SULT and is involved in the biotransformation of a wide variety of endobiotics and xenobiotics [32], the assessment of SULT1A1 copy numbers should be included to predict pharmacokinetic changes of SULT1A1 substrates that are eliminated primarily through sulfation. Rational selection of genes and previously established evidence of the molecular function of their variants (such as SULT1A1 copy number variation) might still lead to relevant discoveries and validations, even in studies with limited statistical power.
Our study provides evidence on the clinical pharmacokinetic relevance of the SULT1A1 copy number polymorphism in humans and generates novel hypotheses on the functionality of UGT variants. For example, UGT1A8 rs6431558 is an intronic haplotype-tagging SNP associated with glucuronidation ratios (Fig. 2a) but, so far, there is no supportive molecular function. UGT1A8 has extrahepatic intestinal localization [33], and is unlikely to affect systemic plasma disposition of ABT-751; accordingly, an effect of this SNP on the disposition of the ABT-751 parent drug was not observed. Intestinal glucuronidation might affect the oral bioavailability and enterohepatic cycling [34], and the putative role of UGT1A8 variants in these processes should be evaluated.
Another association detected in this study is with UGT1A4*2, an amino acid changing variant [35] with low frequency in the population. Although UGT1A4*2 was associated with ABT-751 Ctrough at day 15, there were only four heterozygous patients with reduced Ctrough (Fig. 2b). This effect would be consistent with the increased activity conferred by this variant for some substrates, including tobacco procarcinogens [35]. An increase in Ctrough glucuronidation ratios in the four UGT1A4*2 heterozygous patients was detected (P=0.028, data not shown). The hypothesis that UGT1A4*2 conferred increased ABT-751 glucuronidation leading to reduced Ctrough is intriguing, but remains to be confirmed.
Using ABT-751 disposition as our working model, this study shows the utility of performing detailed preclinical and clinical assessments of the main pathways of metabolism in early drug development. We have shown that the elucidation of candidate genes and pharmacokinetic phenotyping of parent drug and metabolites can lead to the identification of biomarkers for future testing. This rational strategy might overcome the intrinsic difficulty of performing biomarker discovery in phase I, which is not an ideal setting for pharmacogenetic investigations because of the limited sample sizes and patient heterogeneity.
Supplementary Material
Acknowledgments
Michelle Gibeault from the University of North Carolina at Chapel Hill, Eshelman School of Pharmacy, and Barbara Cool of AbbVie Inc. helped with the editing and submission of the manuscript.
Footnotes
Supplemental digital content is available for this article. Direct URL citations appear in the printed text and are provided in the HTML and PDF versions of this article on the journal’s website (www.pharmacogeneticsandgenomics.com).
Conflicts of interest
F.I. has received funding from AbbVie Inc. to carry out the in-vitro work and genotyping for this study. M.J.R. has consulted for AbbVie Inc. G.F.F. has consulted for AbbVie Inc. (without financial compensation), and has received payments to cover expenses of treating patients on this and other clinical trials conducted by AbbVie Inc. J.X., Y.-L.C., D.A.K., R.A.C., A.K., D.M., G.B.G., L.S., and A.B. are or have been employees of AbbVie Inc. For the remaining authors there are no conflicts of interest.
References
- 1.Rubin EH, Gilliland DG. Drug development and clinical trials – the path to an approved cancer drug. Nat Rev Clin Oncol. 2012;9:215–222. doi: 10.1038/nrclinonc.2012.22. [DOI] [PubMed] [Google Scholar]
- 2.Undevia SD, Gomez-Abuin G, Ratain MJ. Pharmacokinetic variability of anticancer agents. Nat Rev Cancer. 2005;5:447–458. doi: 10.1038/nrc1629. [DOI] [PubMed] [Google Scholar]
- 3.Yoshimatsu K, Yamaguchi A, Yoshino H, Koyagani N, Kitoh K. Mechanism of action of E7010, an orally active sulfonamide antitumor agent: inhibition of mitosis by binding to the colchicine site of tubulin. Cancer Res. 1997;57:3208–3213. [PubMed] [Google Scholar]
- 4.Yamamoto K, Noda K, Yoshimura A, Fukuoka M, Furuse K, Niitani H. Phase I study of E7010. Cancer Chemother Pharmacol. 1998;42:127–134. doi: 10.1007/s002800050795. [DOI] [PubMed] [Google Scholar]
- 5.Yee KW, Hagey A, Verstovsek S, Cortes J, Garcia-Manero G, O’Brien SM, et al. Phase 1 study of ABT-751, a novel microtubule inhibitor, in patients with refractory hematologic malignancies. Clin Cancer Res. 2005;11:6615–6624. doi: 10.1158/1078-0432.CCR-05-0650. [DOI] [PubMed] [Google Scholar]
- 6.Fox E, Maris JM, Cohn SL, Goodspeed W, Goodwin A, Kromplewski M, et al. Pharmacokinetics of orally administered ABT-751 in children with neuroblastoma and other solid tumors. Cancer Chemother Pharmacol. 2010;66:737–743. doi: 10.1007/s00280-009-1218-z. [DOI] [PMC free article] [PubMed] [Google Scholar]
- 7.Rudin CM, Mauer A, Smakal M, Juergens R, Spelda S, Wertheim M, et al. Phase I/II study of pemetrexed with or without ABT-751 in advanced or metastatic non-small-cell lung cancer. J Clin Oncol. 2011;29:1075–1082. doi: 10.1200/JCO.2010.32.5944. [DOI] [PMC free article] [PubMed] [Google Scholar]
- 8.Hande KR, Hagey A, Berlin J, Cai Y, Meek K, Kobayashi H, et al. The pharmacokinetics and safety of ABT-751, a novel, orally bioavailable sulfonamide antimitotic agent: results of a phase 1 study. Clin Cancer Res. 2006;12:2834–2840. doi: 10.1158/1078-0432.CCR-05-2159. [DOI] [PubMed] [Google Scholar]
- 9.Rudek MA, Zhao M, He P, Messermith WA, Baker SD. Validation and implementation of a liquid chromatography/tandem mass spectrometry assay to quantitate ABT-751, ABT-751 glucuronide, and ABT-751 sulfate in human plasma for clinical pharmacology studies. J Pharm Biomed Anal. 2006;42:253–260. doi: 10.1016/j.jpba.2006.04.010. [DOI] [PubMed] [Google Scholar]
- 10.Sheweita SA, Tilmisany AK. Cancer and phase II drug-metabolizing enzymes. Curr Drug Metab. 2003;4:45–58. doi: 10.2174/1389200033336919. [DOI] [PubMed] [Google Scholar]
- 11.Hebbring SJ, Moyer AM, Weinshilboum RM. Sulfotransferase gene copy number variation: pharmacogenetics and function. Cytogenet Genome Res. 2008;123:205–210. doi: 10.1159/000184710. [DOI] [PMC free article] [PubMed] [Google Scholar]
- 12.Nowell S, Falany CN. Pharmacogenetics of human cytosolic sulfotransferases. Oncogene. 2006;25:1673–1678. doi: 10.1038/sj.onc.1209376. [DOI] [PubMed] [Google Scholar]
- 13.Guillemette C. Pharmacogenomics of human UDP-glucuronosyltransferase enzymes. Pharmacogenomics J. 2006;3:136–158. doi: 10.1038/sj.tpj.6500171. [DOI] [PubMed] [Google Scholar]
- 14.Le Tourneau C, Lee JJ, Siu LL. Dose escalation methods in phase I cancer clinical trials. J Natl Cancer Inst. 2009;101:708–720. doi: 10.1093/jnci/djp079. [DOI] [PMC free article] [PubMed] [Google Scholar]
- 15.Purba HS, Maggs JL, Orme ML, Back D, Park BK. The metabolism of 17 alpha-ethinyloestradiol by human liver microsomes: formation of catechol and chemically reactive metabolites. Br J Clin Pharmacol. 1987;23:447–453. doi: 10.1111/j.1365-2125.1987.tb03074.x. [DOI] [PMC free article] [PubMed] [Google Scholar]
- 16.Innocenti F, Iyer L, Ramirez J, Green MD, Ratain MJ. Epirubicin glucuronidation is catalyzed by human UDP-glucuronosyltransferase 2B7. Drug Metab Dispos. 2001;29:686–692. [PubMed] [Google Scholar]
- 17.Yoder Graber AL, Ramirez J, Innocenti F, Ratain MJ. UGT1A1*28 genotype affects the in-vitro glucuronidation of thyroxine in human livers. Pharmacogenet Genomics. 2007;17:619–627. doi: 10.1097/FPC.0b013e3280121fe9. [DOI] [PubMed] [Google Scholar]
- 18.Adjei AA, Weinshilboum RM. Catecholestrogen sulfation: possible role in carcinogenesis. Biochem Biophys Res Commun. 2002;292:402–408. doi: 10.1006/bbrc.2002.6658. [DOI] [PubMed] [Google Scholar]
- 19.Lindsay J, Wang LL, Li Y, Zhou SF. Structure, function and polymorphism of human cytosolic sulfotransferases. Curr Drug Metab. 2008;9:99–105. doi: 10.2174/138920008783571819. [DOI] [PubMed] [Google Scholar]
- 20.Johnson GA, Baker CA. Sulfation of minoxidil by human platelet sulfotransferase. Clin Chim Acta. 1987;169:217–227. doi: 10.1016/0009-8981(87)90322-6. [DOI] [PubMed] [Google Scholar]
- 21.Cleland WW. Computer programmes for processing enzyme kinetic data. Nature. 1963;198:463–465. doi: 10.1038/198463a0. [DOI] [PubMed] [Google Scholar]
- 22.Innocenti F, Undevia SD, Iyer L, Chen PX, Das S, Kocherginsky M, et al. Genetic variants in the UDP-glucuronosyltransferase 1A1 gene predict the risk of severe neutropenia of irinotecan. J Clin Oncol. 2004;22:1382–1388. doi: 10.1200/JCO.2004.07.173. [DOI] [PubMed] [Google Scholar]
- 23.Sawyer MB, Innocenti F, Das S, Cheng C, Ramirez J, Pantle-Fisher FH, et al. A pharmacogenetic study of uridine diphosphate-glucuronosyltransferase 2B7 in patients receiving morphine. Clin Pharmacol Ther. 2003;73:566–574. doi: 10.1016/S0009-9236(03)00053-5. [DOI] [PubMed] [Google Scholar]
- 24.Carlini EJ, Raftogianis RB, Wood TC, Jin F, Zheng W, Rebbeck TR, et al. Sulfation pharmacogenetics: SULT1A1 and SULT1A2 allele frequencies in Caucasian, Chinese and African-American subjects. Pharmacogenetics. 2001;11:57–68. doi: 10.1097/00008571-200102000-00007. [DOI] [PubMed] [Google Scholar]
- 25.Michels J, Ellard SL, Le L, Kollmannsberger C, Murray N, Tomlinson Guns ES, et al. A phase IB study of ABT-751 in combination with docetaxel in patients with advanced castration-resistant prostate cancer. Ann Oncol. 2009;21:305–311. doi: 10.1093/annonc/mdp311. [DOI] [PubMed] [Google Scholar]
- 26.Katz DA, Murray B, Bhathena A, Sahelijo L. Defining drug disposition determinants: a pharmacogenetic–pharmacokinetic strategy. Nat Rev Drug Discov. 2008;7:293–305. doi: 10.1038/nrd2486. [DOI] [PubMed] [Google Scholar]
- 27.Food and Drug Administration. Guidance for industry: drug interaction studies – study design, data analysis, implications for dosing, and labeling recommendations. (DRAFT) US Department of Health and Human Services Food and Drug Administration; Center for Drug Evaluation and Research (CDER); Feb, 2012. [Accessed 9 May 2012]. Available at: http://www.fda.gov/downloads/Drugs/GuidanceComplianceRegulatoryInformation/Guidances/UCM292362.pdf. [Google Scholar]
- 28.Iyer L, King CD, Whitington PF, Green MD, Roy SK, Tephly TR, et al. Genetic predisposition to the metabolism of irinotecan (CPT-11). Role of uridine diphosphate glucuronosyltransferase isoform 1A1 in the glucuronidation of its active metabolite (SN-38) in human liver microsomes. J Clin Invest. 1998;101:847–854. doi: 10.1172/JCI915. [DOI] [PMC free article] [PubMed] [Google Scholar]
- 29.Ramirez J, Iyer L, Journault K, Belanger P, Innocenti F, Ratain MJ, et al. In vitro characterization of hepatic flavopiridol metabolism using human liver microsomes and recombinant UGT enzymes. Pharm Res. 2002;19:588–594. doi: 10.1023/a:1015341726183. [DOI] [PubMed] [Google Scholar]
- 30.Kang SP, Ramirez J, House L, Zhang W, Mirkov S, Liu W, et al. A pharmacogenetic study of vorinostat glucuronidation. Pharmacogenet Genomics. 2010;20:638–641. doi: 10.1097/FPC.0b013e32833e1b37. [DOI] [PMC free article] [PubMed] [Google Scholar]
- 31.Kamdem LK, Liu Y, Stearns V, Kadlubar SA, Ramirez J, Jeter S, et al. In vitro and in vivo oxidative metabolism and glucuronidation of anastrozole. Br J Clin Pharmacol. 2010;70:854–869. doi: 10.1111/j.1365-2125.2010.03791.x. [DOI] [PMC free article] [PubMed] [Google Scholar]
- 32.Yu X, Dhakal IB, Beggs M, Edavana VK, Williams S, Zhang X, et al. Functional genetic variants in the 3′-untranslated region of sulfotransferase isoform 1A1 (SULT1A1) and their effect on enzymatic activity. Toxicol Sci. 2010;118:391–403. doi: 10.1093/toxsci/kfq296. [DOI] [PMC free article] [PubMed] [Google Scholar]
- 33.Strassburg CP, Nguyen N, Manns MP, Tukey RH. Polymorphic expression of the UDP-glucuronosyltransferase UGT1A gene locus in human gastric epithelium. Mol Pharmacol. 1998;54:647–654. [PubMed] [Google Scholar]
- 34.Mizuma T. Intestinal glucuronidation metabolism may have a greater impact on oral bioavailability than hepatic glucuronidation metabolism in humans: a study with raloxifene, substrate for UGT1A1, 1A8, 1A9, and 1A10. Int J Pharm. 2009;378:140–141. doi: 10.1016/j.ijpharm.2009.05.044. [DOI] [PubMed] [Google Scholar]
- 35.Wiener D, Fang JL, Dossett N, Lazarus P. Correlation between UDP-glucuronosyltransferase genotypes and 4-(methylnitrosamino)-1-(3-pyridyl)-1-butanone glucuronidation phenotype in human liver microsomes. Cancer Res. 2004;64:1190–1196. doi: 10.1158/0008-5472.can-03-3219. [DOI] [PubMed] [Google Scholar]
Associated Data
This section collects any data citations, data availability statements, or supplementary materials included in this article.