

Abstract
Background
Passive Heymann Nephritis (PHN), the best characterized animal model of experimental membranous nephropathy, is characterized by subepithelial immune deposits, podocyte foot processes effacement and massive proteinuria beginning 4 days following disease induction. Although single genes involved in PHN have been studied, no whole genome wide expression analysis of kidney tissue has been performed.
Methods
Microarray analysis was performed to identify gene expression changes in PHN rat kidneys during the onset of proteinuria.
Results
Our results showed that 234 transcripts were differentially expressed in diseased animals compared to controls. Genes exclusively upregulated in diseased animals, were mainly required for cell structure and motility, immunity and defence, cell cycle, and developmental processes. The single most increased gene was transgelin (Tagln) showing a 70-fold upregulation in animals with PHN. Protein-protein interaction analysis revealed the following four processes of major relevance in disease manifestation: (i) DNA damage and repair; (ii) changes in the extra cellular matrix; (iii) deregulation of cytokines and growth factors, as well as (iv) rearrangements of the cytoskeleton.
Conclusion
We show for the first time the complex interplay between multiple different genes in experimental membranous nephropathy, supporting a role for genomic approaches to better understanding and defining specific disease processes.
Keywords: passive Heymann nephritis (PHN), gene expression profiling, human nephritis, proteinuria, microarray, bioinformatics, podocyte
Introduction
Membranous nephropathy, an antibody mediated and complement-dependent disease, is one of the most common forms of nephrotic syndromes in adults. Half of these patients develop progressive glomerulosclerosis, with declining renal function [1]. Although the histological hallmark is thickening of the glomerular basement membrane (from which the disease derives its name), membranous nephropathy is primarily a disease of podocytes. Podocytes are terminally differentiated epithelial cells, and injury to this cell is characterized by proteinuria. However, the precise mechanisms leading to proteinuria and the development of glomerulosclerosis in membranous nephropathy are not fully understood.
The best characterized animal model of experimental membranous nephropathy is the passive Heymann nephritis model. Disease is induced in rats by the injection of the anti-Fx1A antibody, which binds to the megalin complex of podocytes. Within 24 hours after injection the Fx1A sheep IgG binds in the subepithelial space of podocytes in a granular pattern [2]. Proteinuria is marked by day four of disease. Renal function is normal during the early stages, but deteriorates progressively over the ensuing months. Early complement activation and the resulting sublytic injury to podocytes is followed by the generation of reactive oxygen species, activation of proteases and lipid peroxidation, and increase in specific cytokines and growth factors, which all likely contribute to further tissue damage [3]. Several attempts have been made to defined potential roles for individual genes. For example protein tyrosine phosphatase receptor type O (PTPRO), Wilms’ tumor gene (WT1), megalin, vascular endothelial growth factor (VEGF) have been studied following disease induction and the onset of proteinuria [4]; transcription factors and changes in matrix expression have been the focus of other studies [5–8].
While microarray studies are often dismissed as hypothesis generating, they are a very efficient technique to analyze numerous genes simultaneously and to define the complex molecular biology of pathological processes. In the field of experimental nephrology, microarray analysis has been applied to investigate several human diseases and pathological events, such as kidney tumors [9, 10], reperfusion injury [11], diabetes [12, 13] or kidney transplantation [14]. Several animal models have also been studied. Sadlier and colleagues used microarray analysis to identify changes in the transcriptome in the Thy1 model of mesangial proliferative glomerulonephritis [15]. However, a whole-genome gene expression analysis study of membranous nephropathy has not been reported.
Accordingly, to fully delineate changes in gene expression in early membranous nephropathy, we analyzed changes in the transcriptome in glomeruli by microarrays in the passive Heymann Nephritis model of membranous nephropathy prior to, and immediately following the onset of proteinuria.
Methods
Passive Heymann Nephritis (PHN) Model of Membranous Nephropathy
To induce PHN, twenty male Sprague-Dawley rats (Simson, Gilroy, CA, USA), with a bodyweight ranging from 180–200g, received a single intraperitoneal injection of sheep anti FX1A antibody (5mL/kg bodyweight) as previously described [16]. Normal sheep serum (5ml/kg) was administered to control animals. Experimental and control animals (n=5/group/time point) were sacrificed at three and six days after injections.
Measuring renal function
In order to assess proteinuria and renal function, urine was collected by placing the animals in metabolic cages for 12 hours at baseline and prior to sacrifice, during which time water was supplied without restriction [16]. Total protein excretion was determined by the sulfosalicylic acid turbidity method [17]. Creatinine excretion was measured using a colorimetric microplate assay based on the Jaffe reaction [18] (Oxford Biomedical Research, MI, USA). Animals from the experimental group were excluded if they did not develop proteinuria.
Glomerular Isolation
In order to extract RNA for the microarray analysis, glomeruli were isolated by differential sieving as previously reported [19]. Briefly, kidney cortices were removed, minced, and pressed through a series of sieves with 180μm, 106μm, and 75μm-sized mesh. Glomeruli were collected on the 75μm-sized mesh, removed from the sieve and pelleted in chilled phosphate buffered saline by centrifugation. The glomerular pellet was assessed for purity by counting the number of glomeruli and tubular fragments by microscopy. Tubular contamination was typically less then 4%.
RNA extraction, Microarray, Hybridization and Scanning
Extraction of total RNA was performed on isolated glomeruli from individual diseased and control animals by the TRIZOL® method (Invitrogene Corp, Carlsbad, CA, USA) as we have previously reported [20]. To remove potential traces of Trizol reagent, a second RNA cleanup step using Qiagen RNeasy was performed (Qiagen, Hildesheim, Germany). Quality of the isolated total RNA was checked by gel electrophoresis and with Agilent Bioanalyzer using a RNA6000 LabChip® kit (Agilent, Palo Alto, CA, USA). Quantity and OD 260/280 of total RNA and cRNA was assessed by UV spectrophotometer. cRNA was labelled with Biotin according to the Affymetrix eukaryotic target labelling protocol.
As described above, RNA was isolated from individual control and experimental animals. The RNA of two animals was pooled and hybridized on one microarray, resulting in five biological replicates at each time point (days 3 and 6) in diseased and control animals. Samples were hybridized to Affymetrix R230A GeneChip (Affymetrix, Santa Clara, CA, USA) arrays according to standard Affymetrix protocols. Quality of hybridizations and overall chip performance was determined by visual inspection of the raw scanned data. Raw data files, probe set information and files containing absolute analysis are available on: http://www.meduniwien.ac.at/nephrogene/data/index.html
Microarray analysis
Pre-processing of microarray raw data including probe-specific background correction, summarization of probe set values, and normalization was carried out with the CARMAweb (comprehensive R- and bioconductor-based web service for microarray data analysis) tool, using the robust multi-chip analysis (RMA) approach [21, 22].
The significance analysis of microarrays (SAM) method was used to identify differentially expressed genes (DEGs) between immunized rats and controls. The method calculates a set of gene-specific t tests followed by an estimation of the false discovery rate [23]. In our case the false discovery rate was set to < 5%. DEGs showing a fold change >1.5 were further analyzed with regard to their molecular functions, biological processes, and biological pathways using information provided by the gene ontology consortium [24], the Kyoto Encyclopaedia of Genes and Genomes (KEGG) [25], and the PANTHER (Protein ANalysis THrough Evolutionary Relationships) classification system [16]. Enriched and depleted functional categories were identified using the PANTHER data set covering the whole rat genome as reference dataset. The ratio of expected to the observed frequencies of genes assigned to certain ontology categories were compared using the χ2 test to derive significance of differences.
Protein-protein interaction network analysis
Beginning with the set of DEGs, we generated a protein-protein interaction network following the nearest neighbour expansion method using data from the Online Predicted Human Interaction Database (OPHID) on interactions of rat proteins [26, 27]. The MCODE (Molecular Complex Detection) algorithm was used to identify highly connected subnetworks in the complete generated network [28]. The MCODE parameters Node Score Cutoff, k-Core, and maximal depth were set to 0.2, 2, and 100 respectively. Final identified network modules were visualized in the software environment Cytoscape [29].
Results
Proteinuria increases in PHN rats
Proteinuria measurements in PHN rats at days 3 and 6, and normal rats are shown in figure 1. As expected, proteinuria was not increased at day 3, but did increase statistically at day 6.
Figure 1. Proteinuria.
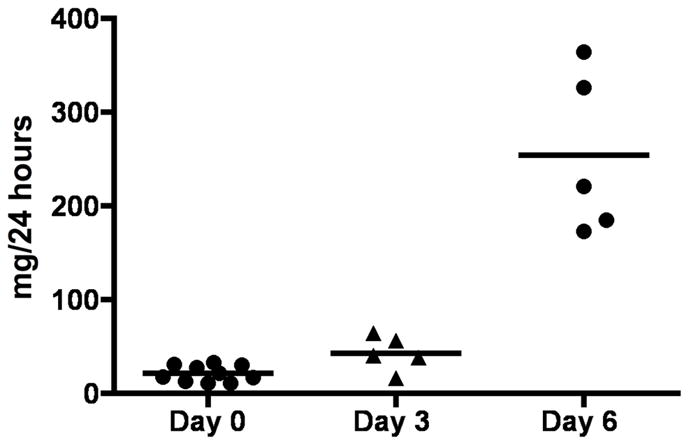
Graph in figure 1 is showing total protein excretion of rats at the baseline (day 0) and after induction of disease (day 3 and day 6).
Patterns of Gene Expression before and after the onset of Proteinuria
Significantly differentially expressed genes (DEGs) were identified between diseased rats and control rats before (day 3) and after (day 6) the onset of proteinuria. The onset of proteinuria was detected as described earlier [16]. 55 DEGs and 225 DEGs showing fold-change values > 1.5 were detected on day three and six respectively using the SAM analysis (table 1). All DEGs showed an increase in disease compared to controls. Of the 54 DEGs detected on day three, 45 were also differentially expressed at day six.
Table 1.
Differentially expressed genes (DEGs)
| Symbol | Gene Name | Fold Change | ||
|---|---|---|---|---|
| Day 3 | Day 6 | |||
| Apoptosis | ||||
| BE112895 | Pea15 * | phosphoprotein enriched in astrocytes 15 | 2.55 | |
| AI411997 | Adamtsl4 | ADAMTS-like 4 | 1.90 | |
| NM_012935 | Cryab | crystallin, alpha B | 1.75 | |
| NM_022546 | Dapk3 | death-associated protein kinase 3 | 1.51 | 1.54 |
| BF282636 | RGD1305457 | similar to RIKEN cDNA 1700023M03 | 1.54 | |
| NM_017180 | Phlda1 | pleckstrin homology-like domain, family A, member 1 | 1.50 | |
| Cell Adhesion | ||||
| Z78279 | Col1a1 | collagen, type 1, alpha 1 | 7.68 | 14.09 |
| AF056034 | Nexn | nexilin | 4.77 | 4.55 |
| BI303379 | Tnfrsf12 | tumor necrosis factor receptor superfamily, member 12a | 3.70 | 4.21 |
| BF407194 | Itgb1bp2 * | integrin beta 1 binding protein 2 | 2.14 | 2.09 |
| NM_030828 | Gpc1 | glypican 1 | 2.02 | |
| NM_017022 | Itgb1 | integrin beta 1 | 1.82 | |
| NM_012811 | Mfge8 | milk fat globule-EGF factor 8 protein | 1.79 | |
| BG379319 | Tgfbi | transforming growth factor, beta induced | 1.72 | |
| NM_022266 | Ctgf | connective tissue growth factor | 1.66 | |
| AW433888 | Vcl * | vinculin | 1.63 | |
| NM_133409 | Ilk | integrin linked kinase | 1.52 | 1.61 |
| BI275904 | Lims2 * | LIM and senescent cell antigen like domains 2 | 1.63 | 1.59 |
| AI008975 | LOC311772 | similar to nidogen 2 | 1.57 | |
| NM_022523 | Cd151 | CD151 antigen | 1.51 | |
| NM_019237 | Pcolce | procollagen C-proteinase enhancer protein | 1.50 | |
| AB001382 | Spp1 | secreted phosphoprotein 1 | 2.10 | |
| NM_012774 | Gpc3 | glypican 3 | 1.87 | |
| Cell Structure and Motility | ||||
| U22520 | Cxcl10 | chemokine (C-X-C motif) ligand 10 | 3.66 | |
| BE111697 | Kif20a * | kinesin family member 20A | 3.55 | |
| NM_022531 | Des | desmin | 1.85 | 3.29 |
| NM_031005 | Actn1 | actinin, alpha 1 | 3.00 | 3.19 |
| BI283060 | Flna * | filamin, alpha | 2.60 | 2.96 |
| NM_019131 | Tpm1 | tropomyosin 1, alpha | 3.33 | 2.90 |
| BI279044 | Myl9 * | myosin, light polypeptide 9, regulatory | 5.58 | 2.81 |
| AI179391 | Enh | enigma homolog | 2.04 | 2.58 |
| NM_017148 | Csrp1 | cysteine and glycine-rich protein 1 | 1.92 | 2.42 |
| X03369 | Tubb2b | tubulin, beta 2b | 2.34 | |
| BI274903 | RGD1305887 * | similar to RIKEN cDNA 2310057H16 | 1.80 | 2.27 |
| AA012755 | MGC109519 | similar to tropomyosin 1, embryonic fibroblast - rat | 2.23 | |
| NM_019361 | Arc | activity regulated cytoskeletal-associated protein | 2.18 | |
| NM_012987 | Nes | nestin | 2.07 | |
| AI598442 | RGD1564875 * | similar to mKIAA0613 protein | 2.04 | |
| AW919109 | Cap2 | CAP, adenylate cyclase-associated protein, 2 (S. cerevisiae) | 1.88 | 2.03 |
| BI285440 | Tubb5 | tubulin, beta 5 | 1.91 | |
| AI103106 | Lmnb1 | lamin B1 | 1.86 | |
| AA892044 | Tubb2 | tubulin, beta, 2 | 1.80 | |
| NM_013194 | Myh9 | myosin, heavy polypeptide 9 | 1.76 | |
| NM_031970 | Hspb1 | heat shock 27kDa protein 1 | 1.74 | |
| BG381583 | RGD1565118 * | similar to mKIAA0843 protein | 1.68 | |
| X70706 | Pls3 | plastin 3 (T-isoform) | 1.67 | |
| BM391364 | LOC290704 | 1.60 | 1.67 | |
| BI296011 | Cfl2 * | cofilin 2, muscle | 1.65 | |
| NM_021755 | Lmna | lamin A | 1.63 | |
| NM_130411 | Coro1a | coronin, actin binding protein 1A | 1.63 | |
| BI278813 | Ckap4 * | cytoskeleton-associated protein 4 | 1.60 | |
| BM383953 | LOC367171 | microtubule-associated protein 4 | 1.57 | |
| NM_031675 | Actn4 | actinin alpha 4 | 1.51 | 1.56 |
| AA891834 | Col4a5 * | collagen, type IV, alpha 5 | 1.56 | |
| AI407239 | Myom2 | myomesin 2 | 1.55 | |
| NM_031140 | Vim | vimentin | 1.54 | |
| NM_134452 | Col5a1 | collagen, type V, alpha 1 | 1.52 | |
| AI180161 | Mapre1 | microtubule-associated protein, RP/EB family, member 1 | 1.52 | |
| AW252250 | Nebl * | nebulette | 1.51 | |
| NM_019212 | Acta1 | actin, alpha 1, skeletal muscle | 6.03 | |
| Cell Cycle | ||||
| BG379338 | Rrm2 | ribonucleotide reductase M2 | 6.87 | |
| BE113362 | Cdkn3 * | cyclin-dependent kinase inhibitor 3 | 5.53 | |
| AI409259 | Racgap1 * | Rac GTPase-activating protein 1 | 5.02 | |
| AA944180 | RGD1562047 * | similar to Cyclin-dependent kinases regulatory subunit 2 (CKS-2) | 5.00 | |
| NM_019296 | Cdc2a | cell division cycle 2 homolog A (S. pombe) | 4.40 | |
| AW253821 | Ccnb2 * | cyclin B2 | 3.47 | |
| BI296084 | Ube2c * | ubiquitin-conjugating enzyme E2C | 3.15 | |
| NM_031131 | Tgfb2 | transforming growth factor, beta 2 | 2.06 | 3.06 |
| NM_021989 | Timp2 | tissue inhibitor of metalloproteinase 2 | 1.58 | 2.44 |
| BF417638 | RGD:1359093 | similar to cell division cycle associated 3 | 2.27 | |
| BG380355 | Cdca8 | cell division cycle associated 8 | 2.24 | |
| U05341 | Cdc20 | cell division cycle 20 homolog (S. cerevisiae) | 2.20 | |
| BE117002 | LOC362021 | 2.12 | ||
| AI408269 | Spbc25 | spindle pole body component 25 homolog (S. cerevisiae) | 2.06 | |
| NM_053483 | Kpna2 | karyopherin (importin) alpha 2 | 2.04 | |
| AA874827 | Dlg7 * | discs, large homolog 7 (Drosophila) | 1.84 | |
| AA996882 | Stk6 | serine/threonine kinase 6 | 1.82 | |
| AW920000 | LOC362587 | similar to microfilament and actin filament cross-linker protein isoform b | 1.81 | |
| NM_022381 | Pcna | proliferating cell nuclear antigen | 1.78 | |
| X64589 | Ccnb1 | cyclin B1 | 1.72 | |
| AI407985 | LOC686524 | hypothetical protein LOC686524 | 1.70 | |
| AF140232 | S100a6 | S100 calcium binding protein A6 (calcyclin) | 1.69 | |
| BM386384 | Nap1l1 | nucleosome assembly protein 1-like 1 | 1.65 | |
| NM_053819 | Timp1 | Tissue inhibitor of metalloproteinase 1 | 2.30 | |
| AA957183 | Cit | citron | 1.57 | |
| NM_013174 | Tgfb3 | transforming growth factor, beta 3 | 1.55 | |
| Immunity and Defense | ||||
| AI233530 | C1qtnf3 * | C1q and tumor necrosis factor related protein 3 | 2.67 | |
| BI284441 | Colec12 | collectin sub-family member 12 | 2.59 | |
| BI278802 | Prnp | prion protein | 2.51 | |
| BF389535 | LOC299339 | similar to Tumor necrosis factor, alpha-induced protein 2 (primary response gene B94) | 2.14 | |
| NM_053843 | Fcgr3 | Fc receptor, IgG, low affinity III | 2.10 | |
| AI176519 | Ier3 | immediate early response 3 | 2.08 | |
| L12458 | Lyz | lysozyme | 2.05 | |
| AW918311 | C1qtnf4 * | C1q and tumor necrosis factor related protein 4 | 2.02 | |
| NM_012620 | Serpine1 | serine (or cysteine) proteinase inhibitor, clade E, member 1 | 1.66 | |
| AI228623 | Nptx2 * | neuronal pentraxin II | 1.64 | |
| NM_031971 | Hspa1a | heat shock 70kD protein 1A | 1.54 | |
| Transport (membrane) | ||||
| BI293600 | Slc35b2 | solute carrier family 35, member B2 | 2.08 | 2.64 |
| NM_019354 | Ucp2 | uncoupling protein 2 | 1.50 | |
| Transport (intracellular) | ||||
| NM_022959 | Pamci | peptidylglycine alpha-amidating monooxygenase COOH-terminal interactor | 1.57 | |
| BG381589 | Stx6 | syntaxin 6 | 1.50 | |
| Transport (other) | ||||
| AI170609 | RGD1560252 * | similar to hypothetical protein MGC31967 | 4.02 | 3.10 |
| AI407838 | Ecm1 | extracellular matrix protein 1 | 2.04 | |
| NM_022278 | Glrx1 | glutaredoxin 1 (thioltransferase) | 1.52 | |
| BE111722 | Ndufs2 * | NADH dehydrogenase (ubiquinone) Fe-S protein 2 | 1.52 | |
| Metabolism (lipid) | ||||
| NM_031043 | Gyg1 | glycogenin 1 | 1.59 | 2.64 |
| NM_013200 | Cpt1b | carnitine palmitoyltransferase 1b | 1.60 | 2.43 |
| AF248543 | A3galt2 | alpha 1,3-galactosyltransferase 2 (isoglobotriaosylceramide synthase) | 1.74 | |
| NM_017235 | Hsd17b7 | hydroxysteroid (17-beta) dehydrogenase 7 | 1.67 | |
| NM_012941 | Cyp51 | cytochrome P450, subfamily 51 | 1.67 | |
| NM_031840 | Fdps | farensyl diphosphate synthase | 1.51 | |
| Metabolism (glycogen) | ||||
| AW919180 | Pygm | muscle glycogen phosphorylase | 1.85 | 1.76 |
| Metabolism (DNA) | ||||
| NM_022674 | H2afz | H2A histone family, member Z | 1.61 | |
| Metabolism (other) | ||||
| AA891760 | RGD1308350 * | similar to hypothetical protein MGC13251 | 1.68 | |
| BG381486 | Large * | like-glycosyltransferase | 1.64 | |
| BM385390 | Uxs1 | UDP-glucuronate decarboxylase 1 | 1.58 | |
| BI282076 | Prdx4 | peroxiredoxin 4 | 1.52 | |
| Protein Modification | ||||
| AI236997 | Dusp14 * | dual specificity phosphatase 14 | 2.24 | |
| NM_130403 | Ppp1r14a | protein phosphatase 1, regulatory (inhibitor) subunit 14A | 1.82 | |
| AW531714 | Ube2t * | ubiquitin-conjugating enzyme E2T (putative) | 1.76 | |
| BI276525 | Ate1 * | arginine-tRNA-protein transferase 1 | 1.70 | |
| BI283703 | Mapkapk2 | MAP kinase-activated protein kinase 2 | 1.69 | |
| AF106659 | Usp2 | ubiquitin specific protease 2 | 1.68 | |
| NM_053323 | Degs | degenerative spermatocyte homolog (Drosophila) | 1.64 | |
| AI010241 | Usp1 * | ubiquitin specific protease 1 | 1.63 | |
| AA799400 | B3galt3 * | UDP-Gal:betaGlcNAc beta 1,3-galactosyltransferase, polypeptide 3 | 1.59 | |
| AA849399 | Ctsz | cathepsin Z | 1.54 | |
| BI279788 | Ube2s * | ubiquitin-conjugating enzyme E2S | 1.51 | |
| NM_024135 | Limk2 | LIM motif-containing protein kinase 2 | 1.50 | |
| Protein Folding | ||||
| AI175031 | Dnajb4 * | DnaJ (Hsp40) homolog, subfamily B, member 4 | 1.53 | |
| BG671521 | Hspca | heat shock protein 1, alpha | 1.54 | |
| Signal Transduction | ||||
| NM_019904 | Lgals1 | lectin, galactose binding, soluble 1 | 1.61 | 3.71 |
| NM_012715 | Adm | adrenomedullin | 1.78 | 2.86 |
| BF405151 | Gpr39 * | G protein-coupled receptor 39 | 1.72 | 2.80 |
| NM_053634 | Fcnb | ficolin B | 1.91 | 2.70 |
| NM_033099 | Ptprv | protein tyrosine phosphatase, receptor type, V | 2.27 | |
| BE117002 | RGD1560967 * | similar to Pins | 2.12 | |
| AW253242 | Magi1 * | membrane associated guanylate kinase interacting protein-like 1 | 1.74 | |
| X78595 | Npr3 | natriuretic peptide receptor 3 | 1.74 | |
| BG378926 | S100a11 | S100 calcium binding protein A11 (calizzarin) | 1.73 | |
| BI276015 | RGD1559882 * | similar to hypothetical protein E130310N06 | 1.66 | |
| BM386204 | Ran | RAN, member RAS oncogene family | 1.65 | |
| BI295991 | Rab2l | RAB2, member RAS oncogene family-like | 1.60 | |
| NM_022236 | Pde10a | phosphodiesterase 10A | 1.56 | 1.56 |
| NM_012823 | Anxa3 | annexin A3 | 1.51 | |
| NM_053299 | Ubd | ubiquitin D | 1.72 | |
| M35297 | Mrgprf | MAS-related GPR, member F | 1.79 | |
| Transcription | ||||
| BM385445 | Top2a | topoisomerase (DNA) 2 alpha | 3.37 | |
| L81174 | Ankrd1 | ankyrin repeat domain 1 (cardiac muscle) | 2.62 | 3.02 |
| NM_031628 | Nr4a3 | nuclear receptor subfamily 4, group A, member 3 | 2.34 | |
| NM_017187 | Hmgb2 | high mobility group box 2 | 2.04 | |
| NM_131902 | Cdkn2c | cyclin-dependent kinase inhibitor 2C (p18, inhibits CDK4) | 2.01 | |
| NM_017365 | Pdlim1 | PDZ and LIM domain 1 (elfin) | 2.00 | |
| AI170362 | Nfkb2 | nuclear factor of kappa light polypeptide gene enhancer in B-cells 2, p49/p100 | 1.95 | |
| U17565 | Mcmd6 | mini chromosome maintenance deficient 6 (S. cerevisiae) | 1.88 | |
| NM_053583 | Zfp423 | zinc finger protein 423 | 1.87 | |
| BM387864 | Lrrfip1 | similar to FLI-LRR associated protein-1 | 1.76 | |
| BG664147 | Ptrf * | polymerase I and transcript release factor | 1.65 | |
| BG380385 | Srf * | serum response factor | 1.95 | 1.64 |
| BF403027 | Hdac5 | histone deacetylase 5 | 1.64 | |
| AI179264 | Creb3 | cAMP responsive element binding protein 3 | 1.50 | |
| Homeostasis | ||||
| BI285437 | Nxn * | nucleoredoxin | 1.62 | |
| Nucleus | ||||
| BE104102 | RGD1306774 * | similar to SPT3-associated factor 42 | 1.83 | |
| Membrane | ||||
| BM385031 | Plp2 | proteolipid protein 2 | 1.76 | 2.55 |
| BM388441 | RGD1311946 * | similar to RIKEN cDNA 1810055G02 | 1.97 | |
| NM_030847 | Emp3 | epithelial membrane protein 3 | 1.89 | |
| AW917760 | RGD1564216 * | similar to Myoferlin (Fer-1 like protein 3) | 1.88 | |
| AI009530 | MGC72614 | hypothetical LOC310540 | 1.86 | |
| BI296048 | Myadm | myeloid-associated differentiation marker | 1.55 | 1.77 |
| J03867 | Dia1 | diaphorase 1 | 1.60 | |
| BM385463 | Tmem43 | transmembrane protein 43 | 1.55 | |
| AI230273 | RGD:735199 | Unknown (protein for MGC:72987) | 1.55 | |
| BF283798 | Nipsnap3a | nipsnap homolog 3A (C. elegans) | 1.53 | |
| AA850909 | Pvrl2 * | poliovirus receptor-related 2 (herpesvirus entry mediator B) | 1.50 | |
| BI290029 | RGD1562920 * | similar to Aig1 protein | 1.50 | |
| AI407016 | RGD1307736 * | similar to Hypothetical protein KIAA0152 | 1.55 | |
| BI294974 | Ldlr | low density lipoprotein receptor | 1.69 | |
| Developmental Processes | ||||
| NM_031549 | Tagln | transgelin | 69.77 | 38.66 |
| NM_012636 | Pthlh | parathyroid hormone-like peptide | 3.13 | |
| NM_030584 | Sost | sclerostin | 3.12 | |
| AW141680 | Bmp6 | bone morphogenetic protein 6 | 2.36 | |
| NM_019242 | Ifrd1 | interferon-related developmental regulator 1 | 2.05 | 2.32 |
| AW251450 | Mustn1 | musculoskeletal, embryonic nuclear protein 1 | 2.13 | |
| AI235465 | Ssg1 | steroid sensitive gene 1 | 2.07 | |
| AW435036 | Smtn * | smoothelin | 1.65 | |
| BI290551 | Fnbp1 | Formin binding protein 1 | 1.60 | |
| BI275485 | Sema3b * | semaphorin 3B, immunoglobulin domain, secreted | 1.57 | |
| AW144216 | Enpep | glutamyl aminopeptidase | 2.11 | 1.57 |
| BG666787 | Gmfg | glia maturation factor, gamma | 1.56 | |
| BM384088 | Socs2 | suppressor of cytokine signaling 2 | 1.54 | |
| NM_031114 | S100a10 | S100 calcium binding protein A10 (calpactin) | 1.51 | |
| Others | ||||
| AI229404 | RGD1566097 * | similar to Anillin | 2.47 | 8.41 |
| BI295828 | 2.28 | 3.31 | ||
| BI279587 | 2.12 | 3.01 | ||
| BI283695 | 1.73 | 2.48 | ||
| AW531909 | 2.44 | |||
| BF419834 | 1.62 | 2.29 | ||
| BF415061 | RGD1307034 * | similar to hypothetical protein CG003 | 2.21 | |
| BF408518 | RGD1305081 * | similar to ionized calcium binding adapter molecule 2 (Iba2) | 1.98 | 2.16 |
| AI712694 | RGD1308747 * | similar to hypothetical protein FLJ10156 | 2.15 | |
| BI296728 | RGD1564957 * | similar to RIKEN cDNA 3110007P09 | 2.04 | |
| AI176172 | 2.03 | |||
| BM387112 | 1.71 | 2.03 | ||
| AI071000 | 2.00 | |||
| AA799328 | RGD1560913 * | similar to expressed sequence AW413625 | 1.93 | |
| BE096535 | transcribed locus, strongly similar to XP_574462.1 similar to hypoth. protein C230069C04 | 1.89 | ||
| BG378155 | RGD1565079 * | similar to hypothetical protein MGC17839 | 1.88 | |
| AA943808 | RGD1307215 | similar to protein phosphatase 1, inhibitory subunit 1C; thymocyte ARPP | 1.82 | |
| AW143197 | 1.79 | |||
| AW529960 | 1.78 | |||
| AI177743 | LOC498261 | 1.72 | ||
| AI317841 | Gramd3 | GRAM domain containing 3 | 1.69 | |
| BI303106 | 1.64 | |||
| BF561368 | RGD1306959 * | similar to C11orf17 protein | 1.63 | |
| AW253004 | CDNA clone IMAGE:7317367 | 1.62 | ||
| BF398756 | 1.62 | |||
| AI009167 | Zfp451 * | zinc finger protein 451 | 1.62 | |
| AI412389 | 1.61 | |||
| BE111057 | 1.60 | |||
| BI282694 | RGD1565037 * | similar to selenoprotein SelM | 1.60 | |
| AI231225 | 1.58 | |||
| AA942716 | Hn1 | hematological and neurological expressed sequence 1 | 1.56 | |
| BF284519 | 1.55 | |||
| BG671786 | 1.53 | |||
| AW914928 | 1.53 | |||
| AI113146 | Acpl2 | acid phosphatase-like 2 | 1.51 | |
| AI170820 | RGD1310383 * | similar to T-cell activation protein phosphatase 2C | 1.50 | |
| AA800892 | RGD1563599 * | similar to putative SH3BGR protein | 1.81 | |
| BG380430 | RGD1564105 * | similar to RIKEN cDNA B130052G07 | 1.54 | |
| NM_021584 | Ania4 | activity and neurotransmitter-induced early gene protein 4 (ania-4) | 2.53 | |
| AA997359 | Serpinb6 | serine (or cysteine) peptidase inhibitor, clade B, member 6 | 1.54 | |
| NM_012618 | S100a4 | S100 calcium-binding protein A4 | 1.80 | |
| NM_022382 | Pde4dip | phosphodiesterase 4D interacting protein (myomegalin) | 1.70 | |
| AI112962 | Rcn * | reticulocalbin | 1.92 | |
| AI232065 | Arhgap18 * | Rho GTPase activating protein 18 | 1.55 | |
List of 234 differentially regulated genes (>1.5 fold) in PHN induced rats on day three and or day six. Genes are annotated with NCBI Gene Symbols and grouped according to biological function. Starred (*) Gene Symbols mark predicted genes.
Functional annotation of DEGs
234 genes were classified into functional groups such as cell adhesion, cell cycle, immunity and defense, transport, protein folding, developmental processes and others.
A multitude of genes were identified that encode structural proteins of the cytoskeleton or proteins required for cell adhesion such as integrin beta 1 (Itgb1), secreted phosphoprotein 1 (SPP1), laminin A (Lmna), desmin (Des), nestin (Nes), or tubulin beta 2 (Tubb2). Another functional category that was found highly enriched in increased expressed DEGs was related to cell cycle and cell proliferation. Prominent proteins such as the transforming growth factors beta 2 and 3 (TGFβ2, TGFβ3), cyclins B1 and B2 (Ccnb1, Ccnb2), or the proliferating cell nuclear antigen (PCNA) were detected in this category.
Figure 2 shows the numbers of genes that are significantly enriched in the transcriptome of PHN rats. Categories shown are significantly over-represented (p<0.005), the numbers within the brackets reflect the number of genes expected to be differentially regulated in the dataset. The relative numbers of genes in a certain functional group of the abundant GO terms represent the cellular processes prior to (day 3) and following the onset of proteinuria (day 6). While genes associated with cell cycle are enriched at both time points, the relative amount of cell cycle associated genes is 26.7% (or 60 genes) of all the enriched genes after the onset of proteinuria, compared to 5% beforehand. An even greater change was evident for genes with functions related to cellular immunity and defense. However, these genes are not enriched (1%) at the early time point (day 3), but at day 6 they comprise 15 % of all abundant genes (34 genes compared to 12.07 expected genes).
Figure 2. Enriched biological processes.

Enriched biological processes and number of differentially expressed genes are given in figure 2. Numbers in brackets depict expected gene numbers according to the background distribution of all human genes.
On day 6 the relative amount of DEGs related to cell structure and motility more increased more than two-fold from 15 genes earlier (1.82 expected genes) to 35 genes (7.6 expected) later. Changes in the relative quantity of the abundant genes between day three and day six were also detected for genes involved in developmental processes. They showed an increase from 15 (4.16 expected) to 48 (or 17.36 expected). Table 2 gives a detailed list of the DEGs belonging to the overrepresented GO term.
Table 2.
List of over- and underrepresented ontology terms in the dataset
| day 3 | day 6 | |||||
|---|---|---|---|---|---|---|
| genes | over/under | p-value | genes | over/under | p-value | |
| Biological Processes | ||||||
| Cell structure and motility | 15 | + | 4.20E-010 | 35 | + | 1.02E-013 |
| -Cell structure | 12 | + | 1.33E-009 | 27 | + | 3.08E-013 |
| -Cell motility | 6 | + | 3.74E-005 | 17 | + | 9.07E-010 |
| Developmental processes | 11 | + | 1.46E-003 | 36 | + | 9.29E-007 |
| -Mesoderm development | 4 | / | / | 15 | + | 2.68E-005 |
| Cell cycle | 3 | / | / | 27 | + | 2.29E-010 |
| -Mitosis | 3 | / | / | 10 | + | 2.53E-004 |
| -Cell cycle control | 1 | / | / | 10 | + | 1.01E-003 |
| Muscle contraction | 4 | + | 4.29E-004 | 11 | + | 2.30E-007 |
| Immunity and defense | 2 | / | / | 21 | + | 4.34E-004 |
| -Macrophage-mediated immunity | 0 | / | / | 5 | + | 1.81E-003 |
| -Stress response | 0 | / | / | 8 | + | 1.86E-004 |
| Tumor supressor | 1 | / | / | 5 | + | 4.73E-004 |
| Metabolism | / | |||||
| - sulfur redox | 0 | / | / | 2 | + | 1.23E-002 |
| - glycogen | 2 | + | 3.84E-003 | 2 | / | / |
| Cell adhesion | 6 | + | 6.59E-004 | 9 | / | / |
| G-protein mediated signaling | 1 | / | / | 2 | − | 1.11E-002 |
| Protein modification | 2 | / | / | 16 | + | 1.14E-002 |
| Molecular Function | ||||||
| Cytoskeletal protein | 15 | + | 4.58E-012 | 37 | + | 1.14E-019 |
| -Actin binding cytoskeletal protein | 12 | + | 2.10E-012 | 23 | + | 5.29E-015 |
| -Microtuble family cytoskeletal protein | 2 | / | / | 7 | + | 1.58E-003 |
| -Intermediate filament | 1 | / | / | 5 | + | 1.05E-003 |
| Non-motor actin binding protein | 4 | + | 2.35E-004 | 11 | + | 4.73E-008 |
| Actin binding motor protein | 1 | / | / | 3 | + | 7.30E-003 |
| Tubulin | 2 | + | 1.37E-003 | 4 | + | 7.37E-005 |
| Select regulatory molecule | 2 | / | / | 22 | + | 3.87E-005 |
| -Kinase modulator | 1 | / | / | 7 | + | 1.99E-004 |
| Metalloprotease inhibitor | 1 | + | 8.26E-003 | 2 | + | 5.35E-004 |
| Miscellaneous function | 5 | / | / | 14 | + | 2.49E-003 |
| -Structural protein | 2 | / | / | 8 | + | 1.01E-004 |
| Signaling molecule | 4 | / | / | 16 | + | 2.29E-004 |
| -Growth factor | 1 | / | / | 4 | + | 1.30E-002 |
| Defense/Immunity protein | 2 | / | / | 8 | + | 6.04E-003 |
| Non-receptor serine/threonine kinase | 2 | / | / | 7 | + | 8.53E-003 |
| Select calcium binding protein | 1 | / | / | 8 | + | 1.15E-003 |
| -Calmodulin related protein | 1 | / | / | 6 | + | 1.01E-003 |
| G-protein coupled receptor | 1 | / | / | 0 | − | 2.09E-003 |
| Nucleic acid binding | 2 | / | / | 9 | − | 1.16E-002 |
| PANTHER pathways | ||||||
| Integrin signaling pathway | 6 | + | 3.88E-006 | 10 | + | 8.61E-006 |
| Cytoskeletal regulation by Rho GTPase | 2 | / | / | 7 | + | 1.97E-005 |
| Hedgehog signaling pathway | 2 | + | 3.35E-003 | 4 | + | 4.14E-004 |
| p53 pathway | 0 | / | / | 5 | + | 2.31E-003 |
| DNA replication | 0 | / | / | 2 | + | 1.00E-002 |
| KEGG pathways | ||||||
| Focal adhesion | 6 | 9 | ||||
| Cell cycle | 1 | 9 | ||||
| Regulation of actin cytoskeleton | 3 | 8 | ||||
| MAPK signaling pathway | 3 | 7 | ||||
| Cell communication | 2 | 7 | ||||
| Leukocyte transendothelial migration | 3 | 5 | ||||
| Gap junction | 2 | 5 | ||||
| axon guidance | 0 | 5 | ||||
| Tight junction | 3 | 4 | ||||
| Adherens junction | 2 | 4 | ||||
| p53 signaling pathway | 0 | 4 | ||||
| Adipocytokine signaling pathway | 2 | 3 | ||||
| ECM-receptor interaction | 1 | 3 | ||||
| TGF-beta signaling pathway | 1 | 3 | ||||
| Cytokine-cytokine receptor interaction | 1 | 2 | ||||
| Cell adhesion molecules | 0 | 2 | ||||
| Toll-like receptor signaling pathway | 0 | 2 | ||||
List of genes assigned to the over- or under-represented GO terms. Genes in the list are sorted according their cellular function. Significance levels are given as Bonferroni corrected p-values (p<0.005) following a chi-square test.
Interaction modules
Four highly connected sub-networks could be identified using the MCODE algorithm integrated in the Cytoscape development environment (Figure 2). Clusters were ranked according the density of the cluster and number of nodes. Cluster 1 containing five nodes, namely Pcna, Ccnb1, Cdc2a, Gadd45a, and Gadd45g, connected through 9 interactions had the highest score based on the density and number of nodes. The proteins Itgb1, Spp1, Lgals1, and Fn1 formed the second ranked cluster (Cluster 2) as depicted in figure 3. Cluster 3 contained exclusively members of the transforming growth factor protein family, namely TGF-β2, and TGF-β3 as well as TGF-β receptors 1, 2 and 3. Cluster 4 genes were predominantly involved in cell structure and motility such as Vim, Myh9, or Myh10.
Figure 3. Protein interaction modules.

Graphical visualization of the top four network modules. Node fill colour indicates the measured fold-change, where green represents down regulated genes (light green < −1.5, dark green < −2) and red represents upregulated genes (orange <1.5, red >1.5, dark red >2). The node’s border colour indicates the subcellular localization of the protein (yellow for membrane and blue for extra cellular). Hexagon shape of the node represents DEGs and circular shape represents direct interacting proteins.
Immunostaining for Transgelin (sm22) is increased in PHN
In order to validate the microarray analysis, immunostaining was performed for the transgelin (gene with the highest mRNA increase). Figure 4 shows that transgelin staining was not detected in normal glomeruli. This was not a false negative, because transgelin staining was present in normal blood vessels, used as a positive internal control. In contrast, there was a marked increase in transgelin staining in podocytes in PHN rats. Taken together, these results validate that the protein levels were also increased, thus validating the microarray results.
Figure 4. SM22 levels in PHN.
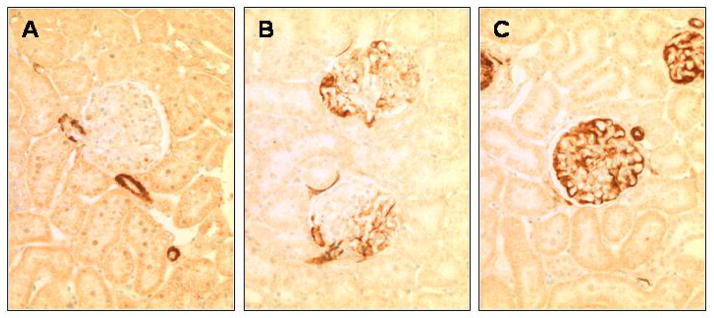
(A) Staining for SM22 is absent in control glomeruli, but is detected in the blood vessels. (B) SM22 staining is detected in the glomerulus at day 3 of PHN, in a podocyte distribution. (C) SM22 staining is markedly increased at day 6 of PHN in podocytes. Staining was absent when the primary antibody was omitted (not shown).
Discussion
Passive Heymann Nephritis (PHN) rat model of human membranous nephropathy is characterized by proteinuria developing within 5 days after the onset of disease [5, 30–32]. To date, only inhibitors of the renin-angiotensin aldosterone system have been effective clinically at reducing proteinuria. Thus, identifying novel targets for potential therapy is needed. In this manuscript we show increases in several genes during the onset of proteinuria that may offer therapeutic targets in the future.
Changes of Gene Expression
The onset of proteinuria is marked on the transcriptome with a change in gene expression. Our results shows that prior to the onset of proteinuria (day 3 of disease), there were 54 differentially expressed genes (DEGs) in rats with membranous nephropathy compared to controls. This number increased to 225 DEGs following the onset of proteinuria (day 6 of disease). Interestingly, 44 of these DEGs were increased at both time points. Of note, transgelin (Tagln) was the single most upregulated gene showing fold-change values greater than 30. Other genes differentially regulated in our model and previously studied include Col1a1 (Collagen type 1 alpha 1) [33], Ccnb2 (cyclin B2) [31], and Actn 4 (actinin alpha 4) [4].
The relative enrichment of genes from specific functional groups, changes from day 3 to day 6. Genes involved in cell structure and motility were highly upregulated at day three (figure 2). Among the 15 genes belonging to this group were for example vimentin (Vim) or myosin heavy polypeptide 9 (Myh9).
At day six, cell cycle associated genes comprise 26.7% of all enriched genes after the onset of proteinuria (figure 2). Cell cycle proteins are induced by reactive oxygen species that contribute largely to renal injury; ROS induce DNA repair and synthesis. In PHN at day six, cellular efforts in DNA repair and synthesis are down regulated by ribonucleotide reductase M2 (Rrm2). Rrm2 a rate limiting enzyme of DNA repair and synthesis, with a role in cell proliferation, tumorigenesis and drug resistance, is found 6.8 fold up regulated at day 6 [34]. Most of the up regulated genes are cell cycle inhibitors and cyclins that block proliferation. Cyclin kinase inhibitors were previously reported to be upregulated in experimental nephropathy [16], suggesting that podocytes are not prone to proliferate even after pronounced injury. Podocyte proliferation, like in crescentic glomerulonephritis or HIV associated nephropathy, is usually associated with rapid decline of renal function [35].
A functional group strongly overrepresented at both time points are genes involved in developmental processes (figure 2). Developmental genes represent 27.2% of all DEG at day three and 20.4% at day six. The strongest differentially regulated gene in the dataset, transgelin, is also called smooth muscle protein 22 alpha (SM22 alpha), it is a 22–25kDa actin binding protein usually associated with differentiation into smooth muscle like cell type. The mRNA coding for SM22 protein was found 70-fold upregulated at day three and 38-fold upregulated on day six (table 1). Our results also showed that the protein levels for SM22 were increased in PHN, as detected by immunostaining (figure 4). SM22 is a repressor of matrix metalloproteinase 9 (Mmp9), that functions as a type IV collagenase [36]. Mmp9 is involved in blood vessel remodelling and is involved in the proteolysis of collagen I and in the modification of platelet-derived growth factor (PDGF) [37], but more interestingly, VEGF is substrate of Mmp9. Other notable genes differentially regulated in our model that have been previously studied include Col1a1 (Collagen type 1 alpha 1) [33], Ccnb2 (cyclin B2) [31], and Actn4 (actinin alpha 4) [4].
Protein-Protein Interaction
DEGs were also screened for potential protein-protein interaction networks. 4 subnetworks could be identified (figure 3). As expected, certain of these proteins have already been studied as single proteins in glomerular injury [4, 31, 33, 38]. However, interconnections with other proteins have not been delineated and is therefore of major interest as it relates to the events in a systemic approach. The four clusters found describe the main processes in the glomerulus during the early phase of PHN coinciding and perhaps underlying the onset of proteinuria. These included: (i) DNA damage and repair genes (cluster 1); (ii) extra cellular matrix genes (cluster 2); (iii) deregulation of cytokines and growth factor genes (cluster 3); (iv) rearrangement of the cytoskeleton (cluster 4).
Cluster 1 represents the network with the highest density and the most interactions within the identified proteins (Figure 3.A). Proteins in this cluster are mainly involved in cell cycle. The five interacting proteins are Cdc2A, Ccnb1, Pcna, Gadd45a and Gadd45g. The Ccnb1 gene encodes Cyclin B1 protein. Together with Cdc2A (cell division cycle 2 protein), they form a serine/threonine kinase holoenzyme that is also known as maturation promoting factor (MPF). MPF induces the cell to undergo mitosis by phosphorylating cyclins and other cell division proteins.
The proliferation promoting action of Cdc2A and Ccnb1 as MPF is inhibited by Gadd45 (growth-arrest DNA damage-45). Gadd45 is a protein associated with DNA damage and is up-regulated in sublytic injury activated by C5b-9 [38].
When bases in the DNA are modified by reactive oxygen species (ROS), Gadd45 detects the modified sites by binding, thereby tagging them for repair. In the identified network Gadd45 interacts with Pcna (proliferating cell nuclear antigen) (Figure 3.A). Pcna has a role in DNA damage repair, as we have previously reported in this model [39]. In the current dataset Pcna was increased in PHN at day six as has been previously reported, suggesting activation of repair processes in the injured tissue [40]. Taken together, the protein-protein interactions support the hypothesis of ROS induced damage and repair. Also represented in this cluster, cell cycle inhibitory proteins are induced to prevent the cell from undergoing proliferation.
Proteins in cluster 2 (Figure 3.B) relate to extra cellular matrix proteins. One such protein is Fibronectin 1 (Fn1), is involved in many cellular processes and mechanisms like adhesion, fibrosis, cellular stress. Fn1 is increased by Tgf-β1 dependent and independent mechanism [41]. Fn1 and Tgf-β1 increase SPARC an extra cellular matrix protein, which is strongly correlated with podocyte loss due to mechanical strain [42]. Osteopontin, or Spp1 (secreted phosphoprotein 1) also present in cluster 2, is expressed in the distal tubular cells [43, 44]. Osteopontin, a protein ligand for CD44, which functions as lymphatic receptor for hyaluronic matrix proteins. Up-regulation of osteopontin in the kidney thereby influences monocyte migration into renal compartments and aggravates the immune response after the initial injury [45].
Cluster 3 demonstrates an interaction network of Tgf-β (transforming growth factor β) isoforms (Figure 3.C). Cytokines from the Tgf-β superfamily have a role in many cellular functions. Isoforms of Tgf-β are a major cause of renal fibrosis [46, 47]. We have previously reported on the differential expression of TGF-β isoforms in PHN [48]. Tgf-β has recently been shown to also induce podocyte apoptosis and reduce proliferation by limiting cell cycle progression [49]. In this model isoforms of Tgf-β were found stronger expressed after the onset of proteinuria, reflecting changes of the extra cellular matrix and complement injury.
DEGs in cluster 4 (Figure 3.D) are proteins with a structural function, some of which have a role in the cytoskeleton. For example, the extra cellular protein vimentin (Vim) was markedly increased after the onset of proteinuria. Vimentin is usually expressed in the mesenchymal tissues and upregulation suggests the early onset of mesenchymal transition of parts the glomerulus tissue. Vimentin expression is also associated in wound healing and is correlated with expression of smooth muscle proteins [50].
Myosin heavy polypeptide 9 (Myh9) is another structural protein with functions in cytoskeleton. Myh 9 encodes for myosin-IIA, a non-muscle myosin heavy chain protein. Myosin-IIA is part of the actinomyosin complex, it mediates cortical contraction in cell motility and is involved in changes of cell morphology in many cell types [51] and co-localizes with actin stress fibers [52].
Summary
The microarray data reported in this manuscript represent the serial changes in glomerular gene expression in early experimental membranous nephropathy prior to and following the onset of proteinuria. While many proteins and genes have been studied individually using other methods, profiling the full transcriptome broadens our understanding of the possible mechanisms underlying the onset and progression of PHN. Although merely descriptive in nature, microarray technology provides further insight into disease manifestation and progression, reveals novel protein interactions which serve to generate new hypotheses for further functional experiments and gives clues to potential novel therapeutic targets to modify disease.
Acknowledgments
Sources of support: This work was supported by the National Institute of Health (DK60525, DK56799, DK51096), by the American Diabetes Association and the Austrian Science Fund (Erwin Schrödinger J2415-B11 to P.H. and FWF P-15679 to R.O.). SJS is also an Established Investigator of the American Heart Association.
This work was supported by the National Institute of Health (DK60525, DK56799, DK51096), by the American Diabetes Association and Austrian Science Fund (Erwin Schrödinger J2415-B11 to P.H. and FWF P-15679 to R.O.). SJS is also an Established Investigator of the American Heart Association.
Literature
- 1.Cattran DC. Outcomes research in glomerulonephritis. Semin Nephrol. 2003;23:340–354. doi: 10.1016/s0270-9295(03)00062-7. [DOI] [PubMed] [Google Scholar]
- 2.Salant DJ, Darby C, Couser WG. Experimental membranous glomerulonephritis in rats. Quantitative studies of glomerular immune deposit formation in isolated glomeruli and whole animals. J Clin Invest. 1980;66:71–81. doi: 10.1172/JCI109837. [DOI] [PMC free article] [PubMed] [Google Scholar]
- 3.Salant DJ, Belok S, Madaio MP, Couser WG. A new role for complement in experimental membranous nephropathy in rats. J Clin Invest. 1980;66:1339–1350. doi: 10.1172/JCI109987. [DOI] [PMC free article] [PubMed] [Google Scholar]
- 4.Clement LC, Liu G, Perez-Torres I, Kanwar YS, Avila-Casado C, Chugh SS. Early changes in gene expression that influence the course of primary glomerular disease. Kidney Int. 2007;72:337–347. doi: 10.1038/sj.ki.5002302. [DOI] [PubMed] [Google Scholar]
- 5.Benigni A, Zoja C, Tomasoni S, Campana M, Corna D, Zanchi C, Gagliardini E, Garofano E, Rottoli D, Ito T, Remuzzi G. Transcriptional regulation of nephrin gene by peroxisome proliferator-activated receptor-gamma agonist: molecular mechanism of the antiproteinuric effect of pioglitazone. J Am Soc Nephrol. 2006;17:1624–1632. doi: 10.1681/ASN.2005090983. [DOI] [PubMed] [Google Scholar]
- 6.Eddy AA. Expression of genes that promote renal interstitial fibrosis in rats with proteinuria. Kidney Int Suppl. 1996;54:S49–54. [PubMed] [Google Scholar]
- 7.Minto AW, Fogel MA, Natori Y, O’Meara YM, Abrahamson DR, Smith B, Salant DJ. Expression of type I collagen mRNA in glomeruli of rats with passive Heymann nephritis. Kidney Int. 1993;43:121–127. doi: 10.1038/ki.1993.20. [DOI] [PubMed] [Google Scholar]
- 8.Raats CJ, van den Born J, Bakker MA, Oppers-Walgreen B, Pisa BJ, Dijkman HB, Assmann KJ, Berden JH. Expression of agrin, dystroglycan, and utrophin in normal renal tissue and in experimental glomerulopathies. Am J Pathol. 2000;156:1749–1765. doi: 10.1016/S0002-9440(10)65046-8. [DOI] [PMC free article] [PubMed] [Google Scholar]
- 9.Higgins JP, Shinghal R, Gill H, Reese JH, Terris M, Cohen RJ, Fero M, Pollack JR, van de Rijn M, Brooks JD. Gene expression patterns in renal cell carcinoma assessed by complementary DNA microarray. Am J Pathol. 2003;162:925–932. doi: 10.1016/S0002-9440(10)63887-4. [DOI] [PMC free article] [PubMed] [Google Scholar]
- 10.Moch H, Schraml P, Bubendorf L, Mirlacher M, Kononen J, Gasser T, Mihatsch MJ, Kallioniemi OP, Sauter G. High-throughput tissue microarray analysis to evaluate genes uncovered by cDNA microarray screening in renal cell carcinoma. Am J Pathol. 1999;154:981–986. doi: 10.1016/S0002-9440(10)65349-7. [DOI] [PMC free article] [PubMed] [Google Scholar]
- 11.Perco P, Pleban C, Kainz A, Lukas A, Mayer B, Oberbauer R. Gene expression and biomarkers in renal transplant ischemia reperfusion injury. Transpl Int. 2007;20:2–11. doi: 10.1111/j.1432-2277.2006.00376.x. [DOI] [PubMed] [Google Scholar]
- 12.Baelde HJ, Eikmans M, Doran PP, Lappin DW, de Heer E, Bruijn JA. Gene expression profiling in glomeruli from human kidneys with diabetic nephropathy. Am J Kidney Dis. 2004;43:636–650. doi: 10.1053/j.ajkd.2003.12.028. [DOI] [PubMed] [Google Scholar]
- 13.Susztak K, Bottinger E, Novetsky A, Liang D, Zhu Y, Ciccone E, Wu D, Dunn S, McCue P, Sharma K. Molecular profiling of diabetic mouse kidney reveals novel genes linked to glomerular disease. Diabetes. 2004;53:784–794. doi: 10.2337/diabetes.53.3.784. [DOI] [PubMed] [Google Scholar]
- 14.Hauser P, Schwarz C, Mitterbauer C, Regele HM, Muhlbacher F, Mayer G, Perco P, Mayer B, Meyer TW, Oberbauer R. Genome-wide gene-expression patterns of donor kidney biopsies distinguish primary allograft function. Lab Invest. 2004;84:353–361. doi: 10.1038/labinvest.3700037. [DOI] [PubMed] [Google Scholar]
- 15.Sadlier DM, Ouyang X, McMahon B, Mu W, Ohashi R, Rodgers K, Murray D, Nakagawa T, Godson C, Doran P, Brady HR, Johnson RJ. Microarray and bioinformatic detection of novel and established genes expressed in experimental anti-Thy1 nephritis. Kidney Int. 2005;68:2542–2561. doi: 10.1111/j.1523-1755.2005.00661.x. [DOI] [PubMed] [Google Scholar]
- 16.Shankland SJ, Floege J, Thomas SE, Nangaku M, Hugo C, Pippin J, Henne K, Hockenberry DM, Johnson RJ, Couser WG. Cyclin kinase inhibitors are increased during experimental membranous nephropathy: potential role in limiting glomerular epithelial cell proliferation in vivo. Kidney Int. 1997;52:404–413. doi: 10.1038/ki.1997.347. [DOI] [PubMed] [Google Scholar]
- 17.Davidson I, Henry JB. Clinical Diagnosis by Laboratory Methods. 19. Philadelphia: Saunders; 1969. p. 48. [Google Scholar]
- 18.Slot C. Plasma creatinine determination. A new and specific Jaffe reaction method. Scand J Clin Lab Invest. 1965;17:381–387. doi: 10.3109/00365516509077065. [DOI] [PubMed] [Google Scholar]
- 19.Ohse T, Pippin JW, Vaughan MR, Brinkkoetter PT, Krofft RD, Shankland SJ. Establishment of conditionally immortalized mouse glomerular parietal epithelial cells in culture. J Am Soc Nephrol. 2008;19:1879–1890. doi: 10.1681/ASN.2007101087. [DOI] [PMC free article] [PubMed] [Google Scholar]
- 20.Petermann AT, Hiromura K, Blonski M, Pippin J, Monkawa T, Durvasula R, Couser WG, Shankland SJ. Mechanical stress reduces podocyte proliferation in vitro. Kidney Int. 2002;61:40–50. doi: 10.1046/j.1523-1755.2002.00102.x. [DOI] [PubMed] [Google Scholar]
- 21.Irizarry RA, Bolstad BM, Collin F, Cope LM, Hobbs B, Speed TP. Summaries of Affymetrix GeneChip probe level data. Nucleic Acids Res. 2003;31:e15. doi: 10.1093/nar/gng015. [DOI] [PMC free article] [PubMed] [Google Scholar]
- 22.Rainer J, Sanchez-Cabo F, Stocker G, Sturn A, Trajanoski Z. CARMAweb: comprehensive R- and bioconductor-based web service for microarray data analysis. Nucleic Acids Res. 2006;34:W498–W503. doi: 10.1093/nar/gkl038. [DOI] [PMC free article] [PubMed] [Google Scholar]
- 23.Tusher VG, Tibshirani R, CHu G. Significance analysis of microarrays applied to the ionizing radiation response. Proc Natl Acad Sci U S A. 2001;98:5116–5121. doi: 10.1073/pnas.091062498. [DOI] [PMC free article] [PubMed] [Google Scholar]
- 24.Ashburner M, Ball CA, Blake JA, Botstein D, Butler H, Cherry JM, Davis AP, Dolinski K, Dwight SS, Eppig JT, Harris MA, Hill DP, Issel-Tarver L, Kasarskis A, Lewis S, Matese JC, Richardson JE, Ringwald M, Rubin GM, Sherlock G. Gene ontology: tool for the unification of biology. The Gene Ontology Consortium. Nat Genet. 2000;25:25–29. doi: 10.1038/75556. [DOI] [PMC free article] [PubMed] [Google Scholar]
- 25.Kanehisa M, Goto S. KEGG: kyoto encyclopedia of genes and genomes. Nucleic Acids Res. 2000;28:27–30. doi: 10.1093/nar/28.1.27. [DOI] [PMC free article] [PubMed] [Google Scholar]
- 26.Chen JY, Shen C, Sivachenko AY. Mining Alzheimer disease relevant proteins from integrated protein interactome data. Pac Symp Biocomput. 2006:367–378. [PubMed] [Google Scholar]
- 27.Brown KR, Jurisica I. Online predicted human interaction database. Bioinformatics. 2005;21:2076–2082. doi: 10.1093/bioinformatics/bti273. [DOI] [PubMed] [Google Scholar]
- 28.Bader GD, Hogue CW. An automated method for finding molecular complexes in large protein interaction networks. BMC Bioinformatics. 2003;4:2. doi: 10.1186/1471-2105-4-2. [DOI] [PMC free article] [PubMed] [Google Scholar]
- 29.Shannon P, Markiel A, Ozier O, Baliga NS, Wang JT, Ramage D, Amin N, Schwikowski B, Ideker T. Cytoscape: a software environment for integrated models of biomolecular interaction networks. Genome Res. 2003;13:2498–2504. doi: 10.1101/gr.1239303. [DOI] [PMC free article] [PubMed] [Google Scholar]
- 30.Nakatsue T, Koike H, Han GD, Suzuki K, Miyauchi N, Yuan H, Salant DJ, Gejyo F, Shimizu F, Kawachi H. Nephrin and podocin dissociate at the onset of proteinuria in experimental membranous nephropathy. Kidney Int. 2005;67:2239–2253. doi: 10.1111/j.1523-1755.2005.00328.x. [DOI] [PubMed] [Google Scholar]
- 31.Nangaku M, Shankland SJ, Couser WG. Cellular response to injury in membranous nephropathy. J Am Soc Nephrol. 2005;16:1195–1204. doi: 10.1681/ASN.2004121098. [DOI] [PubMed] [Google Scholar]
- 32.Saran AM, Yuan H, Takeuchi E, McLaughlin M, Salant DJ. Complement mediates nephrin redistribution and actin dissociation in experimental membranous nephropathy. Kidney Int. 2003;64:2072–2078. doi: 10.1046/j.1523-1755.2003.00305.x. [DOI] [PubMed] [Google Scholar]
- 33.Bonegio RG, Fuhro R, Wang Z, Valeri CR, Andry C, Salant DJ, Lieberthal W. Rapamycin ameliorates proteinuria-associated tubulointerstitial inflammation and fibrosis in experimental membranous nephropathy. J Am Soc Nephrol. 2005;16:2063–2072. doi: 10.1681/ASN.2004030180. [DOI] [PubMed] [Google Scholar]
- 34.Zhou B, Yen Y. Characterization of the human ribonucleotide reductase M2 subunit gene; genomic structure and promoter analyses. Cytogenet Cell Genet. 2001;95:52–59. doi: 10.1159/000057017. [DOI] [PubMed] [Google Scholar]
- 35.Griffin SV, Krofft RD, Pippin JW, Shankland SJ. Limitation of podocyte proliferation improves renal function in experimental crescentic glomerulonephritis. Kidney Int. 2005;67:977–986. doi: 10.1111/j.1523-1755.2005.00161.x. [DOI] [PubMed] [Google Scholar]
- 36.Nair RR, Solway J, Boyd DD. Expression cloning identifies transgelin (SM22) as a novel repressor of 92-kDa type IV collagenase (MMP-9) expression. J Biol Chem. 2006;281:26424–26436. doi: 10.1074/jbc.M602703200. [DOI] [PubMed] [Google Scholar]
- 37.Page-McCaw A, Ewald AJ, Werb Z. Matrix metalloproteinases and the regulation of tissue remodelling. Nat Rev Mol Cell Biol. 2007;8:221–233. doi: 10.1038/nrm2125. [DOI] [PMC free article] [PubMed] [Google Scholar]
- 38.Pippin JW, Durvasula R, Petermann A, Hiromura K, Couser WG, Shankland SJ. DNA damage is a novel response to sublytic complement C5b-9-induced injury in podocytes. J Clin Invest. 2003;111:877–885. doi: 10.1172/JCI15645. [DOI] [PMC free article] [PubMed] [Google Scholar]
- 39.Hiromura K, Haseley LA, Zhang P, Monkawa T, Durvasula R, Petermann AT, Alpers CE, Mundel P, Shankland SJ. Podocyte expression of the CDK-inhibitor p57 during development and disease. Kidney Int. 2001;60:2235–2246. doi: 10.1046/j.1523-1755.2001.00057.x. [DOI] [PubMed] [Google Scholar]
- 40.Xia L, Zheng L, Lee HW, Bates SE, Federico L, Shen B, O’Connor TR. Human 3- methyladenine-DNA glycosylase: effect of sequence context on excision, association with PCNA, and stimulation by AP endonuclease. J Mol Biol. 2005;346:1259–1274. doi: 10.1016/j.jmb.2005.01.014. [DOI] [PubMed] [Google Scholar]
- 41.Yung S, Lee CY, Zhang Q, Lau SK, Tsang RC, Chan TM. Elevated glucose induction of thrombospondin-1 up-regulates fibronectin synthesis in proximal renal tubular epithelial cells through TGF-beta1 dependent and TGF-beta1 independent pathways. Nephrol Dial Transplant. 2006;21:1504–1513. doi: 10.1093/ndt/gfl017. [DOI] [PubMed] [Google Scholar]
- 42.Durvasula RV, Shankland SJ. Mechanical strain increases SPARC levels in podocytes: implications for glomerulosclerosis. Am J Physiol Renal Physiol. 2005;289:F577–584. doi: 10.1152/ajprenal.00393.2004. [DOI] [PubMed] [Google Scholar]
- 43.Kohri K, Nomura S, Kitamura Y, Nagata T, Yoshioka K, Iguchi M, Yamate T, Umekawa T, Suzuki Y, Sinohara H. Structure and expression of the mRNA encoding urinary stone protein (osteopontin) J Biol Chem. 1993;268:15180–15184. [PubMed] [Google Scholar]
- 44.Kohri K, Suzuki Y, Yoshida K, Yamamoto K, Amasaki N, Yamate T, Umekawa T, Iguchi M, Sinohara H, Kurita T. Molecular cloning and sequencing of cDNA encoding urinary stone protein, which is identical to osteopontin. Biochem Biophys Res Commun. 1992;184:859–864. doi: 10.1016/0006-291x(92)90669-c. [DOI] [PubMed] [Google Scholar]
- 45.Yu XQ, Nikolic-Paterson DJ, Mu W, Giachelli CM, Atkins RC, Johnson RJ, Lan HY. A functional role for osteopontin in experimental crescentic glomerulonephritis in the rat. Proc Assoc Am Physicians. 1998;110:50–64. [PubMed] [Google Scholar]
- 46.Border WA, Noble NA. Transforming growth factor beta in tissue fibrosis. N Engl J Med. 1994;331:1286–1292. doi: 10.1056/NEJM199411103311907. [DOI] [PubMed] [Google Scholar]
- 47.Border WA, Okuda S, Languino LR, Sporn MB, Ruoslahti E. Suppression of experimental glomerulonephritis by antiserum against transforming growth factor beta1. Nature. 1990;346:371–374. doi: 10.1038/346371a0. [DOI] [PubMed] [Google Scholar]
- 48.Shankland SJ, Pippin J, Pichler RH, Gordon KL, Friedman S, Gold LI, Johnson RJ, Couser WG. Differential expression of transforming growth factor-beta isoforms and receptors in experimental membranous nephropathy. Kidney Int. 1996;50:116–124. doi: 10.1038/ki.1996.294. [DOI] [PubMed] [Google Scholar]
- 49.Schiffer M, Bitzer M, Roberts IS, Kopp JB, ten Dijke P, Mundel P, Bottinger EP. Apoptosis in podocytes induced by TGF-beta and Smad7. J Clin Invest. 2001;108:807–816. doi: 10.1172/JCI12367. [DOI] [PMC free article] [PubMed] [Google Scholar]
- 50.Ivanova L, Butt MJ, Matsell DG. Mesenchymal Transition in Kidney Collecting Duct Epithelial Cells. Am J Physiol Renal Physiol. 2008 doi: 10.1152/ajprenal.00326.2007. [DOI] [PubMed] [Google Scholar]
- 51.van Leeuwen FN, van Delft S, Kain HE, van der Kammen RA, Collard JG. Rac regulates phosphorylation of the myosin-II heavy chain, actinomyosin disassembly and cell spreading. Nat Cell Biol. 1999;1:242–248. doi: 10.1038/12068. [DOI] [PubMed] [Google Scholar]
- 52.Takubo T, Wakui S, Daigo K, Kurokata K, Ohashi T, Katayama K, Hino M. Expression of non-muscle type myosin heavy polypeptide 9 (MYH9) in mammalian cells. Eur J Histochem. 2003;47:345–352. [PubMed] [Google Scholar]