Abstract
Background
Commensal microbiota play a critical role in maintaining oral tolerance. The effect of food allergy on the gut microbial ecology remains unknown.
Objective
We sought to establish the composition of the gut microbiota in experimental food allergy and its role in disease pathogenesis.
Methods
Food allergy–prone mice with a gain-of-function mutation in the IL-4 receptor α chain (Il4raF709) and wild-type (WT) control animals were subjected to oral sensitization with chicken egg ovalbumin (OVA). Enforced tolerance was achieved by using allergen-specific regulatory T (Treg) cells. Community structure analysis of gut microbiota was performed by using a high-density 16S rDNA oligonucleotide microarrays (PhyloChip) and massively parallel pyrosequencing of 16S rDNA amplicons.
Results
OVA-sensitized Il4raF709 mice exhibited a specific microbiota signature characterized by coordinate changes in the abundance of taxa of several bacterial families, including the Lachnospiraceae, Lactobacillaceae, Rikenellaceae, and Porphyromonadaceae. This signature was not shared by similarly sensitized WT mice, which did not exhibit an OVA-induced allergic response. Treatment of OVA-sensitized Il4raF709 mice with OVA-specific Treg cells led to a distinct tolerance-associated signature coincident with the suppression of the allergic response. The microbiota of allergen-sensitized Il4raF709 mice differentially promoted OVA-specific IgE responses and anaphylaxis when reconstituted in WT germ-free mice.
Conclusion
Mice with food allergy exhibit a specific gut microbiota signature capable of transmitting disease susceptibility and subject to reprogramming by enforced tolerance. Disease-associated microbiota may thus play a pathogenic role in food allergy.
Keywords: Food allergy, microbiome, microbiota, regulatory T cells, tolerance, anaphylaxis, IgE, 16S rDNA, IL-4 receptor
It is unquestionable that food allergy has become a major health problem in developed countries, where the prevalence reaches up to 6% among children and 3% among adults.1,2 Like other atopic diseases, food allergies have a strong genetic component.3 However, the incidence of food allergy has increased dramatically in the last decades, particularly in affluent societies, pointing to lifestyle-associated environmental factors acting on genetically susceptible hosts to promote disease.4 Evidence suggests that the microbial flora are a key environmental influence in programming oral tolerance.5 Their lack in germ-free (GF) mice is associated with the development of TH2 and IgE responses to dietary antigens.6,7 Microbial signals, such as those delivered by polysaccharide A of the commensal bacterium Bacteroides fragilis or by a mix of clostridial species, induce mucosal tolerance by promoting the formation of induced regulatory T (iTreg) cells from naive CD4+ T-cell precursors.8,9 Polymorphisms in or deficiency of genetic elements encoding microbial sensors, such as CD14, a high-affinity receptor for bacterial LPSs, and Toll-like receptor 4, which mediates responses to LPS, are associated with food allergy.10,11
Changes in the microbial flora have been implicated in the pathogenesis of several disorders associated with the more affluent lifestyle common in developed countries. Obesity in both human subjects and experimental mouse models is associated with alterations in the intestinal microbiota that appear to be pathogenic, given that the microbiota of obese subjects promote weight gain when transferred into GF mice.12-14 More limited data have been accrued in the study of allergic diseases. In suboptimally controlled asthmatic subjects, both bacterial burden and bacterial diversity were significantly higher compared with those seen in control subjects and correlated with bronchial hyperresponsiveness.15 The development of atopy and atopic dermatitis is associated with altered early postnatal gut flora.16,17 In the case of food allergy and despite the well-known role of the commensal flora in oral tolerance induction, there is meager information on the status of the intestinal microbiota on disease onset and after tolerance establishment. One study found alterations in the microbiota of infants with milk allergy on diagnosis and again after treatment.18 Another study in which atopic dermatitis cohorts were examined for changes in the microbiota in association with allergic food sensitization found no such relationship.19 Limitations to the latter set of studies include reliance on bacterial culture methods, limited 16S RNA genotyping approaches, or both for microbiota analysis.18,19
In this study we employed a phylotyping approach using high-density 16S ribosomal DNA (rDNA) oligonucleotide microarrays (PhyloChip assay; Second Genome, San Bruno, Calif) and massively parallel pyrosequencing of 16S rDNA amplicons to investigate whether oral allergic sensitization to a dietary antigen is associated with a distinct intestinal microbiota signature. These studies were enabled by the use of a novel mouse model of food allergy that well replicates many of the features of the human disease. Using the same model, we also examined whether therapy with allergen-specific regulatory T (Treg) cells imparts a tolerance-associated signature on the host microbiota.
METHODS
Animals
BALB/cTac mice (wild-type [WT] and Il4raY709 mice) were originally from Taconic Farms (Germantown, NY) and maintained as a separate line in the investigator’s colony from which mice were used for the current studies. C.129.Il4raF709/F709 (Il4raF709) mice were bred onto the investigator’s BALB/cTac line for 11 generations.20 Foxp3EGFP and DO11.10+Foxp3EGFP mice, both on a BALB/c background, were previously described.20-22 All mice were kept on an ovalbumin (OVA)–free diet (Harlan 2018SX, Indianapolis, Ind). They were housed together in the same colony in a specific pathogen-free environment and were 8 to 12 weeks old when used for studies. All experiments were carried out in accordance with the Institutional Animal Care and Use Committee policies and procedures of the University of California–Los Angeles and the Boston Children’s Hospital.
Sensitization and challenge protocols
Studies were conducted on female mice to eliminate confounding effects of sex on the results of the microbiota analyses. In separate experiments there were no significant differences between male and female Il4raF709 mice in terms of sensitization and response to allergen challenge. For sensitization, female WT and Il4raF709 mice were treated intragastrically with sterile PBS or 100 μg of OVA alone or together with 10 μg of staphylococcal enterotoxin B (SEB; Sigma-Aldrich, St Louis, Mo) in 100 μL of sterile PBS (saline) once weekly for 8 weeks. On the ninth week, mice were challenged intragastrically with 5 or 150 mg of OVA in 100 μL of PBS. Anaphylaxis was assessed in challenged mice by measuring changes in body temperature and recording symptom scores. Temperature changes were measured with a rectal temperature probe (RET3) coupled to the Physitemp Thermalert Model TH-5 (Physitemp, Clifton, NJ). After OVA challenge, temperatures were measured every 5 minutes. Symptom scores were determined according to previously detailed criteria.22
For studies on flora-reconstituted GF mice, fecal pellets of either OVA/SEB-sensitized WT or Il4raF709 mice were collected on the eighth week of sensitization. The pellets were dissolved at 1 pellet (20-25 mg) in 100 μL of PBS and administered to GF mice at 200 μL per mouse. The mice were then sensitized with OVA/SEB for 8 weeks and challenged with OVA, as described above.
Tolerance induction
CD4+DO11.10+Foxp3EGFP+ T cells, representing thymus-derived (natural) Treg cells that express the DO11.10 T-cell receptor (TCR), which recognizes the OVA323-339 peptide in the context of I-Ad, were isolated by means of cell sorting from DO11.10+Foxp3EGFP mice. On day 0 of the sensitization protocol, Il4raF709 mice were given 5 × 10⁵ CD4+DO11.10+Foxp3EGFP+ T cells by means of retro-orbital transfer. The mice were then sensitized intragastrically with 100 μg of OVA in 100 μL of PBS once weekly for 8 weeks. They were challenged on week 9 with 5 mg of OVA in 100 μL of PBS administered intragastrically and monitored for their core body temperature and symptom scores, as described above.
ELISA for murine mast cell protease 1 and total and OVA-specific IgE
A murine mast cell protease 1 (mMCP-1) ELISA was performed on serum samples by using a kit (eBioscience, San Jose, Calif). Total and OVA-specific IgE concentrations were measured by using sandwich ELISAs. For total IgE, the capture and biotinylated detection antibodies (rat anti-mouse IgE clones R35-72 and R35-118, respectively) and purified mouse IgE isotype standard antibody (clone C38-2) were from BD Biosciences (San Jose, Calif). For OVA-specific IgE, the plates were coated with 100 μg/mL OVA. The detection antibody was as above, whereas the standard was a purified anti-OVA monoclonal IgE antibody (AbD Serotec, Oxford, United Kingdom).
Histologic analysis and enumeration of mast cells
Intestinal mast cells were enumerated by means of microscopic examination of sections of paraffin-embedded jejunal tissues stained with toluidine blue. Mast cells were counted and averaged across 10 high-power fields spanning the entire jejunum.
PhyloChip sample processing and hybridization
Fecal pellets were obtained from sham- and allergen-sensitized mice just before allergen challenge. DNA extraction was performed with the UltraClean Fecal extraction kit (Mo Bio, Carlsbad, Calif), according to the manufacturer’s instructions. A total of 50 to 100 ng of extracted DNA per sample was used to amplify bacterial 16S rDNA gene sequences by using PCR with the universal primers 27F (5′-AGAGTTTGATCCTGGCTCAG-3′) and 1492R (5′-GGTTACCTTGTTACGACTT-3′). Amplified products were hybridized to G3 PhyloChip arrays (Second Genome), which display 1,016,064 16S rDNA oligonucleotide probes that track microbial population shifts across greater than 59,000 operational taxonomic units (OTUs), each mapped to the Greengenes taxonomy.23-25 OTUs are defined as organisms that share sequence similarity of their 16S rDNA, which for most OTUs is greater than 99%. The hybridization procedures were as described in the aforementioned references.
Bioinformatics
Details of the PhyloChip data analyses, including data preprocessing and reduction, construction of sample-to-sample distance functions, ordination, clustering, and classification methods and phylogenetic tree construction and visualization, are detailed in the Methods section in this article’s Online Repository at www.jacionline.org.
Statistical analysis
Results of allergen challenge studies were analyzed by using 2-way ANOVA. The Adonis test was used for finding significant microbiota differences associated with discrete categorical or continuous variables. Taxa were in some cases filtered to those significantly increased in their ranked HybScore in one category compared with the alternate categories by using the Kruskal-Wallis (KW) test. A P value of less than .05 was considered significant. Subgroup analysis for phylogenetic diversity was carried out by using 1-way ANOVA.
Other methods
Flow cytometric analyses and intracellular cytokine staining, PhyloChip and 16S rDNA pyrosequencing methods, and related statistical analyses are detailed in the Methods section in this article’s Online Repository.
RESULTS
Oral allergic sensitization of Il4raF709 mice is associated with the acquisition of a specific microbiota signature
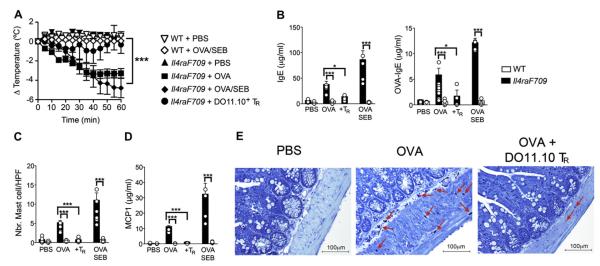
Il4raF709 mice carry a gain-of-function mutation in the IL-4 receptor (IL-4R) α chain that disrupts the binding of the Src homology domain 2–containing protein tyrosine phosphatase 1 (SHP-1) to the receptor subunit and leads to augmented signal transducer and activator of transcription 6 (STAT6) activation by IL-4 and IL-13.20 Il4raF709 mice, but not WT control mice, are particularly susceptible to oral sensitization with innocuous food allergens, such as the chicken egg protein OVA, and sensitized mice respond to oral challenge with anaphylaxis that proceeds in a mast cell– and IgE-dependent manner.22 Mutant Il4raF709 mice were either sham sensitized with PBS or sensitized with OVA, either alone or mixed with the oral adjuvant SEB, by means of oral gavage once weekly for 8 weeks to determine whether oral allergic sensitization results in a change in the intestinal microbiota.22,26 As noted previously, OVA- and OVA/SEB-sensitized, but not sham-sensitized, Il4raF709 mice had anaphylaxis on oral challenge with OVA, as evidenced by the decrease in core body temperature, and onset of diarrhea and tissue edema (Fig 1, A, and data not shown).22 Anaphylaxis was associated with increased total and OVA-specific serum IgE antibody levels, mast cell expansion in small intestinal tissues, and increased serum concentrations of the mast cell protease mMCP-1 compared with unsensitized Il4raF709 mice (Fig 1, B-E). Comparison of OVA- and OVA/SEB-sensitized mice revealed concordant temperature and biomarker responses on OVA challenge but more robust responses with the latter. In contrast, WT mice subjected to the same sensitization protocol with PBS or OVA/SEB did not have anaphylaxis and exhibited marginal or no increases in the aforementioned biomarkers.
FIG 1.
Oral sensitization and anaphylaxis in Il4raF709 mice: prevention of oral sensitization by antigen-specific Treg cells. A, Il4raF709 and WT BALB/c control mice were either sham sensitized with PBS or sensitized with OVA (100 μg) or OVA/SEB (100 μg/10 μg) by means of gastric gavage once weekly for 8 weeks. Select groups of mice were administered intravenously at the start of the sensitization protocol (day 0), either 5 × 10⁵ cells of DO11.10+ Treg(TR) cells isolated from DO11.10+Foxp3EGFP mice or PBS. At the end of the sensitization period, mice were challenged with 5 mg of OVA by means of gastric gavage and monitored for rectal temperature changes. B, Total (left) and OVA-specific (right) serum IgE levels measured after OVA challenge. C, Enumeration of mast cell infiltration of small intestinal tissues of sensitized mice. D, Serum mMCP-1 levels in mice after OVA challenge. E, Small intestinal histopathology of sham (PBS)–sensitized, OVA-sensitized, and OVA-sensitized/DO11.10+ Treg cell–treated mice (toluidine blue staining; original magnification ×200). Results represent data on 5 to 10 mice per group derived from 2 independent experiments. *P < .05 and ***P < .001,2-way ANOVA.
Oral tolerance is dependent on adaptive forkhead box protein 3 (Foxp3)–positive Treg cells and is abrogated on their depletion or inhibition.27,28 Significantly, anaphylaxis was abrogated by the treatment of Il4raF709 mice with CD4+DO11.10+Foxp3EGFP+ Treg cells, which harbor a bicistronic Foxp3EGFP allele and express the OVA323-339 peptide–specific TCR DO11.10. The core temperature decrease and the small intestinal tissue edema pursuant to the OVA challenge were prevented (Fig 1, A and E). Treg cell treatment also suppressed total and OVA-specific IgE production, mast cell expansion and tissue infiltration, and mMCP-1 release (Fig 1, B-E).
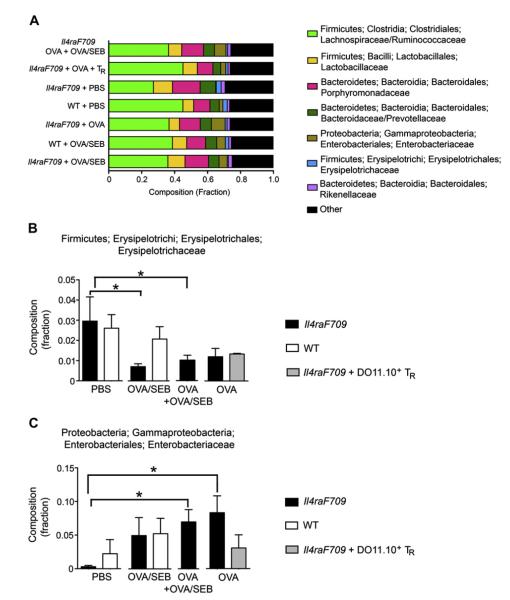
To determine the effect of oral sensitization on the intestinal microbiota, we analyzed the relative abundance of bacterial phyla in fecal pellets of the different mouse groups by using PhyloChip 16S rDNA oligonucleotide microarrays (Fig 2, A). The microbiota of OVA-sensitized Il4raF709 mice (including the OVA/SEB group and the combination of OVA+OVA/SEB-sensitized groups), but not that of sensitized WT mice, exhibited a significant decrease in the relative abundance of the Firmicutes family Erysipelotrichi/Erysipelotrichales/Erysipelotrichaceae compared with that seen in sham-sensitized mice (Fig 2, B). They also exhibited a significant increase in the relative abundance of the Proteobacteria family Gammaproteobacteria, Enterobacteriales, and Enterobacteriaceae (Fig 2, C).
FIG 2.
Effect of allergen sensitization on phylogenetic diversity. A, Relative abundance of the different microbial phyla in fecal samples of WT and Il4raF709 mice that were either sham sensitized with PBS or sensitized with OVA or OVA/SEB. The combined profile of OVA- and OVA/SEB-sensitized Il4raF709 mice is also shown, as is that of OVA-sensitized Il4raF709 mice that have been treated with allergen-specific Treg cells. B, Relative abundance of the Firmicutes Erysipelotrichi/Erysipelotrichales/Erysipelotrichaceae family in the different groups. C, Relative abundance of the Proteobacteria/Gammaproteobacteria/Enterobacteriales/Enterobacteriaceae family in the different groups. Results represent 4 to 6 mice per group. *P < .05, 1-way ANOVA with posttest analysis.
Analysis of fecal pellets collected at the end of the sensitization period revealed that the intestinal microbiota of OVA- and OVA/SEB-sensitized Il4raF709 mice were not significantly different when directly compared by using the presence/absence of taxa and abundance of metric criteria (Adonis P = .594 and .361, respectively). Also, the 97 taxa found to be differentially abundant between the 2 groups, as determined by using the KW test, could not partition the samples into distinct groups (data not shown). Accordingly, we combined the 2 groups in many of our subsequent statistical analyses.
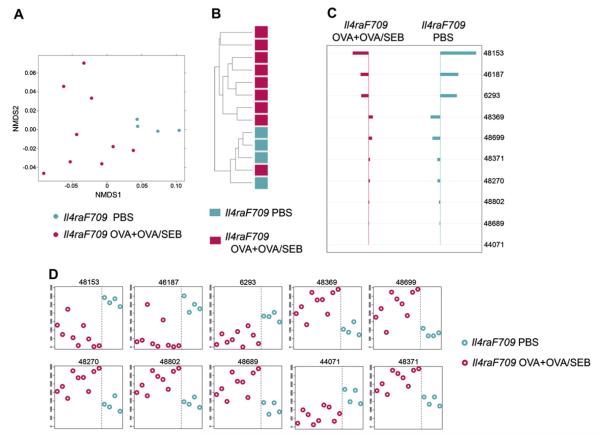
Direct comparison of the intestinal microbiota of the combination of OVA- and OVA/SEB-sensitized Il4raF709 mice with that of sham (PBS)–sensitized Il4raF709 mice by using the presence/absence of taxa criterion revealed a significant difference in microbial profiles (Adonis P = .042 for the OVA plus OVA/SEB vs PBS groups). Of a total of 3422 OTUs found to be present in at least 1 of the samples, 251 were identified by using the KW filter to have significantly different abundances between the OVA+OVA/SEB versus PBS groups. We used 2 ordination methods, nonmetric multidimensional scaling (NMDS) and hierarchical clustering-average-neighbor (HC-AN) analyses, which examine relationships between ecologic communities, such as those of the microbial flora, to determine whether those OTUs identified by using the KW filter discriminate between sham- and allergen-sensitized Il4raF709 mice.29,30 Results revealed that the identified taxa successfully partitioned the mice into 2 distinct groups, with only 1 of 9 OVA plus OVA/SEB–sensitized mice clustering with the sham-sensitized mice (Fig 3, A and B). Investigation of significant taxa the abundance of which best discriminates between sham- and allergensensitized Il4raF709 mice was carried out by using Prediction Analysis for Microarrays (PAM), an algorithm that uses a nearest shrunken centroid method to determine those OTUs most characteristic of a community.31 Results identified 10 OTUs, mainly Bacteriodetes, that discriminated between the 2 categories, including several expanded Porphyromonadaceae, Barnesiella, and Rikenellaceae species (Fig 3, C and D, and see Table E1 in this article’s Online Repository at www.jacionline.org).
FIG 3.
Allergen sensitization of Il4raF709 mice is associated with a microbiotic signature. A, NMDS based on weighted UniFrac distance between samples of sham-sensitized versus OVA- and OVA/SEB-sensitized mice performed on the 251 taxa the abundance of which was significantly different between groups (sham versus allergen sensitized) by using the KW test. B, Hierarchical clustering (average linkage) based on weighted UniFrac distance between samples given abundance of 251 taxa with significant abundance differences across at least 1 of the categories. C, Nearest shrunken centroid analysis of OTUs that best characterize the difference between the sham- versus allergen-sensitized groups. The direction of the horizontal bars reflects either overrepresentation or underrepresentation of the indicated OTUs (left- and right-sided bars, respectively). The length of the bar represents the magnitude of the effect. D, Representation of the abundance of the OTUs identified by the nearest shrunken centroid analysis using the PAM method. Nine mice were used for the OVA+OVA/SEB group (n = 5 and 4 mice, respectively), and 5 mice were used for the PBS group.
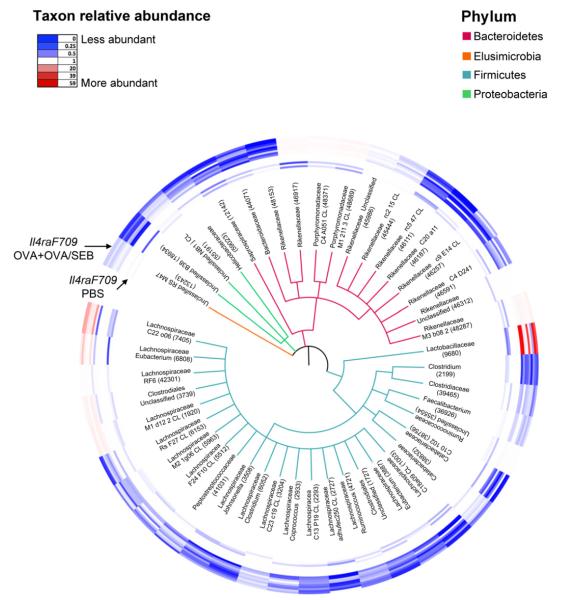
The alterations in the microbiota affected by oral allergen sensitization were further visualized by using a circular phylogenetic tree that displayed 45 differentially abundant OTUs, representing the 41 bacterial families covered by the 251 taxa that passed the KW filter. The abundance of the represented OTUs among the different samples was revealed by means of a heat map that ranges from blue (decreased) to red (increased). There was a broad decrease in the abundance of a majority of the selected OTUs, especially those of the Lachnospiraceae families, in allergen-compared with sham-sensitized Il4raF709 mice, although there were notable exceptions, such as Lactobacillaceae, Porphyromonadaceae, and some Rikenellaceae and Lachnospiraceae species (Fig 4 and see Table E2 in this article’s Online Repository at www.jacionline.org). Overall, the results shown in Figs 3 and 4 confirmed that the establishment of oral allergic sensitization in the Il4raF709 mice is associated with dysbiosis of the intestinal flora.
FIG 4.
Phylogenetic tree based on 16S rDNA gene sequences of bacterial families with taxa showing significantly different abundances between the sham- and allergen-sensitized Il4raF709 mice shown in Fig 3. Of the 3422 OTUs found present in at least 1 of the samples, 251 OTUs within 41 families were identified by using the KW test to be differentially abundant between the 2 groups. For each family, 1 OTU with the greatest difference between the 2 group means was selected. For the 4 families that contained OTUs with both higher and lower abundance scores, both OTUs were selected. A representative 16S rDNA gene from each of the 45 OTUs was aligned and used to infer a phylogenetic tree. The rings around the tree comprise a heat map in which the inner ring includes the sham-treated and the outer ring includes the OVA+OVA/SEB-treated samples. The color saturation indicates the degree of difference from the mean value of the sham-treated samples, where dark blue indicates a ratio of 0 (least abundant), white indicates a ratio of 1.0 (equivalent abundance), and dark red indicates a ratio of 59 (most abundant).
To confirm the results obtained with the PhyloChip analysis, we used direct, highly parallel pyrosequencing of 16S rDNA amplicons derived from fecal samples of separate independent cohorts of sham- and OVA-sensitized Il4raF709 mice. Results revealed that the microbial communities were significantly different between the 2 groups of mice (see Fig E1 in this article’s Online Repository at www.jacionline.org). With the caveat that the 16S rDNA pyrosequencing method had different depth of coverage and other technical differences compared with the Phylo-Chip analysis, several families and genera were also found by using the former method to differentiate between the 2 groups, including OTUs classifying to the genera Clostridium, Bacteroides, Alistipes, and Streptococcus (see Table E3 in this article’s Online Repository at www.jacionline.org).
Allergen-specific Treg cell therapy induces a tolerance-associated microbiota signature
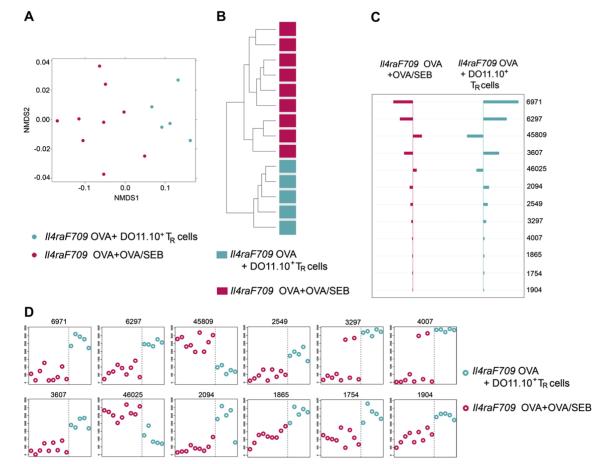
We next examined whether the induction of a food allergy–associated microbiota signature can be suppressed by enforced tolerance with allergen-specific Treg cells. Accordingly, we compared the intestinal microbiota of Il4raF709 mice that have been sensitized with OVA or OVA/SEB with those of similarly sensitized mice that have been intravenously administered Treg cells bearing the DO11.10 TCR specific for the immunodominant OVA peptide 323-339 (OVA323-339). Therapy with Treg cells suppressed allergen sensitization and prevented the clinical, histologic, and serologic correlates of anaphylaxis (Fig 1). In contrast, therapy with CD4+DO11.10+Foxp3EGFP− cells or with CD4+DO11.10+ cells that express a nonfunctional Foxp3 mutant protein did not induce tolerance (Noval Rivas et al, manuscript in preparation). Direct comparison of the microbiota of the 2 categories revealed that the intestinal microbiota of DO11.10+ Treg cell–treated and OVA-sensitized mice were significantly different in the abundance metrics from those of sham (PBS)–treated, OVA-sensitized Il4raF709 mice (Adonis P = .007). Analysis of those taxa passing the KW test for differences between the 2 categories identified 627 taxa to have different abundance levels. NMDS with these taxa shows relatively tight clustering of Treg cell–suppressed samples and a broader variation in the samples of the OVA- and OVA/SEB-sensitized but Treg cell–untreated samples. HC-AN with these KW-filtered OTUs showed complete segregation of the OVA- and OVA/SEB-sensitized samples from the Treg cell–suppressed samples (Fig 5, A and B). PAM analysis identified 10 OTUs that discriminate between the 2 groups: 8 members of the Firmicutes Lachnospiraceae family that are increased on tolerance induction and 2 in the Bacteroidetes Porphyromonadaceae family that are decreased on tolerance induction (Fig 5, C and D, and see Table E4 in this article’s Online Repository at www.jacionline.org).
FIG 5.
Enforced tolerance with allergen-specific Treg cells resets the microbiota of allergen-sensitized Il4raF709 mice. A, NMDS based on weighted UniFrac distance between samples of OVA- and OVA/SEB-sensitized mice (n = 9) versus those of Treg cell–treated, OVA-sensitized mice (n = 5) based on the 627 taxa with significantly different abundance between groups (sham versus allergen sensitized) by using the KW test. B, Hierarchical clustering (average linkage) based on weighted UniFrac distance between samples given abundance of 627 taxa with significant abundance differences across at least 1 of the categories. C, Nearest shrunken centroid analysis of OTUs that best characterize the difference between allergensensitized versus tolerant groups. D, Representation of the abundance of the OTUs identified by the nearest shrunken centroid analysis using the PAM method.
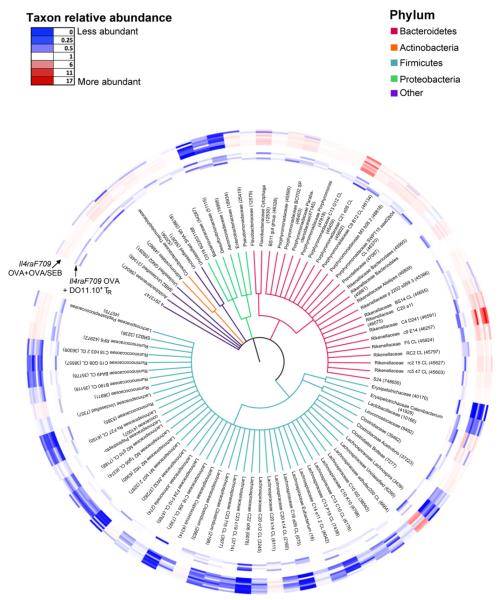
A global representation of the effects of Treg cell therapy on the microbiota of allergen-sensitized mice was provided by a phylogenetic tree representation of 86 differentially abundant OTUs, representing the 78 bacterial families covered by the 627 taxa that passed the KW filter (Fig 6). There was a broad resetting by means of Treg cell therapy of the changes in the microbiota induced by allergen sensitization, with reversal of the shifts in the abundance of several Firmicutes Lachnospiraceae and Bacteroidetes Porphyromonadaceae and Rickenellaceae families induced on sensitization (see Table E5 in this article’s Online Repository at www.jacionline.org). However, although Treg cell therapy altered the microbiota of allergen-sensitized mice, it did not shift it back to baseline. Direct comparison of the microbiota of tolerized and sham-treated Il4raF709 mice revealed the 2 categories to be significantly different both in incidence and abundance (Adonis P =.013 and .011, respectively). KW filtering identified 786 taxa that had significantly different abundance levels in samples from sham-sensitized compared with tolerized mice and that completely segregated the 2 groups of samples into separate clusters (Fig E2, A and B, in this article’s Online Repository at www.jacionline.org). PAM analysis identified 10 OTUs that best segregated the 2 groups, most from the Firmicutes Lachnospiraceae family (see Fig E2, C and D, and Table E6 in this article’s Online Repository at www.jacionline.org). Overall, these results established that enforcement of oral tolerance by means of Treg cell therapy inhibited the emergence of the microbiota signature associated with experimental food allergy.
FIG 6.
Phylogenetic tree based on 16S rDNA gene sequences of bacterial families with taxa showing significantly different abundances between allergen (OVA+OVA/SEB)-sensitized Il4raF709 mice and Treg cell-treated OVA-sensitized Il4raF709 mice shown in Fig 5. KW analysis identified 627 OTUs within 78 families that have significantly different abundance between the comparison groups. One OTU with the greatest difference between the 2 group means from each family was selected. For the 8 families that contained OTUs with both higher and lower abundance scores, both OTUs were selected. The rings around the tree comprise a heat map in which the inner rings represent the samples of tolerized mice and the outer rings represent those of allergen-sensitized mice. The color saturation indicates the degree of difference from the mean value of the sham-treated samples, where dark blue indicates a ratio of 0 (least abundant), white indicates a ratio of 1.0 (equivalent abundance), and dark red indicates a ratio of 17 (most abundant).
The microbiota changes of Il4raF709 and WT mice are nonoverlapping
Oral sensitization of WT BALB/c mice with OVA/SEB does not induce appreciable IgE responses and systemic anaphylaxis on oral challenge with OVA.22 We set out to determine whether oral allergen sensitization of WT was associated with changes in the microbiota. Direct comparison of the microbiota of OVA/SEB-sensitized versus sham-sensitized WT mice did not reveal statistically significant differences between the 2 groups (data not shown). To determine whether the dysbiosis observed with allergen-sensitized Il4raF709 mice was distinct from that of WT mice, we first compared the microbiota of sham-sensitized Il4raF709 and WT mice. Direct comparison identified the microbiota of the respective category to be significantly different both in the incidence and abundance metrics (Adonis P =.031 and .032, respectively; see Fig E3 and Table E7 in this article’s Online Repository at www.jacionline.org). In a separate analysis direct, highly parallel pyrosequencing was performed on 16S rDNA amplicons from fecal samples of otherwise unmanipulated WT and Il4raF709 littermate mice that were derived from matings of Il4raF709 heterozygous parents and sharing the same cages. The results confirmed that the microbial communities of the respective group were significantly different (see Fig E4 in this article’s Online Repository at www.jacionline.org).
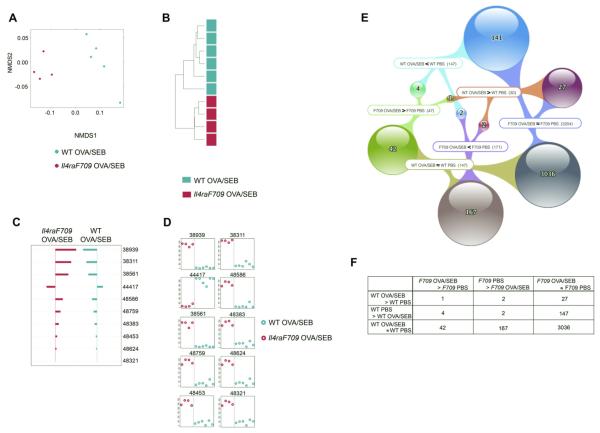
We then compared the intestinal microbiota of OVA/SEB-sensitized Il4raF709 mice with those of similarly sensitized WT mice. NMDS and HC-AN analysis of 352 taxa identified by the KW filter to have differential abundance in OVA/SEB-sensitized Il4raF709 versus WT mice completely segregated the samples into 2 distinct groups (Fig 7, A and B). Of the 10 taxa found by using PAM to best discriminate between the 2 groups, 9 were increased in Il4raF709 mice (Ruminococcaceae, Rikenellaceae, and Porphyromonadaceae species; Fig 7, C and D, and see Table E8 in this article’s Online Repository at www. jacionline.org). These results were validated by using direct, highly parallel pyrosequencing of 16S rDNA amplicons derived from fecal samples of independent cohorts of OVA-sensitized WT and Il4raF709 mice (see Fig E5 and Table E9 in this article’s Online Repository at www.jacionline.org).
FIG 7.
The microbiota signatures of allergen-sensitized Il4raF709 and WT mice are distinct. A, NMDS based on weighted UniFrac distance between samples of OVA/SEB-sensitized WT versus OVA/SEB-sensitized Il4raF709 mice based on the 352 taxa with significantly different abundance between groups by using the KW test. B, Hierarchical clustering based on weighted UniFrac distance between samples. C, Nearest shrunken centroid analysis of OTUs that best characterize the difference between the groups. D, Representation of the abundance of the OTUs identified by using the nearest shrunken centroid analysis with the PAM method. E, Venn diagram showing the abundance levels of different OTUs in relation to the sensitization state of WT and Il4raF709 mice. The labels define the abundance states of sets of OTUs in relation to specific comparison groups, such as F709 OVA/SEB<F709 PBS, which identifies those OTUs that are less abundant in allergen-sensitized (OVA/SEB) Il4raF709 mice compared with sham (PBS)–sensitized mice. The number of OTUs thus identified is indicated in parentheses. Spheres indicate intersections between 2 sets, and the colored webs show which intersection of sets form the spheres. F, Contingency table representation of the results shown in the Venn diagram. P < .0001 by using the χ2 test (excluding the 3036 OTUs that did not change on sensitization in both WT and Il4raF709 mice). Six mice for the WT OVA/SEB group versus 4 mice for the Il4raF709 OVA/SEB group.
We further examined the overlap of those taxa that were specifically increased, decreased, or unchanged on OVA/SEB sensitization of Il4raF709 and WT mice relative to sham-sensitized, genotype-matched mice. Results revealed that there was very little overlap in the microbiota change in sensitized Il4raF709 versus WT mice (Fig 7, E and F). Finally, similar trends were obtained when the combined data from the OVA-sensitized and OVA/SEB-sensitized Il4raF709 mice were compared with those of OVA/SEB-sensitized WT mice (see Fig E6 in this article’s Online Repository at www.jacionline.org). Overall, these results established that successful oral allergic sensitization in the Il4raF709 mutant mice was associated with a specific microbial signature that was nonoverlapping with changes in the microbiota of similarly treated WT mice, which are otherwise nonresponsive to sensitization.
The microbiota of food allergic Il4raF709 mice transmit susceptibility to food allergy
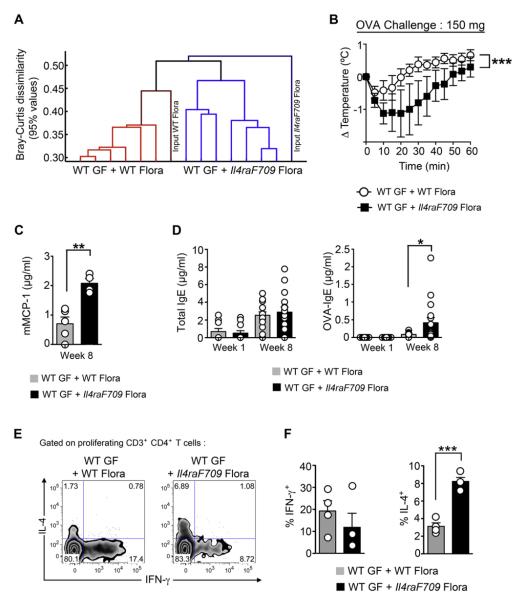
To explore the functional implications of the changed microbial flora in experimental food allergy, we reconstituted WT GF mice with flora derived from either OVA-sensitized WT or Il4raF709 mice. Flora-replete WT mice were then sensitized with OVA/SEB for 8 weeks and challenged with OVA. 16S rDNA pyrosequencing analysis revealed the microbiota of the flora-replete mice segregated in accordance with the source of the input microbiota (fecal samples of OVA-sensitized WT vs Il4raF709 mice; Fig 8, A). Results revealed that the WT GF mice that were reconstituted with flora of OVA-sensitized Il4raF709 mice but not that of OVA-sensitized WT mice underwent anaphylaxis on challenge with a heightened oral dose of OVA (150 mg), as evidenced by a decrease in core body temperature and increase in serum mMCP-1 concentrations (Fig 8, B and C). Analysis of total and OVA-specific IgE responses revealed that although the total IgE levels were not significantly different between the 2 groups, the OVA-specific IgE response was significantly higher in those mice reconstituted with flora from OVA-sensitized Il4raF709 mice (Fig 8, D). Further analysis revealed that the microbiota of the mutant mice, but not those of the WT control animals, elicited TH2 skewing of the OVA-responsive CD4 T cells isolated from the mesenteric lymph nodes (Fig 8, E and F). These results indicate that the dysbiosis in the OVA-sensitized Il4raF709 mice promoted allergen-specific IgE responses and systemic anaphylaxis, which is consistent with a pathogenic function of the microbiota of allergen-sensitized Il4raF709 mice in fostering disease.
FIG 8.
The gut microbiota of allergen-sensitized Il4raF709 mice promote allergen-specific responses and anaphylaxis. A, Agglomerative clustering of donor and recipient stool samples based on 16S OTUs derived from 16S pyrosequencing data. The y-axis represents Bray-Curtis dissimilarity values computed on the relative abundances of OTUs in each sample. A Bray-Curtis value of 0 indicates identical microbial communities, and a Bray-Curtis value of 1 indicates communities with no overlapping OTUs. Heights of lines on the dendrogram indicate Bray-Curtis values at the 95th percentile. B, Core body temperature changes in flora-reconstituted, OVA/SEB-sensitized WT GF mice challenged with 150 mg of OVA. The mice were reconstituted with flora from OVA/SEB-sensitized Il4raF709 or WT BALB/c mice and then sensitized with OVA/SEB and challenged with OVA. Conventional sham- and OVA/SEB-sensitized Il4raF709 mice were used as control animals. C, Serum mMCP-1 levels in flora-reconstituted mice after OVA challenge. D, Total and OVA-specific IgE antibody responses in flora-reconstituted mice. E, Representative flow cytometric analysis of OVA-specific mesenteric CD4+ T cells of flora-reconstituted GF mice producing IL-4 and IFN-γ. F, Enumeration of the percentages of cytokine-producing T cells shown in Fig 8, E. Results represent data from 6 to 12 flora-reconstituted WT GF mice per group derived from 2 independent experiments. *P < .05, **P < .005, ***P < .001, 1- and 2-way ANOVA with posttest analysis.
DISCUSSION
The studies reported herein identified several novel features of the microbiota in food allergy. First, the microbial communities of food allergy–prone Il4raF709 mice were distinct at baseline from those of congenic but food allergy–resistant WT control mice, which is consistent with the sculpting of the gut microbiota by a genetically driven TH2 environment. Allergic sensitization of the Il4raF709 mutant resulted in the further emergence of a food allergy–associated microbiota signature that was virtually nonoverlapping with the changes in the microbiota of similarly sensitized WT mice that otherwise did not have disease. Furthermore, tolerance enforcement by means of treatment with allergen-specific Treg cells prevented the development of the food allergy–associated microbiota signature in Il4raF709 mice and resulted instead in the emergence of a distinct tolerance-associated signature. Finally, the functional relevance of food allergy–associated dysbiosis was revealed by the differential capacity of the flora of allergen-sensitized Il4raF709 mice, but not those of sensitization-resistant WT mice, to upregulate OVA-specific TH2 and IgE responses and to promote anaphylaxis when reconstituted in GF WT mice. Thus allergic dysbiosis provides one mechanism contributing to the pathogenesis of food allergy.
The pathways involved in directing the changes in the microbiota of the food allergy–prone Il4raF709 mice remain unknown. However, it can be inferred that the altered microbial ecology in Il4raF709 mice, both at baseline and on sensitization, is related to the augmented signaling along the IL-4Rα–STAT6 axis induced by the F709 substitution.20 Enhanced STAT6 signaling can act through any one of several putative mechanisms to alter the microbiota, including alterations in epithelial-commensal flora interactions in the profile of defensins expressed in the gut (which in turn reflects on the microbiota profile), alterations in other components of the innate and adaptive immune responses relevant to the microbial ecology, or both. Augmented Il4raF709–STAT6 signaling can also effect the gut microbiota by augmenting the expression of resistin-like β (Retnlb), which is expressed under basal conditions in gut goblet cells in a microbial flora-dependent manner and the expression of which is also induced by TH2 signaling.32 Our previous studies have documented the exaggerated upregulation of Retnlb in the lungs of Il4raF709 mice undergoing paradigms of allergic airway inflammation.20
An interesting observation that emerges from these studies is the relationship of tolerance induction to the composition of the microbiota. Enforced tolerance resets the microbiota to a new signature distinct from those of both sham- and OVA-sensitized Il4raF709 mice. Significantly, it could be demonstrated that unlike WT mice, Il4raF709 mice exhibit defective formation and function of OVA-specific Foxp3+ iTreg cells on OVA sensitization (Noval Rivas et al, manuscript in preparation). Thus the loss of regulatory circuits restraining the TH2 response in the gut might underlie the shifts in the microbial flora both at baseline and on OVA sensitization of the food allergy–prone Il4raF709 mice.
The full mechanism or mechanisms by which the microbiota of allergen-sensitized Il4raF709 mice contribute to disease pathogenesis remain to be determined, but previous studies provide insights into how such changes might promote disease. Components of the microbiota have been demonstrated to directly affect the differentiation, function, or both of Treg and effector T cells.8,9,33,34 Studies on mechanisms of tolerance induction by the commensal bacterium Bacteroides fragilis have demonstrated the capacity of its product polysaccharide A to promote Foxp3+ Treg cell formation by signaling through Toll-like receptor 2 receptors on T cells.35 Loss of polysaccharide A abrogated tolerance induction by B fragilis and promoted instead TH17 formation. These findings raise the possibility that the changes in the commensal flora in Il4raF709 mice might adversely affect iTreg cell formation and function. Yet another mechanism could involve the direct promotion of allergic inflammation by components of the food allergy–associated microbiota in a manner similar to the promotion of TH17 cells by segmented filamentous bacteria.36-38
The association of oral allergic sensitization in a food allergy–prone experimental model with specific changes in the microbiota suggests that similar changes might be operative in the human disease. Some previous studies with bacterial cultures and early-generation 16S rDNA assays have intimated that such changes can indeed occur in the human host, although those observations have been conflicted, possibly because of the technical limitations of these methodologies.18,19 Profiling of bacterial 16S ribosomal RNA by using rDNA arrays and deep sequencing approaches promises detailed characterization of the microbiota in different subsets of patients with food allergy.39 The results of such approaches might be useful in guiding the diagnosis and classification of different phenotypes of food allergy and in aiding therapeutic interventions, including those with probiotic bacteria, that aim to restore a tolerogenic microbiota.40
Supplementary Material
Key messages.
The microbiota of food allergic hosts are altered in a specific, reproducible manner.
They transmit disease susceptibility to naive, germ-free recipients.
They are subject to reprogramming upon enforced tolerance with allergen-specific regulatory T cells.
Acknowledgments
Supported by National Institutes of Health grants AI 080002 (to T.A.C.), AI007512 (to O.T.B.), DK034854 and DK078938 (to L.B.), HL07627 (to G.K.G.), AI100889 (to H.C.O.), and DK078938 (to S.K.M.); a grant from the Alkek Foundation (to J.F.P.); and the Department of Defense Congressionally Directed Medical Research Program in Food allergy grant FA100085 (to T.A.C.).
Abbreviations used
- Foxp3
Forkhead box protein 3
- GF
Germ free
- HC-AN
Hierarchical clustering-average-neighbor
- IL-4R
IL-4 receptor
- iTreg
Induced regulatory T
- KW
Kruskal-Wallis
- mMCP-1
Murine mast cell protease 1
- NMDS
Nonmetric multidimensional scaling
- OTU
Operational taxonomic unit
- OVA
Ovalbumin
- PAM
Prediction Analysis for Microarrays
- rDNA
Ribosomal DNA
- SEB
Staphylococcal enterotoxin B
- STAT6
Signal transducer and activator of transcription 6
- TCR
T-cell receptor
- Treg
Regulatory T
- WT
Wild-type
Footnotes
Disclosure of potential conflict of interest: C. Chehoud, J. Kuczynski, T. DeSantis, and J. Warrington are employees of Second Genome. E. R. Hyde has received support from The Alkek Foundation. G. K. Gerber, L. Bry, and H. C. Oettgen have received research support from the National Institutes of Health. The rest of the authors declare that they have no relevant conflicts of interest.
REFERENCES
- 1.Eigenmann PA, Beyer K, Wesley Burks A, Lack G, Liacouras CA, Hourihane JO, et al. New visions for food allergy: an iPAC summary and future trends. Pediatr Allergy Immunol. 2008;19(suppl 19):26–39. doi: 10.1111/j.1399-3038.2008.00765.x. [DOI] [PubMed] [Google Scholar]
- 2.Sicherer SH, Sampson HA. Food allergy. J Allergy Clin Immunol. 2010;125(suppl):S116–25. doi: 10.1016/j.jaci.2009.08.028. [DOI] [PubMed] [Google Scholar]
- 3.Hong X, Tsai HJ, Wang X. Genetics of food allergy. Curr Opin Pediatr. 2009;21:770–6. doi: 10.1097/MOP.0b013e32833252dc. [DOI] [PMC free article] [PubMed] [Google Scholar]
- 4.Sicherer SH. Epidemiology of food allergy. J Allergy Clin Immunol. 2011;127:594–602. doi: 10.1016/j.jaci.2010.11.044. [DOI] [PubMed] [Google Scholar]
- 5.Round JL, Mazmanian SK. The gut microbiota shapes intestinal immune responses during health and disease. Nat Rev Immunol. 2009;9:313–23. doi: 10.1038/nri2515. [DOI] [PMC free article] [PubMed] [Google Scholar]
- 6.Sudo N, Sawamura S, Tanaka K, Aiba Y, Kubo C, Koga Y. The requirement of intestinal bacterial flora for the development of an IgE production system fully susceptible to oral tolerance induction. J Immunol. 1997;159:1739–45. [PubMed] [Google Scholar]
- 7.Rodriguez B, Prioult G, Bibiloni R, Nicolis I, Mercenier A, Butel MJ, et al. Germ-free status and altered caecal subdominant microbiota are associated with a high susceptibility to cow’s milk allergy in mice. FEMS Microbiol Ecol. 2011;76:133–44. doi: 10.1111/j.1574-6941.2010.01035.x. [DOI] [PubMed] [Google Scholar]
- 8.Round JL, Mazmanian SK. Inducible Foxp3+ regulatory T-cell development by a commensal bacterium of the intestinal microbiota. Proc Natl Acad Sci U S A. 2010;107:12204–9. doi: 10.1073/pnas.0909122107. [DOI] [PMC free article] [PubMed] [Google Scholar]
- 9.Atarashi K, Tanoue T, Shima T, Imaoka A, Kuwahara T, Momose Y, et al. Induction of colonic regulatory T cells by indigenous Clostridium species. Science. 2011;331:337–41. doi: 10.1126/science.1198469. [DOI] [PMC free article] [PubMed] [Google Scholar]
- 10.Woo JG, Assa’ad A, Heizer AB, Bernstein JA, Hershey GK. The -159 C→T polymorphism of CD14 is associated with nonatopic asthma and food allergy. J Allergy Clin Immunol. 2003;112:438–44. doi: 10.1067/mai.2003.1634. [DOI] [PubMed] [Google Scholar]
- 11.Bashir ME, Louie S, Shi HN, Nagler-Anderson C. Toll-like receptor 4 signaling by intestinal microbes influences susceptibility to food allergy. J Immunol. 2004;172:6978–87. doi: 10.4049/jimmunol.172.11.6978. [DOI] [PubMed] [Google Scholar]
- 12.Turnbaugh PJ, Ley RE, Mahowald MA, Magrini V, Mardis ER, Gordon JI. An obesity-associated gut microbiome with increased capacity for energy harvest. Nature. 2006;444:1027–31. doi: 10.1038/nature05414. [DOI] [PubMed] [Google Scholar]
- 13.Turnbaugh PJ, Hamady M, Yatsunenko T, Cantarel BL, Duncan A, Ley RE, et al. A core gut microbiome in obese and lean twins. Nature. 2009;457:480–4. doi: 10.1038/nature07540. [DOI] [PMC free article] [PubMed] [Google Scholar]
- 14.Turnbaugh PJ, Backhed F, Fulton L, Gordon JI. Diet-induced obesity is linked to marked but reversible alterations in the mouse distal gut microbiome. Cell Host Microbe. 2008;3:213–23. doi: 10.1016/j.chom.2008.02.015. [DOI] [PMC free article] [PubMed] [Google Scholar]
- 15.Huang YJ, Nelson CE, Brodie EL, Desantis TZ, Baek MS, Liu J, et al. Airway microbiota and bronchial hyperresponsiveness in patients with suboptimally controlled asthma. J Allergy Clin Immunol. 2011;127:372–81. e1–3. doi: 10.1016/j.jaci.2010.10.048. [DOI] [PMC free article] [PubMed] [Google Scholar]
- 16.Wang M, Karlsson C, Olsson C, Adlerberth I, Wold AE, Strachan DP, et al. Reduced diversity in the early fecal microbiota of infants with atopic eczema. J Allergy Clin Immunol. 2008;121:129–34. doi: 10.1016/j.jaci.2007.09.011. [DOI] [PubMed] [Google Scholar]
- 17.Kalliomaki M, Kirjavainen P, Eerola E, Kero P, Salminen S, Isolauri E. Distinct patterns of neonatal gut microflora in infants in whom atopy was and was not developing. J Allergy Clin Immunol. 2001;107:129–34. doi: 10.1067/mai.2001.111237. [DOI] [PubMed] [Google Scholar]
- 18.Thompson-Chagoyan OC, Vieites JM, Maldonado J, Edwards C, Gil A. Changes in faecal microbiota of infants with cow’s milk protein allergy2a Spanish prospective case-control 6-month follow-up study. Pediatr Allergy Immunol. 2010;21:e394–400. doi: 10.1111/j.1399-3038.2009.00961.x. [DOI] [PubMed] [Google Scholar]
- 19.Adlerberth I, Strachan DP, Matricardi PM, Ahrne S, Orfei L, Aberg N, et al. Gut microbiota and development of atopic eczema in 3 European birth cohorts. J Allergy Clin Immunol. 2007;120:343–50. doi: 10.1016/j.jaci.2007.05.018. [DOI] [PubMed] [Google Scholar]
- 20.Tachdjian R, Al Khatib S, Schwinglshackl A, Kim HS, Chen A, Blasioli J, et al. In vivo regulation of the allergic response by the IL-4 receptor alpha chain immunoreceptor tyrosine-based inhibitory motif. J Allergy Clin Immunol. 2010;125:1128–36.e8. doi: 10.1016/j.jaci.2010.01.054. [DOI] [PMC free article] [PubMed] [Google Scholar]
- 21.Haribhai D, Lin W, Relland LM, Truong N, Williams CB, Chatila TA. Regulatory T cells dynamically control the primary immune response to foreign antigen. J Immunol. 2007;178:2961–72. doi: 10.4049/jimmunol.178.5.2961. [DOI] [PubMed] [Google Scholar]
- 22.Mathias CB, Hobson SA, Garcia-Lloret M, Lawson G, Poddighe D, Freyschmidt EJ, et al. IgE-mediated systemic anaphylaxis and impaired tolerance to food antigens in mice with enhanced IL-4 receptor signaling. J Allergy Clin Immunol. 2011;127:795–805. e1–6. doi: 10.1016/j.jaci.2010.11.009. [DOI] [PMC free article] [PubMed] [Google Scholar]
- 23.Hazen TC, Dubinsky EA, DeSantis TZ, Andersen GL, Piceno YM, Singh N, et al. Deep-sea oil plume enriches indigenous oil-degrading bacteria. Science. 2010;330:204–8. doi: 10.1126/science.1195979. [DOI] [PubMed] [Google Scholar]
- 24.Mendes R, Kruijt M, de Bruijn I, Dekkers E, van der Voort M, Schneider JH, et al. Deciphering the rhizosphere microbiome for disease-suppressive bacteria. Science. 2011;332:1097–100. doi: 10.1126/science.1203980. [DOI] [PubMed] [Google Scholar]
- 25.McDonald D, Price MN, Goodrich J, Nawrocki EP, Desantis TZ, Probst A, et al. An improved Greengenes taxonomy with explicit ranks for ecological and evolutionary analyses of bacteria and archaea. ISME J. 2012;6:610–8. doi: 10.1038/ismej.2011.139. [DOI] [PMC free article] [PubMed] [Google Scholar]
- 26.Ganeshan K, Neilsen CV, Hadsaitong A, Schleimer RP, Luo X, Bryce PJ. Impairing oral tolerance promotes allergy and anaphylaxis: a new murine food allergy model. J Allergy Clin Immunol. 2009;123:231–8.e4. doi: 10.1016/j.jaci.2008.10.011. [DOI] [PMC free article] [PubMed] [Google Scholar]
- 27.Hadis U, Wahl B, Schulz O, Hardtke-Wolenski M, Schippers A, Wagner N, et al. Intestinal tolerance requires gut homing and expansion of FoxP3+ regulatory T cells in the lamina propria. Immunity. 2011;34:237–46. doi: 10.1016/j.immuni.2011.01.016. [DOI] [PubMed] [Google Scholar]
- 28.Mucida D, Kutchukhidze N, Erazo A, Russo M, Lafaille JJ, Curotto de Lafaille MA. Oral tolerance in the absence of naturally occurring Tregs. J Clin Invest. 2005;115:1923–33. doi: 10.1172/JCI24487. [DOI] [PMC free article] [PubMed] [Google Scholar]
- 29.Legendre P, Legendre L. Numerical ecology. 2nd ed Elsevier; Amsterdam: 1998. [Google Scholar]
- 30.Shepard RN. Multidimensional scaling, tree-fitting, and clustering. Science. 1980;210:390–8. doi: 10.1126/science.210.4468.390. [DOI] [PubMed] [Google Scholar]
- 31.Tibshirani R, Hastie T, Narasimhan B, Chu G. Diagnosis of multiple cancer types by shrunken centroids of gene expression. Proc Natl Acad Sci U S A. 2002;99:6567–72. doi: 10.1073/pnas.082099299. [DOI] [PMC free article] [PubMed] [Google Scholar]
- 32.Hildebrandt MA, Hoffmann C, Sherrill-Mix SA, Keilbaugh SA, Hamady M, Chen YY, et al. High-fat diet determines the composition of the murine gut microbiome independently of obesity. Gastroenterology. 2009;137:1716–24. e1–2. doi: 10.1053/j.gastro.2009.08.042. [DOI] [PMC free article] [PubMed] [Google Scholar]
- 33.Lathrop SK, Bloom SM, Rao SM, Nutsch K, Lio CW, Santacruz N, et al. Peripheral education of the immune system by colonic commensal microbiota. Nature. 2011;478:250–4. doi: 10.1038/nature10434. [DOI] [PMC free article] [PubMed] [Google Scholar]
- 34.Littman DR, Pamer EG. Role of the commensal microbiota in normal and pathogenic host immune responses. Cell Host Microbe. 2011;10:311–23. doi: 10.1016/j.chom.2011.10.004. [DOI] [PMC free article] [PubMed] [Google Scholar]
- 35.Round JL, Lee SM, Li J, Tran G, Jabri B, Chatila TA, et al. The Toll-like receptor 2 pathway establishes colonization by a commensal of the human microbiota. Science. 2011;332:974–7. doi: 10.1126/science.1206095. [DOI] [PMC free article] [PubMed] [Google Scholar]
- 36.Ivanov II, Atarashi K, Manel N, Brodie EL, Shima T, Karaoz U, et al. Induction of intestinal Th17 cells by segmented filamentous bacteria. Cell. 2009;139:485–98. doi: 10.1016/j.cell.2009.09.033. [DOI] [PMC free article] [PubMed] [Google Scholar]
- 37.Salzman NH, Hung K, Haribhai D, Chu H, Karlsson-Sjoberg J, Amir E, et al. Enteric defensins are essential regulators of intestinal microbial ecology. Nat Immunol. 2010;11:76–83. doi: 10.1038/ni.1825. [DOI] [PMC free article] [PubMed] [Google Scholar]
- 38.Gaboriau-Routhiau V, Rakotobe S, Lecuyer E, Mulder I, Lan A, Bridonneau C, et al. The key role of segmented filamentous bacteria in the coordinated maturation of gut helper T cell responses. Immunity. 2009;31:677–89. doi: 10.1016/j.immuni.2009.08.020. [DOI] [PubMed] [Google Scholar]
- 39.Knights D, Parfrey LW, Zaneveld J, Lozupone C, Knight R. Human-associated microbial signatures: examining their predictive value. Cell Host Microbe. 2011;10:292–6. doi: 10.1016/j.chom.2011.09.003. [DOI] [PMC free article] [PubMed] [Google Scholar]
- 40.Manichanh C, Reeder J, Gibert P, Varela E, Llopis M, Antolin M, et al. Reshaping the gut microbiome with bacterial transplantation and antibiotic intake. Genome Res. 2010;20:1411–9. doi: 10.1101/gr.107987.110. [DOI] [PMC free article] [PubMed] [Google Scholar]
Associated Data
This section collects any data citations, data availability statements, or supplementary materials included in this article.


