

Stathmin depletion, acting partially via microtubules, delays cells during G2 of the cell cycle through reduced activation of both Aurora kinase A and Polo-like kinase 1.
Abstract
Depletion of stathmin, a microtubule (MT) destabilizer, delays mitotic entry by ∼4 h in HeLa cells. Stathmin depletion reduced the activity of CDC25 and its upstream activators, Aurora A and Plk1. Chemical inhibition of both Aurora A and Plk1 was sufficient to delay mitotic entry by 4 h, while inhibiting either kinase alone did not cause a delay. Aurora A and Plk1 are likely regulated downstream of stathmin, because the combination of stathmin knockdown and inhibition of Aurora A and Plk1 was not additive and again delayed mitotic entry by 4 h. Aurora A localization to the centrosome required MTs, while stathmin depletion spread its localization beyond that of γ-tubulin, indicating an MT-dependent regulation of Aurora A activation. Plk1 was inhibited by excess stathmin, detected in in vitro assays and cells overexpressing stathmin–cyan fluorescent protein. Recruitment of Plk1 to the centrosome was delayed in stathmin-depleted cells, independent of MTs. It has been shown that depolymerizing MTs with nocodazole abrogates the stathmin-depletion induced cell cycle delay; in this study, depolymerization with nocodazole restored Plk1 activity to near normal levels, demonstrating that MTs also contribute to Plk1 activation. These data demonstrate that stathmin regulates mitotic entry, partially via MTs, to control localization and activation of both Aurora A and Plk1.
INTRODUCTION
Several current cancer therapies are aimed at halting cell division, and most do so by disrupting the microtubule (MT) cytoskeleton (Jordan and Wilson, 2004). However, these therapies also damage normal tissue and therefore have widespread toxicity. More selective approaches are being developed that target MT accessory proteins and/or exploit possible synergies between new and current therapies (Jordan and Kamath, 2007; Mitra et al., 2011; Leinung et al., 2012).
The MT regulatory protein, stathmin, has been implicated in the survival of certain cancer cell lines, including those missing a functional p53 protein. Depleting cells of stathmin leads to slowed growth (Zhang et al., 2006; Chen et al., 2007; Wang et al., 2007; Carney and Cassimeris, 2010; Carney et al., 2012), an accumulation of cells with 4N DNA content (Alli et al., 2002; Mistry et al., 2005), and an increased occurrence of apoptosis (Alli et al., 2007; Belletti and Baldassare, 2011). However, the mechanisms slowing proliferation and causing cell death have not been defined but are known, at least in some cases, to depend on loss of both p53 and stathmin (Carney and Cassimeris, 2010). Interpretations by others have suggested that stathmin depletion leads to a G2/M (Johnsen et al., 2000; Polager and Ginsberg, 2003) or mitotic block (Alli et al., 2007); however, stathmin is phosphorylated during mitosis at four serine sites by cyclin-dependent kinase (CDKs) and other protein kinases and is functionally off with respect to MT regulation (Larsson et al., 1997; Holmfeldt et al., 2009). We previously demonstrated that stathmin depletion in HeLa cells leads to an accumulation of cells in the G2 cell cycle stage (Carney and Cassimeris, 2010) and an increase in the interphase duration without a change in the timing of mitosis (Carney et al., 2012). On the basis of these data, we hypothesized that stathmin-depleted cancer cells were slowed in G2 prior to mitotic entry.
The commitment to enter mitosis relies on integration of various environmental and cellular inputs that either drive or slow progression into mitosis by regulating the activation state of cyclin B/CDK1. Beginning in early G2, cyclin B level rises in the cytosol, and by mid-G2, cyclin B accumulates on centrosomes in complex with CDK1, forming what is historically known as the maturation-promoting factor (Lindqvist et al., 2009). The cyclin B/CDK1 complex is both negatively and positively regulated by phosphorylations by Wee1 kinase at T14 and Y15 and by CAK1 at T160. CDC25 B/C phosphatases remove the inhibitory phosphorylation allowing for full kinase activity. Accumulation of active CDC25, a key component of the “mitotic trigger,” occurs rapidly (Trunnell et al., 2011). The events leading to maximal activation of CDK1 are highly regulated. Positive- and negative-feedback pathways ensure that the commitment to enter mitosis, including nuclear envelope breakdown, occurs only when all checkpoints have been satisfied (Rieder, 2011). DNA damage, defects in Golgi fragmentation, perturbations of proteins functioning in cell adhesion, and activation of cellular stress pathways, such as those involving p38, can arrest cells in G2 until the stressor or damage is addressed (Ando et al., 2007; Molli et al., 2010; Persico et al., 2010; Reinhardt et al., 2010; Michal et al., 2012). Most of these inhibitory signals directly or indirectly converge at the level of CDK1 via CDC25 phosphatase activation at the centrosome (Perry and Kornbluth, 2007).
The centrosome serves as the major localization site for enzymes controlling mitotic entry, in addition to its role as the MT-organizing center of the cell (Kramer et al., 2004). There is evidence to support overlap of these processes; in particular, mitotic enzymes such as Plk1 and Aurora A kinase (AURKA) regulate MT nucleation and assembly on centrosomes (Kang et al., 2006; Katayama et al., 2008; Toya et al., 2011; Xu and Dai, 2011). Therefore it is likely that MTs may in turn also affect activity and/or localization of these molecules.
The MT cytoskeleton also functions in signal transduction, acting either through MT dynamics or through sequestration of MT-interacting proteins (Gundersen and Cook, 1999; Rieder and Cole, 2000; Ezratty et al., 2005; Efimov and Kaverina, 2009). Stathmin binds tubulin dimers and/or MTs to control partitioning of tubulin between the soluble and polymer pools (Holmfeldt et al., 2007; Sellin et al., 2008). Stathmin also regulates MT nucleation at centrosomes and therefore sets MT number (Howell et al., 1999; Ringhoff and Cassimeris 2009).
From our previous results showing that cells depleted of stathmin were delayed in the G2 phase of the cell cycle, we concluded that stathmin was necessary for timely progression through G2 and entry into mitosis (Carney and Cassimeris, 2010). Additionally, we found that the delay induced by stathmin depletion could be abrogated by treatment with nocodazole to depolymerize MTs, suggesting that stathmin's role is carried out via MTs, a new function for the MT cytoskeleton in mitotic entry (Carney et al., 2012). To determine the cause of delayed mitotic entry induced by stathmin depletion, we examined the signaling pathways that converge on cyclin B/CDK1 activation. We found that levels of active AURKA and Plk1 were significantly decreased in stathmin-depleted prophase cells and that a G2 delay could be induced by treatment with chemical inhibitors to not one, but to both AURKA and Plk1 enzymes. These data support a model wherein decreased stathmin level delays mitotic entry by inhibiting both of these enzymes. To test whether AURKA and Plk1 were regulated by stathmin via MTs, we treated stathmin-depleted cells with nocodazole and were able to partially restore activity of Plk1 but not of AURKA. We discovered that AURKA localization at the centrosome and its subsequent activation was abolished by nocodazole treatment, indicating a role for MTs in AURKA recruitment to the centrosome. Plk1 recruitment to centrosomes was delayed in stathmin-depleted cells, and this delayed recruitment was independent of MTs. Collectively these data indicate that stathmin, at least partially through its effects on MTs, regulates mitotic entry by controlling activation of both AURKA and Plk1, a novel role for MTs in cell cycle progression.
RESULTS
Common G2 checkpoint pathways are not activated by stathmin depletion
To determine why loss of stathmin delays mitotic entry, we first asked whether stathmin depletion activated upstream checkpoint pathways that ultimately reduce CDK1 activation. Small interfering RNA (siRNA) transfection reduced stathmin protein level to ∼25% of that in cells transfected with a nontargeting siRNA. Protein depletion was detected within 24 h and knockdown was maintained beyond 48 h posttransfection (Figure 1A; note that a short hairpin RNA [shRNA] targeting a second region in stathmin produced the same knockdown and delay in G2; Carney and Cassimeris, 2010). We had previously shown that stathmin depletion increased the population of cells staining positive for CDK1Y15P (inhibitory phosphorylation), indicating that cyclin B/CDK1 complexes were present but less active in these cells (Carney and Cassimeris, 2010). The inhibitory phosphorylation is removed by CDC25 phosphatases (Figure 1B). We found that active CDC25, marked by phosphorylation at T48, a modification necessary for full phosphatase activity (Izumi and Maller, 1993), was reduced in stathmin-depleted cells (Supplemental Figure S1). Several G2 checkpoint pathways converge on CDC25, where activation of a checkpoint inhibits CDC25 activation. We examined several G2 checkpoint proteins for modifications that could lead to decreased CDC25 activation. We did not find evidence to support activation of these upstream pathways, including: p38 (via phosphorylation on T180 or Y182), DNA damage responsive pathways (via CHK1 phosphorylation on S317), or Wee 1 kinase (predominantly regulated by protein level). Additionally, cyclin B protein levels accumulated normally in these cells (unpublished data), indicating that the delayed mitotic entry was not due to disruption of an earlier event. Because we saw diminished activation of CDC25 phosphatase without activation of several upstream pathways that respond to signals and inhibit CDC25, we next examined the activation of AURKA and Plk1, two enzymes able to activate CDC25.
FIGURE 1:

Active Aurora A at the centrosome is reduced in stathmin-depleted HeLa cells. (A) Stathmin level was reduced by ∼ 75% by siRNA compared with siGLO-transfected control cells. Western blot for stathmin, reprobed for tubulin as a loading control. (See also Carney and Cassimeris, 2010; Carney et al., 2012). Lysates were isolated 48 h after transfection, but depletion was equally evident at 24 h. (B) Outline of AURKA and Plk1 activation of CDC25 and/or CDK1 at mitotic entry and feedback between these proteins (reviewed in Lindqvist et al., 2009). (C) Representative images of maximum intensity projections of Z-stacks of active Aurora A at prophase centrosomes. Fixed cells were stained with an antibody against Aurora A (T288P; green in merged images) and propidium iodide to stain DNA (red in merged images). (D) Box plot of the relative fluorescence intensity of active AURKA (T288P) at the centrosomes of prophase cells measured from immunofluorescence images. (E) Western blot for total AURKA protein, reprobed for GAPDH as a loading control. Neither stathmin depletion nor p53 expression changed AURKA expression (see Figure S2 for p53 restoration by depletion of HPV protein E6). (F) Box plot of the relative fluorescence intensity of total AURKA at the centrosomes of prophase cells measured from immunofluorescence images. For (D and F) images were analyzed for fluorescence staining intensity as described in Materials and Methods. Values for each cell were normalized to the average of control cells, and statistical significance was determined using Student's t test. Plots represent normalized data pooled from three independent experiments with at least seven cells per treatment for each experiment. **, p < 0.01.
Stathmin depletion reduces active AURKA on centrosomes
Because AURKA plays a major role in activation of CDC25 and is part of a positive-feedback loop including Plk1 and CDC25 that fully activates CDK1/cyclin B (Dutertre et al., 2004; Figure 1B), we examined the levels of active AURKA in stathmin-depleted HeLa cells. In late G2, AURKA is recruited to the centrosome, where it is activated following its dimerization, which facilitates autophosphorylation at T288 (Eyers et al., 2003; Joukov et al., 2010). Phosphorylation of T288 is typically used as a convenient marker of active AURKA (Ohashi et al., 2006). We found that the amount of active AURKA at the centrosomes of HeLa cells was reduced to ∼50% of control levels, as determined by quantitative immunofluorescence using an antibody specific for AURKA T288P (Figure 1, C and D). This reduced activation was not due to a reduction in total AURKA protein level (Figure 1, E and F).
Our previous data indicated that loss of both stathmin and p53 was necessary for slowed cell proliferation (Alli et al., 2007; Carney and Cassimeris, 2010), so we also asked whether p53 protein level contributed to the decline in active AURKA, or whether the inhibition was strictly dependent on stathmin. HeLa cells normally lack detectable levels of p53, because the human papilloma virus (HPV) protein E6, present in these cells, targets p53 for proteasomal degradation (Scheffner et al., 1990). Depletion of viral protein E6 in HeLa cells allowed p53 to accumulate (Koivusalo et al., 2005; Figure S2). Restoring p53 did not change the levels of either total or active AURKA at centrosomes (Figure 1, C–E). We also found that regardless of p53 level, stathmin depletion was sufficient to decrease AURKA T288P levels, indicating that stathmin, and not p53, controls activation of AURKA at the centrosome (Figure 1, C and D) in these cells.
Inhibiting AURKA with specific kinase inhibitor S 1451 is not sufficient to slow mitotic entry
We next asked whether partial inhibition of AURKA was sufficient to delay mitotic entry by treatment with a chemical inhibitor. Using a specific inhibitor to AURKA, S 1451, which blocks phosphorylation of AURKA on T288 (Yuan et al., 2012), we treated HeLa cells with 300 nM S 1451 and measured the phosphorylation states of AURKA and Plk1. The inhibitor concentration was chosen based on published IC50 values (Aliagas-Martin et al., 2009) and confirmed in cell proliferation assays (unpublished data). We found that the level of AURKA T288P at centrosomes in S 1451–treated HeLa cells was reduced to 50% of that seen in dimethyl sulfoxide (DMSO)-treated cells (Figure 2A), which matches the reduction in active AURKA measured after stathmin depletion (see Figure 1, C and D). We found that treatment with S 1451 did not change the level of active Plk1 (T210P) (unpublished data), which was surprising, because AURKA activity is necessary for Plk1 activation (Seki et al., 2008). It is possible that the residual 50% active AURKA is sufficient to activate Plk1.
FIGURE 2:
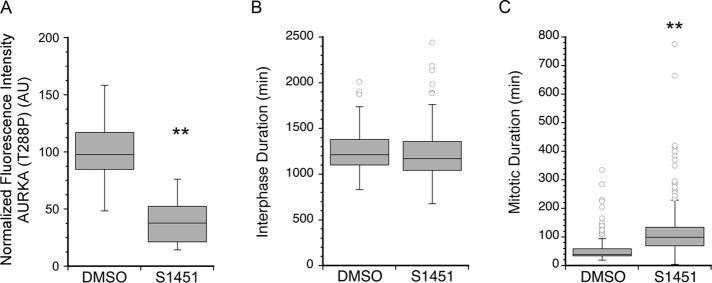
Inhibition of AURKA does not delay mitotic entry. (A) HeLa cells were treated for 16 h with either DMSO as the vehicle control or the AURKA inhibitor S 1451 (300 nM). Cells were fixed and stained with an antibody to AURKA phospho-T288, and the fluorescence intensity of centrosomal AURKA T288P was measured as described in Materials and Methods. AURKA inhibition decreased active AURKA by ∼50%. Values for each cell were normalized to the average value of DMSO-treated cells to allow pooling of independent experiments. Statistical significance was determined using Student's t test. Box plot represents normalized data pooled from two independent experiments with at least seven cells per treatment/experiment. (B and C) HeLa cells treated with DMSO or S 1451 (300 nM) were followed using live-cell imaging. Cell fates were determined from phase-contrast image series as described in Materials and Methods. Box plots are shown, summarizing data from >100 cells and three independent experiments per condition. (B) S 1451 shortened interphase by 0.7 h. (C) S 1451 increased mitotic duration compared with DMSO-treated controls. **, p < 0.01.
To explore whether AURKA inhibition was sufficient to delay progression through interphase, we followed individual cells by phase-contrast microscopy, collecting images at 5-min intervals for up to 72 h. Interphase and mitotic durations were measured as described in Materials and Methods. Treatment of HeLa cells with 300 nM S 1451 did not increase interphase duration but rather shortened interphase by ∼30 min compared with DMSO-treated controls (Figure 2B). Mitotic duration in S 1451–treated cells was significantly increased by an average of 1 h (Figure 2C), as others have reported (Hoar et al., 2007). These chemical inhibitor studies indicate that stathmin depletion cannot delay mitotic entry only by partial inhibition of AURKA.
Stathmin depletion leads to decreased levels of active Plk1 within the nucleus
Plk1 is necessary for G2 checkpoint maintenance and recovery from checkpoint activation through its phosphorylation (activation) of CDC25 (Tsvetkov and Stern, 2005; Macurek et al., 2008). We hypothesized that the cell cycle delay induced by stathmin depletion also involved reduced activation of Plk1. We found that total levels of Plk1 do not change with stathmin depletion as measured by Western blot (Figure 3A) or immunofluorescence (Figure 3B). However, active Plk1 within the nucleus, as measured by quantitative immunofluorescence of phosphorylation on T210 (Lowery et al., 2005), was reduced in stathmin-depleted cells to 30% of control levels (Figure 3, C and D), and confirmed by Western blot (Figure 3E). We observed Plk1 (T210P) predominantly within the nucleus, consistent with a previous report (Lee et al., 2008). We did not consistently observe phosphorylated Plk1 (T210P) on centrosomes, unlike what some have observed (Kishi et al., 2009); therefore we confined our measurements to nucleus-localized, active Plk1. It is likely that centrosome-localized phospho-Plk1 was not detected by the antibody used here because we clearly observed Plk1 on centrosomes with an antibody recognizing the protein independent of its phosphorylation state, as described below.
FIGURE 3:

Active Plk1 on chromatin is decreased in stathmin-depleted cells. HeLa cells were transfected with siGLO control siRNA, or siRNA targeting stathmin, HPV E6, or both mRNAs. Cells were fixed at 48 h posttransfection or whole-cell lysates were prepared for Western blot. (A) Western blot of total Plk1 protein and reprobed with GAPDH as a loading control. Restoring p53 by depletion of E6 (see Figure S2) led to decreased expression of Plk1. Stathmin depletion did not affect Plk1 expression. (B–D) Fixed cells were stained with an antibody against Plk1 or Plk1 phospho-T210 (green in merged images) and propidium iodide to stain DNA (red in merged images). Fluorescence intensities were measured and normalized as described in Materials and Methods. (B) Box plot of Plk1 levels within the nucleus of prophase cells. (C) Representative images of maximum intensity projections of active Plk1 (T210P) in prophase cells. Staining intensity of active Plk1 is reduced in cells depleted of stathmin, E6, or both proteins. (D) Quantitation of active Plk1 (T210P) measured as described in Materials and Methods. Depletion of stathmin, E6, or both proteins reduced the level of active Plk1 on chromatin. For cells depleted of E6 to restore p53, the decreased level of active Plk1 is likely a consequence of reduced Plk1 expression. For graphs in (B and D), data were pooled from three independent experiments with at least seven cells per treatment/experiment. **, p < 0.01. (E) Western blot of Plk1 (T210P) protein reprobed with GAPDH as a loading control. Plk1 (T210P) level is decreased ∼50% by stathmin depletion.
Consistent with previous reports, we confirmed that p53 restoration in HeLa cells reduced total Plk1 protein level (Figure 3A) concomitant with p53’s role in Plk1 transcription inhibition (McKenzie et al., 2010). Restoring p53 by depletion of E6 also reduced the level of active Plk1 on chromatin (T210P level; Figure 3, C and D). The decreased activation of Plk1 in these cells is likely due, at least in part, to reduced Plk1 expression. Taken together, these data indicate that p53 controls Plk1 expression, while stathmin depletion reduces Plk1 activation.
Because stathmin depletion led to a reduction in both active AURKA and Plk1, it is possible that either partial inhibition of Plk1 or the combined partial inhibition of both AURKA and Plk1 was responsible for the delayed mitotic entry observed in stathmin-depleted cells. We next used chemical inhibitors to test these possibilities.
Inhibiting Plk1 with inhibitor BI 2536 is not sufficient to slow mitotic entry
If the G2 delay induced by stathmin depletion was due to reduced Plk1 activation, then we would expect that chemical inhibition of Plk1 would delay mitotic entry. To inhibit Plk1, we used a specific inhibitor, BI 2536, at a concentration based on published IC50 values (Steegmaier et al., 2007) and confirmed in cell proliferation assays (unpublished data). We treated HeLa cells with 0.8 nM BI 2536 and measured cell cycle times. Inhibition of Plk1 with BI 2536 increased interphase duration by ∼2.5 h (Figure 4A) and increased mitotic duration by about 11 min (Figure 4B). Although the increased time in mitosis was modest, the lengthening of mitosis was statistically significant compared with DMSO-treated controls. The Plk1 inhibitor used here blocks the enzyme's ATP-binding pocket but does not prevent phosphorylation at T210 (Scutt et al., 2009), typically used as a marker of enzyme activation. Therefore we could not use T210P as a measure of Plk1 inhibition.
FIGURE 4:

Partial inhibition of both AURKA and Plk1 delays mitotic entry. (A and B) HeLa cells were treated with DMSO as vehicle control or with chemical inhibitor BI 2536 (0.8 nM); this was followed by live-cell imaging. Cell fates were determined from phase-contrast image series as described in Material and Methods. Box plots are shown, summarizing data from > 100 cells and three independent experiments per condition. BI 2536 increased interphase duration by 2.6 h (A) and mitotic duration (B) compared with DMSO-treated cells. *, p < 0.05; **p < 0.01; ***, p < 0.001. (C and D) HeLa cells untransfected or transfected with nontargeting (labeled NT) or siRNA targeting stathmin mRNA and synchronized by a double thymidine block were released into media containing DMSO, BI 2536 (0.8 nM), or a combination of BI 2536 (0.8 nM) and S 1451 (300 nM). Mitotic index was determined from propidium iodide stained cells fixed at 2-h intervals following release. The graphs are representatives from at least two independent experiments with >100 cells per treatment group in each replicate. The combined depletion of stathmin and chemical inhibition of AURKA and Plk1 (D) delayed mitotic entry to the same extent as either treatment alone, supporting a model wherein stathmin depletion acts upstream to regulate AURKA and Plk1 activation.
Although Plk1-inhibited cells took longer to progress through interphase, this delay could reflect a delay in mitotic entry or earlier in the cell cycle because Plk1 was recently reported to function in late G1 by regulating firing of replication origins (Song et al., 2012). To test whether the small interphase delay observed in BI 2536–treated cells was due to delayed mitotic entry, we synchronized cells with a double thymidine block and released them into media containing 0.8 nM BI 2536. Mitotic index was determined at 2-h intervals for 12 h after release. We found that HeLa cells synchronized at the G1/S border and released into Plk1 inhibitor, BI 2536, entered mitosis with normal timing compared with control cells released into DMSO (Figure 4C). These data demonstrate that Plk1 inhibition alone is not sufficient to delay mitotic entry.
Simultaneous inhibition of both AURKA and Plk1 delays mitotic entry
Inhibition of either AURKA or Plk1 alone did not mimic the G2 delay induced by stathmin depletion, and we therefore hypothesized that partial inhibition of both enzymes was necessary to produce a cell cycle delay. We treated asynchronously growing HeLa cells with a combination of 300 nM S 1451 and 0.8 nM BI 2536 to inhibit both AURKA and Plk1 kinases. Cells treated with both inhibitors were delayed significantly in mitosis, and many died by apoptosis (detected by changes in cell morphology), and we were not able to calculate interphase durations in these cells. To avoid possible effects of a prolonged preceding mitosis and loss of cell number due to death, we synchronized cells at the G1/S border using a double thymidine block, released cells into media containing both 300 nM S 1451 and 0.8 nM BI 2536, and determined mitotic index at 2-h intervals for 12 h. The combination of inhibitors delayed the peak of mitotic entry by 4 h, shifting from 8 h to 12 h postrelease compared with DMSO-treated control cells (Figure 4C). This delay is similar to the 4.6-h delay measured in stathmin-depleted cells (Carney et al., 2012).
The results presented above suggested that stathmin depletion acts upstream to regulate mitotic entry via inhibition of both AURKA and Plk1. This model predicts that the mitotic delay will have the same timing for 1) cells treated with inhibitors to AURKA and Plk1, or 2) cells depleted of stathmin and treated with both enzyme inhibitors. Alternatively, a longer cell cycle delay for cells both depleted of stathmin and treated with enzyme inhibitors would indicate that stathmin depletion acts additively with AURKA and Plk1 inhibition, likely through a second pathway controlling mitotic entry. We tested these possibilities in synchronized cells depleted of stathmin or transfected with a nontargeting siRNA, and released from a double thymidine block into medium containing DMSO or a combination of 300 nM S1451 and 0.8 nM BI2536. Mitotic index was then determined at time points for the next 14 h. As shown above, coinhibition of AURKA and Plk1 delayed mitotic entry by 4 h, as did stathmin depletion. This same delay was observed in cells depleted of stathmin and treated with both enzyme inhibitors (Figure 4D). Therefore the depletion of stathmin combined with chemical inhibition of AURKA and Plk1 does not augment the cell cycle delay caused by either treatment alone. These data demonstrate the combined partial inhibition of AURKA and Plk1 is sufficient to delay mitotic entry, indicating that stathmin depletion slows cell cycle progression upstream of these two enzymes.
MTs are required for AURKA centrosomal localization and activation
We previously demonstrated that the interphase delay caused by stathmin depletion required MTs, because nocodazole-induced MT depolymerization alleviated the delay during G2 (Carney et al., 2012). The results described above indicate that stathmin depletion reduced the amount of active AURKA and Plk1 enzymes and that partial inhibition of the two enzymes was sufficient to delay mitotic entry. To probe whether MTs serve as a signal relay between stathmin and these enzymes, we first examined whether MTs were required for activation of AURKA in cells expressing stathmin at endogenous levels. HeLa cells were incubated in 33 μM nocodazole for 3 h prior to fixation, sufficient to depolymerize all MTs (unpublished data). Surprisingly, AURKA centrosomal localization and activation were blocked significantly by MT depolymerization. AURKA was clearly visible in the cytoplasm but did not accumulate on centrosomes in HeLa cells treated with nocodazole (Figure 5A, top). We also did not detect active AURKA, as marked by T288P (Figure 5A, bottom), in nocodazole-treated cells. Because we found that AURKA required MTs to localize at the centrosome and become active, it was not surprising that AURKA activity was not restored by nocodazole treatment of stathmin-depleted cells (unpublished data). These data indicate that AURKA requires an intact MT cytoskeleton for centrosome localization and activation, independent of stathmin level.
FIGURE 5:
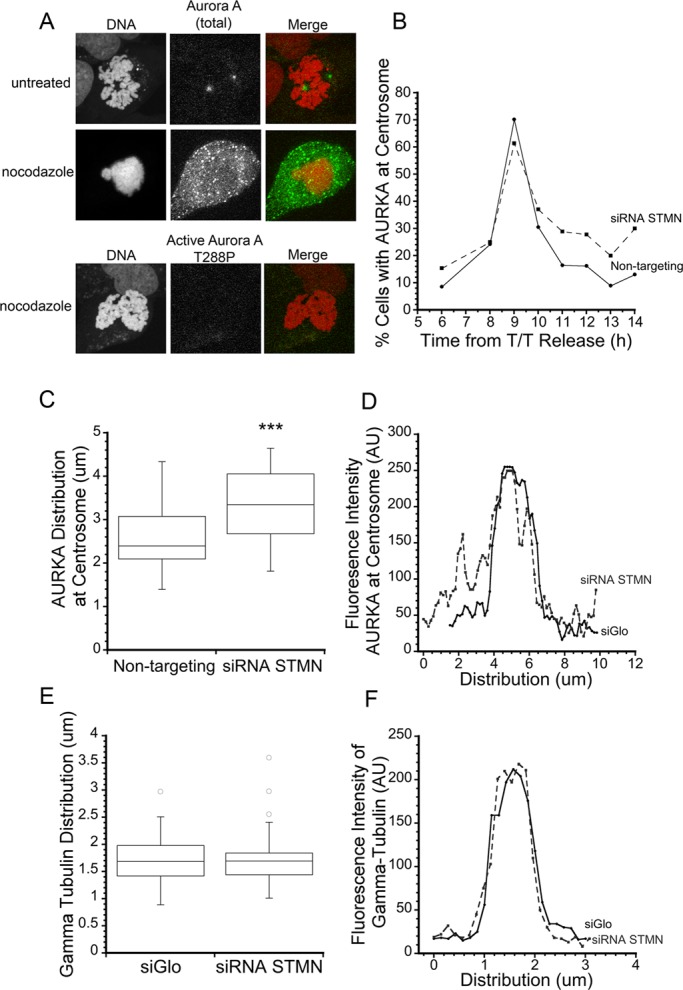
MTs are required for AURKA activation. (A) HeLa cells were treated with either DMSO or 33 μM nocodazole for 3 h and then fixed with paraformaldehyde and stained with antibody against AURKA or phospho-AURKA (T288) (green in merge) and propidium iodide to stain DNA (red in merge). Representative images are shown of AURKA and AURKA (T288P) in prophase cells, demonstrating that MTs are required for AURKA localization and activation at the centrosome. (B) The timing of AURKA recruitment to the centrosome is independent of stathmin depletion. Centrosomes staining positive for AURKA were counted at times after release from a double thymidine block. Graph is a representative from two independent experiments with >100 cells per treatment group in each replicate. (C–F) Stathmin depletion broadens the distribution of AURKA near the centrosome. (C) Box plot of the width of AURKA centrosomal staining, measured as described in Materials and Methods. ***, p < 0.001. (D) Representative line scans of AURKA fluorescence intensity near the centrosome. (E and F) The distribution of γ-tubulin is unaffected by stathmin depletion.
Stathmin depletion increases MT polymer level in a number of cell types (Howell et al., 1999; Holmfeldt et al., 2007; Sellin et al., 2008; see Figure S3), and this increased polymer could interfere with AURKA activation at centrosomes by slowing its translocation to the centrosome in G2 or by interfering with its proper localization to centrosomes. To test the first possibility, we measured the percentage of centrosomes staining positive for AURKA in cells fixed at various times after release from a double thymidine block. The timing of AURKA localization to centrosomes was unaffected by stathmin depletion, indicating that trafficking of AURKA to the centrosome is not altered by stathmin depletion (Figure 5B). In measuring AURKA levels at centrosomes, we consistently observed a wider distribution of AURKA in the centrosome region of stathmin-depleted cells. Quantitative measurements of the width of AURKA or active AURKA (T288P) localization confirmed this impression (Figure 5, C and D). While γ-tubulin distribution was identical in control-transfected and stathmin-depleted cells (Figure 5, E and F), AURKA or the active enzyme was spread over a significantly wider area in stathmin-depleted cells; this localization included puncta that likely represent MT-bound enzyme. In Caenorhabditis elegans, AIR-1 (AURKA homologue) is also localized to both MTs and centrosomes (Toya et al., 2011). Assuming that AURKA is distributed in a spherical shape near the centrosome, our data indicate that the widening of AURKA localization is equivalent to an approximately twofold dilution in local concentration.
Microtubule depolymerization restores Plk1 activation in stathmin-depleted cells
We next asked whether Plk1 activation depended on MTs, beginning with cells expressing stathmin at endogenous levels. Cells were incubated in 33 μM nocodazole for 3 h to depolymerize MTs, and levels of active Plk1 were measured with an antibody specific for Plk1 phosphorylated at T210. Active Plk1 levels were unchanged by MT depolymerization compared with DMSO-treated cells, indicating that MT depolymerization did not contribute significantly to Plk1 activation (Figure 6A).
FIGURE 6:

MT depolymerization restores active Plk1 in stathmin-depleted cells without reversing the delay in Plk1 localization to centrosomes. (A) Approximately 45 h after siRNA transfection, HeLa cells were incubated with DMSO or 33 μM nocodazole for 3 h. Cells were then fixed 3 h later and stained with an antibody against Plk1 phospho-T210 (green in merged images) and propidium iodide to stain DNA (red in merged images). Representative images of maximum intensity projections of Z-stacks of active Plk1 were analyzed for fluorescence intensity. Values for each cell were normalized to the average of control cells, and statistical significance was determined using Student's t test. (B) Box plot represents normalized data pooled from three independent experiments with at least seven cells per treatment/experiment. MT depolymerization restored active Plk1 level to nearly that measured in siGLO control–transfected cells. ***, p < 0.001. (B) The reduction in active Plk1 measured within nuclei of stathmin-depleted cells does not result from a failure to localize to the nucleus. The ratio of fluorescence intensities for active Plk1 in the nucleus/cytoplasm was unchanged by stathmin depletion. (C) Stathmin depletion delays Plk1 localization to the centrosome. Cells were stained with antibodies to Plk1 and γ-tubulin at times after release from a double thymidine block; the percent Plk1-positive centrosomes are shown. (D) MT depolymerization with 33 μM nocodazole did not restore the timing of Plk1 recruitment to the centrosome in stathmin-depleted cells. Cells were fixed 9 and 12 h after release from a double thymidine block. Data shown are the average of two experiments and >100 cells per time point, per experiment.
We previously showed that MT depolymerization abrogates the G2 cell cycle delay caused by stathmin depletion (Carney et al., 2012). Therefore we next asked whether MT depolymerization abrogates the delay by restoring active Plk1. We depleted stathmin in HeLa cells and, ∼45 h after transfection, treated cells with 33 μM nocodazole for 3 h, a concentration and time period previously determined sufficient to depolymerize all MTs and restore the population of cells in G2 to the level measured in siGLO-treated control cells (with or without an intact MT cytoskeleton; Carney et al., 2012). Nocodazole treatment partially rescued activation of Plk1 in stathmin-depleted cells. We found that Plk1 T210P was reduced to 35% of control level after stathmin depletion and that incubation with nocodazole restored activity to 82% of the control value (Figure 6B). It is likely that the restored Plk1 activity was sufficient to abrogate the G2 cell cycle delay, because it was only when both enzymes were inhibited that a delay was observed.
Plk1 recruitment to centrosomes was delayed in stathmin-depleted cells
The data presented above indicate that stathmin depletion reduced active Plk1, at least partially via the MT cytoskeleton. Reduced activation of Plk1, measured within the nucleus, could result from either loss of centrosome localization, where it is activated (Lens et al., 2010), or reduced nuclear import and/or nuclear retention of the active kinase. Nuclear import and/or nuclear retention of active Plk1 do not appear dependent on stathmin level, because the ratio of active Plk1 in the nucleus versus the cytoplasm was the same in control-transfected and stathmin-depleted cells (Figure 6C). In contrast, Plk1 localization to the centrosome was delayed by ∼3 h, measured by fixing cells at various times after release from a double thymidine block and staining with an antibodies to Plk1 and γ-tubulin (Figure 6D). Delayed translocation of Plk1 from the cytoplasm to centrosomes could result from MT-based tethering to retain the enzyme in the cytoplasm. We tested this possibility by MT depolymerization, shown above to restore active Plk1 to near control levels. Surprisingly, MT depolymerization (3-h incubation in 33 μM nocodazole) had no effect on the delayed localization of Plk1 to centrosomes, measured by the percent of centrosomes staining positive for Plk1 at 9 or 12 h postrelease from a double thymidine block (Figure 6E). Taken together with our data showing near complete restoration of active Plk1 in stathmin-depleted cells treated with nocodazole, these data indicate that Plk1 activation can occur in the absence of MTs and without centrosome localization. To date, the mechanism of Plk1 activation at the centrosome is poorly understood (Soung et al., 2009), and alternative activation pathways are not yet known.
Stathmin overexpression decreased Plk1 activation
Activation of AURKA and Plk1 in G2 are partially inhibited by stathmin depletion and/or the resulting increase in MTs. To probe whether either enzyme's activation is dependent on stathmin level over a broad range of concentrations, we next asked whether stathmin overexpression leads to greater or lesser activation of AURKA and Plk1 compared with cells expressing stathmin at endogenous levels. We depleted stathmin in HeLa cells using siRNA targeting stathmin's 5′ untranslated region (UTR) and exogenously expressed stathmin from a plasmid encoding stathmin–green fluorescent protein (GFP) or stathmin–cyan fluorescent protein (CFP; Ringhoff and Cassimeris, 2009). Western blots of HeLa cells transfected with stathmin siRNA and/or stathmin-GFP (or CFP) plasmid showed that the stathmin level is reduced significantly after transfection with the 5′ UTR–targeted siRNA and that stathmin-CFP is expressed at a greater level than endogenous stathmin with or without concomitant knockdown of the endogenous protein (Figure 7, A and B). MT density was proportional to stathmin level, yet modest, because MTs retained their typical interphase organization (Figure S3, A and B).
FIGURE 7:

Stathmin overexpression decreased Plk1 but not AURKA activation level. HeLa cells were transfected with nontargeting control siRNA, or siRNA targeting 5′ UTR of stathmin, and/or plasmid containing stathmin-CFP. Fixed cells were stained with propidium iodide to stain DNA and antibodies against either AURKA phospho-T288 or PLK1 phospho-T210. For stathmin-CFP–transfected cells, only those cells expressing CFP were used for imaging and analysis. (A) Western blot demonstrating stathmin knockdown with the 5′ UTR–targeted sequence. (B) Western blot of stathmin and/or stathmin-CFP expression as noted. (C) Box plot of the relative fluorescence intensity of AURKA (T288P) at the centrosomes of cells entering mitosis. (D) Box plot of Plk1 (T210P) levels within the nucleus of prophase cells. Values for each cell were normalized to the average of control cells, and statistical significance was determined using Student's t test. Box plot represents normalized data pooled from two independent experiments with at least seven cells per treatment for each experiment. *p < 0.05; *** p < 0.001.
Stathmin overexpression did not affect AURKA activation, and expression of stathmin-CFP was sufficient to restore active AURKA to control levels in cells depleted of endogenous stathmin (Figure 7C). Interestingly, Plk1 activation was significantly decreased by stathmin overexpression, as well as by stathmin depletion, indicating that full Plk1 activation requires stathmin expression within certain limits. Stathmin-CFP expression in cells depleted of endogenous stathmin was sufficient to restore Plk1 activation and to restore normal timing for mitotic entry, as measured by the proportion of cells staining positive for several G2 markers (Figure 7D).
Stathmin interacts with AURKA and Plk1 in vitro
Our data indicate that the stathmin expression level acts upstream to regulate AURKA and Plk1 activation at mitotic entry and that this upstream signal pathway is at least partially relayed via MTs. To probe whether stathmin is also a downstream target of these enzymes, as expected if these proteins function in a negative-feedback loop, we examined whether purified, active kinases can phosphorylate stathmin in vitro. Stathmin contains four serine phosphorylation sites and two of these, S16 and S63, contain a consensus sequence for AURKA phosphorylation (Gadea and Ruderman, 2006; Sardon et al., 2010). In vitro, purified stathmin was phosphorylated by AURKA, and this phosphorylation was lost when S16 and S63 were mutated to alanine, indicating that one or both of these sites were phosphorylated by AURKA (Figure 8, A and B).
FIGURE 8:

Stathmin is phosphorylated by AURKA and inhibits Plk1 autophosphorylation in vitro. Bacterially expressed and purified stathmin-FLAG or mutants (also FLAG-tagged) were incubated with active AURKA and [32P]ATP, as described in Materials and Methods. (A) Phosphorimager scan showing phosphorylation of stathmin. AURKA was also capable of autophosphorylation. The lesser AURKA autophosphorylation in the sample containing stathmin was not consistently observed. (B) AURKA phosphorylation was abolished by mutation of S16 and S63 to alanine. Histone H3 (H3) served as a positive control for kinase activity. CB, Coomassie Blue. (C) Stathmin was not phosphorylated by Plk1 in vitro, but stathmin significantly reduced Plk1 autophosphorylation. (D) Stathmin inhibited Plk1 autophosphorylation in a dose-dependent manner. The molar ratio of stathmin to Plk1 is given below each lane. (E) Stathmin also inhibited Plk1 phosphorylation of casein. (F) Plk1 inhibition was not simply due to excess protein, shown here for samples containing 1.5 μM BSA (standard assay conditions) and 7.5 μM BSA. In additional experiments (unpublished data), 3 μM histone H3 also did not inhibit Plk1 activity.
While stathmin is readily phosphorylated by AURKA, it is not a substrate for Plk1 (Figure 8C), consistent with negative results from phosphoproteomic screens to identify all Plk1 targets (Grosstessner-Hain et al., 2011; Santamaria et al., 2011). In the course of our in vitro experiments, we routinely saw that active Plk1 underwent autophosphorylation and incorporated radioactive phosphate but that samples containing stathmin inhibited this autophosphorylation reaction. Inhibition of Plk1 autophosphorylation was dependent on stathmin concentration and was most easily detected at high molar ratios of stathmin/Plk1 (Figure 8D). This Plk1 inhibition was also detected using casein as a substrate for Plk1-dependent phosphorylation (Figure 8E). The ability of stathmin to inhibit Plk1 was not simply a consequence of high protein level in the assay, because neither raising the bovine serum albumin (BSA) concentration (Figure 8F) nor including histone H3 (3 μM; unpublished data) inhibited Plk1 activity. The concentration of Plk1 in HeLa cells is not known but is likely considerably lower than that of stathmin (500–1000 ng/mg total protein has been measured in transformed cells; Brattsand et al., 1993), and the molar ratios tested here are feasible ratios within the cytosol.
DISCUSSION
Stathmin depletion reduces AURKA and Plk1 activation
Cells depleted of stathmin are slower to proliferate (Zhang et al., 2006; Chen et al., 2007; Wang et al., 2007; Carney and Cassimeris, 2010) and are delayed during G2 (Carney and Cassimeris, 2010; Carney et al., 2012). In this study, we explored the mechanism responsible for this delay and found that stathmin depletion leads to less active CDC25 by reducing the activation of both AURKA and Plk1. Chemical inhibition of AURKA and Plk1 separately or in combination demonstrated that both enzymes must be partially inhibited to significantly delay cells during G2.
Previous studies suggested that reduced levels of both stathmin and p53 were required for delayed cell proliferation, which represents a combination of slower cell cycle progression and cell death (Alli et al., 2007; Carney and Cassimeris, 2010). Our current study indicates that increased p53 expression (by restoring p53 in HeLa cells) reduced Plk1 expression (see also McKenzie et al., 2010) but did not reduce AURKA expression or activation. Therefore we conclude that stathmin depletion, and not loss of p53, is responsible for delayed mitotic entry. In contrast, cell death likely requires loss of both stathmin and p53 (Alli et al., 2007; Carney and Cassimeris, 2010).
Chemical inhibitor studies support the idea that simultaneous inhibition of both AURKA and Plk1 delays mitotic entry (Van Horn et al., 2010), while inhibition of a single enzyme does not (Lenart et al., 2007; Van Horn et al., 2010). Either inhibitor is sufficient to block cells in mitosis (Hoar et al., 2007; Steegmaier et al., 2007; Gleixner et al., 2010; Grinshtein et al., 2011; Fu et al., 2012; Yuan et al., 2012). Computer simulations support the idea that partial inhibition of both AURKA and Plk1 synergistically inhibit CDK1 activation (Zou et al., 2011). Given the feedback loops among enzymes driving mitotic entry, combinations of other enzymes regulating cell cycle progression should slow mitotic entry, as predicted in simulations combining Plk1 inhibition and a DNA damage response (Kesseler et al., 2013).
Several other factors also slow entry into mitosis by inhibiting activation of AURKA, Plk1, or both enzymes. Clostridium difficile toxin B inhibits Rho GTPase activity, delays AURKA activation, and prolongs G2, but Plk1 activation was not measured (Ando et al., 2007). Disruption of Golgi fragmentation also delayed cells in G2 and reduced AURKA recruitment to centrosomes (Persico et al., 2010), but whether diminished recruitment causes the delay is unknown (Cervigni et al., 2011). Finally, knockdown of G protein–coupled receptor kinase 5 reduced MT nucleation from the centrosome, delayed mitotic entry, and inhibited both AURKA and Plk1 (Michal et al., 2012).
Stathmin regulates AURKA and Plk1 partially via MTs
While stathmin depletion inhibits activation of AURKA and Plk1, it does not appear to activate known checkpoint pathways that can inhibit mitotic entry, making it unlikely that stathmin depletion acts upstream of these pathways. It is possible that stathmin functions as a downstream relay, communicating inhibitory signals from an activated checkpoint to reduce the activities of AURKA, Plk1, and CDC25. Stathmin depletion decreased AURKA and Plk1 activation via a process partially dependent on MTs (summarized in Figure 9 and discussed below); we previously showed that MT depolymerization by a 3-h incubation in nocodazole was sufficient to remove the G2 cell cycle delay induced by stathmin depletion (Carney et al., 2012).
FIGURE 9:
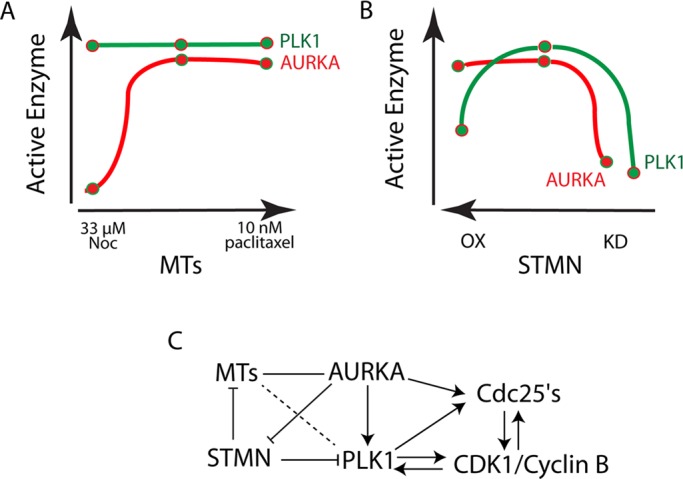
Summary of MT and stathmin regulation of AURKA and Plk1 activation. (A and B) Schematic representations of active AURKA and Plk1 after manipulation of MTs (A) and stathmin level (B). Note that stathmin level is diagrammed from high to low (left to right). A delay in mitotic entry is only observed when both AURKA and Plk1 are inhibited, which is only present in stathmin-depleted cells. (C) Outline of where MTs and stathmin MTs interact with enzymes driving mitotic entry. Arrows represent direct activation; the line connecting MTs and AURKA represents the MT requirement for AURKA localization to centrosomes; and the dashed line between MTs and Plk1 represents the ability of MT depolymerization to restore Plk1 activity after stathmin depletion.
Diagrams in Figure 9 summarize the MT and stathmin-dependent regulation of AURKA and Plk1. MT depolymerization (at endogenous stathmin levels) inhibited AURKA localization to the centrosome and subsequent activation. Plk1 was activated normally under these conditions. Both AURKA and Plk1 were also activated normally in cells treated with 10 nM paclitaxel (unpublished data). This low concentration of paclitaxel is sufficient to block cells at metaphase (Jordan et al., 1993) but allows MTs to remain dynamic (unpublished data) and does not slow mitotic entry (Carney et al., 2012). Stathmin depletion inhibited both AURKA and Plk1 activation, while stathmin overexpression inhibited Plk1 activation, likely through a direct interaction. Thus stathmin depletion is unique in inhibiting both AURKA and Plk1, and it is only under these conditions that we measure a delayed entry into mitosis.
The MT-based regulation of AURKA is demonstrated by the MT-dependent localization and subsequent activation of AURKA at the centrosome. Stathmin depletion also inhibits AURKA activation, but not recruitment to the centrosome. Stathmin depletion increases centrosomal MT nucleation rate, increases MT polymer (Larsson et al., 1997; Ringhoff and Cassimeris, 2009; Carney and Cassimeris, 2010), and increases the density of MTs near the centrosome (unpublished data). The distribution of AURKA across a wider area near the centrosome in stathmin-depleted cells is likely a consequence of excess MTs, given the MT requirement for AURKA localization. This broadening of AURKA distribution is equivalent to protein dilution; reducing local AURKA concentration should reduce dimer formation and limit autophosphorylation reactions, as shown experimentally in vitro (Joukov et al., 2010) and by computational modeling (Zou et al., 2011).
Plk1 activation also depends on both stathmin and MTs. Stathmin depletion inhibited Plk1 activation and delayed Plk1 recruitment to centrosomes. Curiously, MT depolymerization did not prevent Plk1 binding to centrosomes and did not rescue the time delay in Plk1 arrival at the centrosomes of stathmin-depleted cells, yet restored active Plk1 in cells depleted of stathmin. These data indicate that Plk1 recruitment and retention at centrosomes is not solely dependent on MTs. Purified stathmin inhibited Plk1 autophosphorylation in vitro, as did stathmin-CFP overexpression, demonstrating that stathmin can directly regulate Plk1.
The mechanisms underlying Plk1 localization to the centrosome and activation at this site are still poorly understood. In Drosophila, Plk1 is tethered to interphase MTs through its binding to MAP205, a MAP4 homologue (Archambault et al., 2008). Release from MTs/MAP205 then allows Plk1 activation. Stathmin depletion could decrease Plk1 activation via increased tethering to MTs. While this mechanism would explain the ability of MT depolymerization to restore Plk1 activity to near control levels in stathmin-depleted cells, it does not explain the MT-independent delay in Plk1 localization to centrosomes. How Plk1 is recruited or targeted to centrosomes has not been studied thoroughly, but involves anchoring proteins, which are themselves regulated by CDK1 (Soung et al., 2009). MT depolymerization restores Plk1 activity sufficiently to relieve the delay in G2 but does not also restore timely centrosome recruitment, implying that the activation step is more complex than currently thought.
Conclusions
In summary, our results demonstrate a previously unrecognized communication between stathmin and the MT cytoskeleton with the enzymes AURKA, Plk1, and CDC25 that drive CDK1/cyclin B activation for timely entry into mitosis. While stathmin depletion likely regulates AURKA and Plk1 in part via MT polymers, the precise mechanism regulating each enzyme is not yet clear. The MT-dependent signal relay cannot simply reflect a general MT stability, because paclitaxel at nanomolar concentrations stabilizes MTs to some extent (Jordan et al., 1993; unpublished data) but does not slow interphase progression (Carney et al., 2012). Therefore small-molecule inhibitors (Liang et al., 2008) or ribozymes to decrease stathmin expression (Mistry et al., 2005) should target cell processes distinct from those targeted by paclitaxel.
MATERIALS AND METHODS
Cell culture and plasmid transfections
HeLa cells were grown in DMEM (Sigma-Aldrich, St. Louis, MO) supplemented with 10% fetal bovine serum (FBS; Invitrogen, Carlsbad, CA) and 1X antibiotic/antimycotic (Sigma-Aldrich). In some experiments, HeLa cells were synchronized through a double thymidine block by overnight incubation in 5 mM thymidine (in DMEM), an 8-h release in DMEM after five washes in warm phosphate-buffered saline (PBS), and then a 16-h incubation in 5 mM thymidine (in DMEM). Cells were transferred to DMEM following five washes with warm PBS and fixed at time points. For RNA interference (RNAi) in synchronized cells, transfections were performed during the first 8-h release of the double thymidine block.
In some experiments, HeLa cells were transfected with plasmids for expression of stathmin-GFP or stathmin-CFP (Ringhoff and Cassimeris, 2009) using X-tremeGENE HP DNA Transfection Reagent (version 1.0; Roche Diagnostics, Indianapolis, IN) according to the manufacturer's protocol. When cells were transfected with both siRNA and plasmids, plasmid transfection was performed 5 h after siRNA, and samples were fixed 43 h after the second transfection.
Drugs and reagents
Chemical inhibitors to Plk1 (BI 2536; Grinshtein et al., 2011), and AURKA (S 1451; Yuan et al., 2012) were purchased from Selleckchem (Houston, TX). All other reagents were from Sigma-Aldrich, unless noted otherwise.
RNAi and transient transfection
Cells were grown in 35-mm dishes and transfected with siRNAs using GeneSilencer (Genlantis, San Diego, CA) 1–2 d after plating, as described previously (Carney and Cassimeris, 2010). siRNA oligonucleotides (Thermo Scientific/Dharmacon, Pittsburgh, PA) used were SMTN1 (Op18-443), 5′-CGUUUGCGAGAGAAGGAUAdtdt-3′, STMN1, 5′ UTR CCCAGUUGAUUGUGCAGAAUU, and HPV E6 (18E6-385), 5′-CUAACACUGGGUUAUACAAdtdt-3′ (restores p53 by depleting the HPV E6 protein; Koivusalo et al., 2005). These sequences were also used previously (Carney and Cassimeris, 2010). siGLO RISC-Free siRNA (Dharmacon) or siGenome nontargeting siRNA (Thermo Scientific/Dharmacon) were used as control siRNA sequences for these experiments.
Indirect immunofluorescence and confocal microscopy
HeLa cells were grown on glass coverslips and treated as described above. They were either fixed with 4% paraformaldehyde (Electron Microscopy Sciences, Hatfield, PA)/20% glycerol in PEM (100 mM PIPES, 1 mM MgSO4, 2 mM ethylene glycol tetraacetic acid, pH 6.9) for 10 min at room temperature or with methanol supplemented with 1 mM EDTA at −20°C for 10 min. Cells fixed with paraformaldehyde/glycerol were permeabilized with methanol at −20°C for 10 min. Fixed cells were incubated with blocking reagent (10% FBS in PBS) for 30 m at 37°C; this was followed by a 45-min incubation with primary antibody at 37°C. Cells were then washed with PBS and incubated with secondary antibody and 1.5 μM propidium iodide for an additional 45 min at 37°C. Antibodies used included anti–phospho-Aurora A (T288) (1:1000; Cell Signaling Technology (Danvers, MA), anti–phospho-Plk1 (T210) (1:1000; BD PharMingen, San Diego, CA), anti–Aurora A (1:100; Cell Signaling Technology), anti-Plk1 (1:1000; Millipore, Billerica, MA) and goat anti-mouse or anti-rabbit Alexa Fluor 488 or 568 (1:50; Invitrogen, Grand Island, NY). Coverslips were then washed with PBS and mounted on slides with Vectashield (Vector Laboratories, Burlingame, CA). Cells were imaged as described previously (Piehl and Cassimeris, 2003) using a 63×/1.4 numerical aperture Plan-Apo objective on an inverted microscope (Zeiss Axiovert 200M).
For synchronized cells, mitotic index was determined by staining with propidium iodide and counting cells with condensed chromatin as a percent of total cells. At least 10 fields (coverslip positions, >100 cells per time point) were counted for each treatment group. For time-course studies, cells were stained for either AURKA or Plk1 along with γ-tubulin (to label centrosomes) and TO-PRO 3 (to label DNA; Invitrogen). The percent of cells with visible centrosomes positive for AURKA or Plk1 were counted for at least five fields (coverslip positions, >100 cells per time point) for each treatment group.
For quantitative measurement of fluorescence, maximum intensity projections were made from Z-stacks in a Zeiss LSM viewer and exported as TIFF files to MetaMorph (Molecular Devices, Sunnyvale, CA). Fluorescence intensity from standard regions of interest (ROIs) was integrated, and background intensity (average of two standard areas outside ROI) was subtracted. Values were normalized by setting the average control value to 100 for each individual experiment. Normalized data were then pooled for all experiments. For distribution measurements of AURKA and γ-tubulin, intensities along a line scan of the centrosome region of the cell were recorded. Values along the line that were continuously twofold over background were used to determine width of AURKA and γ-tubulin distribution.
Western blotting
Soluble cell extracts were prepared as described previously (Carney and Cassimeris, 2010), and protein concentrations were measured by Bradford assay. Lysates were diluted in PAGE sample buffer; 10 μg total protein per lane was typically loaded and resolved in 10% polyacrylamide gels and transferred to Immobilon membranes (Millipore, Billerica, MA). Membranes were blocked with 5% nonfat milk or 5% BSA (for phospho-specific antibodies) in Tris-buffered saline with 0.1% Tween and then probed with primary antibodies: anti–Aurora A (1:1000; Cell Signaling), anti-Plk1 (1:1000; Millipore), anti–Plk1 T210P (1:1000; BD PharMingen), or anti-stathmin (1:2000; Sigma-Aldrich) followed by secondary antibodies, anti-mouse (1:2000; Abcam, Cambridge, MA) or anti-rabbit (1:10,000; BD Biosciences, Franklin Lakes, NJ) horseradish peroxidase–linked immunoglobulin G. Immunoreactive bands were developed using enhanced chemiluminscence (GE Amersham). Membranes were reprobed with anti–α-tubulin (1:1000; Sigma-Aldrich) or GAPDH (1:1000; Abcam) as a loading control.
Live-cell imaging
For following cell fates over several days, HeLa cells were plated on MatTek dishes (Ashland, MA) and imaged using a Nikon Biostation IM, as described previously (Carney et al., 2012). Cells were imaged with phase-contrast optics using a 20× objective, and images were collected at 5-min intervals for 24–72 h. Cell fates were tracked from image series. Mitotic entry was marked either by the first image showing loss of the nuclear envelope or by significant cell rounding. Mitotic exit was marked as the first image showing formation of a cleavage furrow, indicating the start of cytokinesis.
In vitro protein expression and kinase assays
Sequences encoding stathmin-FLAG, stathmin-S16,63A-FLAG, stathmin-S25,38A-FLAG, stathmin-∆5-25-FLAG, and stathmin-∆100-147-FLAG (each including Nco1 and BamH1 restriction sites) were generated by total gene synthesis and inserted into the Nco1 and BamH1 sites of the pET-28a plasmid (gene synthesis, cloning, and sequence verifications performed by Genewiz, South Plainfield, NJ). Plasmids were transfected into Escherichia coli, and protein expression was induced with 1 mM isopropyl β-d-1-thiogalactopyranoside for 1–3 h. Cells were pelleted and resuspended in Tris-buffered saline, 0.1% NP-40, protease inhibitor cocktail (Thermo Scientific) and PMSF. E. coli was lysed by sonication, clarified, and boiled for 10 min, and the final clarified supernatants were frozen at −20°C. Stathmin is heat stable, and the final supernatant fraction was > 90% stathmin based on Coomassie Blue–stained SDS gels and confirmed by immunoblots probed with anti-stathmin (a combination of rabbit antibodies recognizing the C-terminus [Sigma-Aldrich] and a region around amino acid 38 [Cell Signaling] to detect all mutants) and anti-FLAG (M2, Sigma-Aldrich).
For in vitro kinase assays, purified stathmin-FLAG or mutants (7.6 μM when used as an enzyme substrate or 0.1–3 μM for Plk1 inhibition experiments) in kinase buffer (20 mM HEPES, 10 mM MgCl2, 10 mM KCl, 1 μM dithiothreitol, 100 μg/ml BSA, 0.01% NP-40) were incubated with 5 μM ATP, 5 μCi [32P]ATP (6000 Ci/mmol; Perkin Elmer-Cetus, Waltham, MA), and either active AURKA (0.6 nM; Millipore, Dundee, UK) or Prospec-Tany TechnoGene (Ness Ziona, Israel) or active Plk1 (70–140 nM; Signal Chem, British Columbia, Canada) for 30 min at 30°C. In additional experiments, dephosphorylated casein (Sigma-Aldrich) was used as a Plk1 substrate (Steegmaier et al., 2007). The final concentration of casein in these reactions was 3 μM. The BSA concentration in the standard reaction mixture was 1.5 μM; where noted, the BSA concentration was raised to 7.5 μM to test whether excess protein inhibited Plk1 activity. Reactions were stopped by adding 5X SDS sample buffer and heating to 70°C for 10 min. Proteins were separated on 10% PAGE gels and stained with Coomassie Blue; wet gels were exposed to phosphorimager screens for 1–5 h and imaged with a Storm 840 PhosphorImager (Amersham Biosciences).
Data analysis
Statistical analysis of fluorescence intensity and cell cycle durations was performed using unpaired t tests with GraphPad Software (www.graphpad.com/quickcalcs/ttest1.cfm).
Supplementary Material
Acknowledgments
The authors thank Bob Skibbens, Linda Lowe-Krentz, and Frank Luca for enthusiastic discussions and valuable comments and Dan Ciccone for establishing dose-response curves for the kinase inhibitors used here. We are indebted to Bruce Carney for providing data shown in Figure S3. This work supported by a grant from the National Institutes of Health (L.C.) and a New Directions Fellowship to L.C. from Lehigh University's College of Arts and Sciences.
Abbreviations used:
- AURKA
Aurora kinase A
- MT
microtubule
Footnotes
This article was published online ahead of print in MBoC in Press (http://www.molbiolcell.org/cgi/doi/10.1091/mbc.E13-02-0108) on October 23, 2013.
REFERENCES
- Aliagas-Martin, et al. A class of 2,4-bisanilinopyrimidine Aurora A inhibitors with unusually high selectivity against Aurora B. J Med Chem. 2009;52:3300–3307. doi: 10.1021/jm9000314. [DOI] [PubMed] [Google Scholar]
- Alli E, Bash-Babula J, Yang JM, Hait WN. Effect of stathmin on the sensitivity to antimicrotubule drugs in human breast cancer. Cancer Res. 2002;62:6864–6869. [PubMed] [Google Scholar]
- Alli E, Yang JM, Ford JM, Hait WN. Reversal of stathmin-mediated resistance to paclitaxel and vinblastine in human breast carcinoma cells. Mol Pharmacol. 2007;71:1233–1240. doi: 10.1124/mol.106.029702. [DOI] [PubMed] [Google Scholar]
- Ando Y, Yasuda S, Oceguera-Yanez F, Narumiya S. Inactivation of Rho GTPases with Clostridium difficile toxin B impairs centrosomal activation of Aurora-A in G2/M transition of HeLa cells. Mol Biol Cell. 2007;18:3752–3763. doi: 10.1091/mbc.E07-03-0281. [DOI] [PMC free article] [PubMed] [Google Scholar]
- Archambault V, D'Avino PP, Deery MJ, Lilley KS, Glover DM. Sequestration of Polo kinase to microtubules by phosphopriming-independent binding to Map205 is relieved by phosphorylation at a CDK site in mitosis. Genes Dev. 2008;22:2707–2720. doi: 10.1101/gad.486808. [DOI] [PMC free article] [PubMed] [Google Scholar]
- Belletti B, Baldassarre G. Stathmin: a protein with many tasks. New biomarker and potential target in cancer. Expert Opinion Ther Targets. 2011;15:1249–1266. doi: 10.1517/14728222.2011.620951. [DOI] [PubMed] [Google Scholar]
- Brattsand G, Roos G, Marklund U, Ueda H, Landberg G, Nanberg E, Sideras P, Gullberg M. Quantitative analysis of the expression and regulation of an activation-regulated phosphoprotein (oncoprotein 18) in normal and neoplastic cells. Leukemia. 1993;7:569–579. [PubMed] [Google Scholar]
- Carney BK, Caruso Silva V, Cassimeris L. The microtubule cytoskeleton is required for a G2 cell cycle delay in cancer cells lacking stathmin and p53. Cytoskeleton (Hoboken) 2012;69:278–289. doi: 10.1002/cm.21024. [DOI] [PMC free article] [PubMed] [Google Scholar]
- Carney BK, Cassimeris L. Stathmin/oncoprotein 18, a microtubule regulatory protein, is required for survival of both normal and cancer cell lines lacking the tumor suppressor, p53. Cancer Biol Ther. 2010;9:699–709. doi: 10.4161/cbt.9.9.11430. [DOI] [PubMed] [Google Scholar]
- Cervigni RI, Barretta ML, Persico A, Corda D, Colanzi A. The role of Aurora-A kinase in the Golgi-dependent control of mitotic entry. Bioarchitecture. 2011;1:61–65. doi: 10.4161/bioa.1.2.15329. [DOI] [PMC free article] [PubMed] [Google Scholar]
- Chen Y, et al. Lentivirus-mediated RNA interference targeting enhancer of zeste homolog 2 inhibits hepatocellular carcinoma growth through down-regulation of stathmin. Hepatology. 2007;46:200–208. doi: 10.1002/hep.21668. [DOI] [PubMed] [Google Scholar]
- Dutertre, et al. Phosphorylation of CDC25B by Aurora-A at the centrosome contributes to the G2-M transition. J Cell Sci. 2004;117:2523–2531. doi: 10.1242/jcs.01108. [DOI] [PubMed] [Google Scholar]
- Efimov A, Kaverina I. Significance of microtubule catastrophes at focal adhesion sites. Cell Adh Migr. 2009;3:285–287. doi: 10.4161/cam.3.3.8858. [DOI] [PMC free article] [PubMed] [Google Scholar]
- Eyers PA, Erikson E, Chen LG, Maller JL. A novel mechanism for activation of the protein kinase Aurora A. Curr Biol. 2003;13:691–697. doi: 10.1016/s0960-9822(03)00166-0. [DOI] [PubMed] [Google Scholar]
- Ezratty EJ, Partridge MA, Gundersen GG. Microtubule-induced focal adhesion disassembly is mediated by dynamin and focal adhesion kinase. Nat Cell Biol. 2005;7:581–590. doi: 10.1038/ncb1262. [DOI] [PubMed] [Google Scholar]
- Fu S, et al. Aurora kinase inhibitor VE 465 synergistically enhances cytotoxicity of carboplatin in ovarian cancer cells through induction of apoptosis and downregulation of histone 3. Cancer Biol Ther. 2012;13:1034–1041. doi: 10.4161/cbt.21045. [DOI] [PMC free article] [PubMed] [Google Scholar]
- Gadea BB, Ruderman JV. Aurora B is required for mitotic chromatin-induced phosphorylation of Op18/stathmin. Proc Natl Acad Sci USA. 2006;103:4493–4498. doi: 10.1073/pnas.0600702103. [DOI] [PMC free article] [PubMed] [Google Scholar]
- Gleixner KV, et al. Polo-like kinase 1 (Plk1) as a novel drug target in chronic myeloid leukemia: overriding imatinib resistance with the Plk1 inhibitor BI 2536. Cancer Res. 2010;70:1513–1523. doi: 10.1158/0008-5472.CAN-09-2181. [DOI] [PubMed] [Google Scholar]
- Grinshtein N, Datti A, Fujitani M, Uehling D, Prakesch M, Isaac M, Irwin MS, Wrana JL, Al-Awar R, Kaplan DR. Small molecule kinase inhibitor screen identifies polo-like kinase 1 as a target for neuroblastoma tumor-initiating cells. Cancer Res. 2011;71:1385–1395. doi: 10.1158/0008-5472.CAN-10-2484. [DOI] [PubMed] [Google Scholar]
- Grosstessner-Hain, et al. Quantitative phospho-proteomics to investigate the polo-like kinase 1-dependent phospho-proteome. Mol Cell Proteom. 2011;10:M111.008540. doi: 10.1074/mcp.M111.008540. [DOI] [PMC free article] [PubMed] [Google Scholar]
- Gundersen GG, Cook TA. Microtubules and signal transduction. Curr Opin Cell Biol. 1999;11:81–94. doi: 10.1016/s0955-0674(99)80010-6. [DOI] [PubMed] [Google Scholar]
- Hoar K, Chakravarty A, Rabino C, Wysong D, Bowman D, Roy N, Ecsedy JA. MLN8054, a small-molecule inhibitor of Aurora A, causes spindle pole and chromosome congression defects leading to aneuploidy. Mol Cell Biol. 2007;27:4513–4525. doi: 10.1128/MCB.02364-06. [DOI] [PMC free article] [PubMed] [Google Scholar]
- Holmfeldt P, Sellin ME, Gullberg M. Predominant regulators of tubulin monomer-polymer partitioning and their implication for cell polarization. Cell Mol Life Sci. 2009;66:3263–3276. doi: 10.1007/s00018-009-0084-5. [DOI] [PMC free article] [PubMed] [Google Scholar]
- Holmfeldt P, Stenmark S, Gullberg M. Interphase-specific phosphorylation-mediated regulation of tubulin dimer partitioning in human cells. Mol Biol Cell. 2007;18:1909–1917. doi: 10.1091/mbc.E07-01-0019. [DOI] [PMC free article] [PubMed] [Google Scholar]
- Howell B, Larsson N, Gullberg M, Cassimeris L. Dissociation of the tubulin-sequestering and microtubule catastrophe-promoting activities of oncoprotein 18/stathmin. Mol Biol Cell. 1999;10:105–118. doi: 10.1091/mbc.10.1.105. [DOI] [PMC free article] [PubMed] [Google Scholar]
- Izumi T, Maller JL. Elimination of cdc2 phosphorylation sites in the cdc25 phosphatase blocks initiation of M-phase. Mol Biol Cell. 1993;4:1337–1350. doi: 10.1091/mbc.4.12.1337. [DOI] [PMC free article] [PubMed] [Google Scholar]
- Johnsen JI, Aurelio ON, Kwaja Z, Jorgensen GE, Pellegata NS, Plattner R, Stanbridge EJ, Cajot JF. p53-mediated negative regulation of stathmin/Op18 expression is associated with G(2)/M cell-cycle arrest. Int J Cancer. 2000;88:685–691. doi: 10.1002/1097-0215(20001201)88:5<685::aid-ijc1>3.0.co;2-z. [DOI] [PubMed] [Google Scholar]
- Jordan MA, Kamath K. How do microtubule-targeted drugs work? An overview. Curr Cancer Drug Targets. 2007;7:730–742. doi: 10.2174/156800907783220417. [DOI] [PubMed] [Google Scholar]
- Jordan MA, Toso RJ, Thrower D, Wilson L. Mechanism of mitotic block and inhibition of cell proliferation by Taxol at low concentrations. Proc Natl Acad Sci USA. 1993;90:9552–9556. doi: 10.1073/pnas.90.20.9552. [DOI] [PMC free article] [PubMed] [Google Scholar]
- Jordan MA, Wilson L. Microtubules as a target for anticancer drugs. Nature Rev Cancer. 2004;4:253–265. doi: 10.1038/nrc1317. [DOI] [PubMed] [Google Scholar]
- Joukov V, De Nicolo A, Rodriguez A, Walter JC, Livingston DM. Centrosomal protein of 192 kDa (Cep192) promotes centrosome-driven spindle assembly by engaging in organelle-specific Aurora A activation. Proc Natl Acad Sci USA. 2010;107:21022–21027. doi: 10.1073/pnas.1014664107. [DOI] [PMC free article] [PubMed] [Google Scholar]
- Kang YH, et al. Self-regulated Plk1 recruitment to kinetochores by the Plk1-PBIP1 interaction is critical for proper chromosome segregation. Mol Cell. 2006;24:409–422. doi: 10.1016/j.molcel.2006.10.016. [DOI] [PubMed] [Google Scholar]
- Katayama H, Sasai K, Kloc M, Brinkley BR, Sen S. Aurora kinase-A regulates kinetochore/chromatin associated microtubule assembly in human cells. Cell Cycle. 2008;7:2691–2704. doi: 10.4161/cc.7.17.6460. [DOI] [PubMed] [Google Scholar]
- Kesseler KJ, Blinov ML, Elston TC, Kaufmann WK, Simpson DA. A predictive mathematical model of the DNA damage G2 checkpoint. J Theoret Biol. 2013;320:159–169. doi: 10.1016/j.jtbi.2012.12.011. [DOI] [PMC free article] [PubMed] [Google Scholar]
- Kishi K, van Vugt MA, Okamoto K, Hayashi Y, Yaffe MB. Functional dynamics of Polo-like kinase 1 at the centrosome. Mol Cell Biol. 2009;29:3134–3150. doi: 10.1128/MCB.01663-08. [DOI] [PMC free article] [PubMed] [Google Scholar]
- Koivusalo R, Krausz E, Helenius H, Hietanen S. Chemotherapy compounds in cervical cancer cells primed by reconstitution of p53 function after short interfering RNA-mediated degradation of human papillomavirus 18 E6 mRNA: opposite effect of siRNA in combination with different drugs. Mol Pharmacol. 2005;68:372–382. doi: 10.1124/mol.105.011189. [DOI] [PubMed] [Google Scholar]
- Kramer A, Lukas J, Bartek J. Checking out the centrosome. Cell Cycle. 2004;3:1390–1393. doi: 10.4161/cc.3.11.1252. [DOI] [PubMed] [Google Scholar]
- Larsson N, Marklund U, Gradin HM, Brattsand G, Gullberg M. Control of microtubule dynamics by oncoprotein 18: dissection of the regulatory role of multisite phosphorylation during mitosis. Mol Cell Biol. 1997;17:5530–5539. doi: 10.1128/mcb.17.9.5530. [DOI] [PMC free article] [PubMed] [Google Scholar]
- Lee KS, Oh DY, Kang YH, Park JE. Self-regulated mechanism of Plk1 localization to kinetochores: lessons from the Plk1-PBIP1 interaction. Cell Division. 2008;3:4. doi: 10.1186/1747-1028-3-4. [DOI] [PMC free article] [PubMed] [Google Scholar]
- Leinung M, Cuny C, Diensthuber M, Stover T, Wagenblast J. Small molecules in combination with conventional chemotherapeutic drugs: light at the end of the tunnel. Oncol Lett. 2012;4:1043–1046. doi: 10.3892/ol.2012.883. [DOI] [PMC free article] [PubMed] [Google Scholar]
- Lenart P, Petronczki M, Steegmaier M, Di Fiore B, Lipp JJ, Hoffmann M, Rettig WJ, Kraut N, Peters JM. The small-molecule inhibitor BI 2536 reveals novel insights into mitotic roles of polo-like kinase 1. Curr Biol. 2007;17:304–315. doi: 10.1016/j.cub.2006.12.046. [DOI] [PubMed] [Google Scholar]
- Lens SM, Voest EE, Medema RH. Shared and separate functions of polo-like kinases and aurora kinases in cancer. Nat Rev Cancer. 2010;10:825–841. doi: 10.1038/nrc2964. [DOI] [PubMed] [Google Scholar]
- Liang XJ, Choi Y, Sackett DL, Park JK. Nitrosoureas inhibit the stathmin-mediated migration and invasion of malignant glioma cells. Cancer Res. 2008;68:5267–5272. doi: 10.1158/0008-5472.CAN-07-6482. [DOI] [PMC free article] [PubMed] [Google Scholar]
- Lindqvist A, Rodriguez-Bravo V, Medema RH. The decision to enter mitosis: feedback and redundancy in the mitotic entry network. J Cell Biol. 2009;185:193–202. doi: 10.1083/jcb.200812045. [DOI] [PMC free article] [PubMed] [Google Scholar]
- Lowery DM, Lim D, Yaffe MB. Structure and function of Polo-like kinases. Oncogene. 2005;24:248–259. doi: 10.1038/sj.onc.1208280. [DOI] [PubMed] [Google Scholar]
- Macurek L, Lindqvist A, Lim D, Lampson MA, Klompmaker R, Freire R, Clouin C, Taylor SS, Yaffe MB, Medema RH. Polo-like kinase-1 is activated by aurora A to promote checkpoint recovery. Nature. 2008;455:119–123. doi: 10.1038/nature07185. [DOI] [PubMed] [Google Scholar]
- McKenzie L, et al. p53-dependent repression of polo-like kinase-1 (PLK1) Cell Cycle. 2010;9:4200–4212. doi: 10.4161/cc.9.20.13532. [DOI] [PMC free article] [PubMed] [Google Scholar]
- Michal AM, So CH, Beeharry N, Shankar H, Mashayekhi R, Yen TJ, Benovic JL. G protein-coupled receptor kinase 5 is localized to centrosomes and regulates cell cycle progression. J Biol Chem. 2012;287:6928–6940. doi: 10.1074/jbc.M111.298034. [DOI] [PMC free article] [PubMed] [Google Scholar]
- Mistry SJ, Bank A, Atweh GF. Targeting stathmin in prostate cancer. Mol Cancer Ther. 2005;4:1821–1829. doi: 10.1158/1535-7163.MCT-05-0215. [DOI] [PubMed] [Google Scholar]
- Mitra M, Kandalam M, Sundaram CS, Verma RS, Maheswari UK, Swaminathan S, Krishnakumar S. Reversal of stathmin-mediated microtubule destabilization sensitizes retinoblastoma cells to a low dose of antimicrotubule agents: a novel synergistic therapeutic intervention. Invest Ophthalmol Vis Sci. 2011;52:5441–5448. doi: 10.1167/iovs.10-6973. [DOI] [PubMed] [Google Scholar]
- Molli PR, et al. Arpc1b, a centrosomal protein, is both an activator and substrate of Aurora A. J Cell Biol. 2010;190:101–114. doi: 10.1083/jcb.200908050. [DOI] [PMC free article] [PubMed] [Google Scholar]
- Ohashi S, Sakashita G, Ban R, Nagasawa M, Matsuzaki H, Murata Y, Taniguchi H, Shima H, Furukawa K, Urano T. Phospho-regulation of human protein kinase Aurora-A: analysis using anti-phospho-Thr288 monoclonal antibodies. Oncogene. 2006;25:7691–7702. doi: 10.1038/sj.onc.1209754. [DOI] [PubMed] [Google Scholar]
- Perry JA, Kornbluth S. Cdc25 and Wee1: analogous opposites. Cell Division. 2007;2:12. doi: 10.1186/1747-1028-2-12. [DOI] [PMC free article] [PubMed] [Google Scholar]
- Persico A, Cervigni RI, Barretta ML, Corda D, Colanzi A. Golgi partitioning controls mitotic entry through Aurora-A kinase. Mol Biol Cell. 2010;21:3708–3721. doi: 10.1091/mbc.E10-03-0243. [DOI] [PMC free article] [PubMed] [Google Scholar]
- Piehl M, Cassimeris L. Organization and dynamics of growing microtubule plus ends during early mitosis. Mol Biol Cell. 2003;14:916–925. doi: 10.1091/mbc.E02-09-0607. [DOI] [PMC free article] [PubMed] [Google Scholar]
- Polager S, Ginsberg D. E2F mediates sustained G2 arrest and down-regulation of stathmin and AIM-1 expression in response to genotoxic stress. J Biol Chem. 2003;278:1443–1449. doi: 10.1074/jbc.M210327200. [DOI] [PubMed] [Google Scholar]
- Reinhardt HC, et al. DNA damage activates a spatially distinct late cytoplasmic cell-cycle checkpoint network controlled by MK2-mediated RNA stabilization. Mol Cell. 2010;40:34–49. doi: 10.1016/j.molcel.2010.09.018. [DOI] [PMC free article] [PubMed] [Google Scholar]
- Rieder CL. Mitosis in vertebrates: the G2/M and M/A transitions and their associated checkpoints. Chromosome Res. 2011;19:291–306. doi: 10.1007/s10577-010-9178-z. [DOI] [PubMed] [Google Scholar]
- Rieder CL, Cole R. Microtubule disassembly delays the G2-M transition in vertebrates. Curr Biol. 2000;10:1067–1070. doi: 10.1016/s0960-9822(00)00678-3. [DOI] [PubMed] [Google Scholar]
- Ringhoff DN, Cassimeris L. Stathmin regulates centrosomal nucleation of microtubules and tubulin dimer/polymer partitioning. Mol Biol Cell. 2009;20:3451–3458. doi: 10.1091/mbc.E09-02-0140. [DOI] [PMC free article] [PubMed] [Google Scholar]
- Santamaria A, Wang B, Elowe S, Malik R, Zhang F, Bauer M, Schmidt A, Sillje HHW, Korner R, Nigg EA. The Plk1-dependent phosphoproteome of the early mitotic spindle. Mol Cell Proteomics. 2011;10:M110.004457. doi: 10.1074/mcp.M110.004457. [DOI] [PMC free article] [PubMed] [Google Scholar]
- Sardon T, Pache RA, Stein A, Molina H, Vernos I, Aloy P. Uncovering new substrates for Aurora A kinase. EMBO Rep. 2010;11:977–984. doi: 10.1038/embor.2010.171. [DOI] [PMC free article] [PubMed] [Google Scholar]
- Scheffner M, Werness BA, Huibregtse JM, Levine AJ, Howley PM. The E6 oncoprotein encoded by human papillomavirus types 16 and 18 promotes the degradation of p53. Cell. 1990;63:1129–1136. doi: 10.1016/0092-8674(90)90409-8. [DOI] [PubMed] [Google Scholar]
- Scutt PJ, Chu ML, Sloane DA, Cherry M, Bignell CR, Williams DH, Eyers PA. Discovery and exploitation of inhibitor-resistant Aurora and Polo kinase mutants for the analysis of mitotic networks. J Biol Chem. 2009;284:15880–15893. doi: 10.1074/jbc.M109.005694. [DOI] [PMC free article] [PubMed] [Google Scholar]
- Seki A, Coppinger JA, Jang CY, Yates JR, Fang G. Bora and the kinase Aurora A cooperatively activate the kinase Plk1 and control mitotic entry. Science. 2008;320:1655–1658. doi: 10.1126/science.1157425. [DOI] [PMC free article] [PubMed] [Google Scholar]
- Sellin ME, Holmfeldt P, Stenmark S, Gullberg M. Global regulation of the interphase microtubule system by abundantly expressed Op18/stathmin. Mol Biol Cell. 2008;19:2897–2906. doi: 10.1091/mbc.E08-01-0058. [DOI] [PMC free article] [PubMed] [Google Scholar]
- Song B, Liu XS, Liu X. Polo-like kinase 1 (Plk1): an unexpected player in DNA replication. Cell Div. 2012;7:3. doi: 10.1186/1747-1028-7-3. [DOI] [PMC free article] [PubMed] [Google Scholar]
- Soung NK, Park JE, Yu LR, Lee KH, Lee JM, Bang JK, Veenstra TD, Rhee K, Lee KS. Plk1-dependent and -independent roles of an ODF2 splice variant, hCenexin1, at the centrosome of somatic cells. Dev Cell. 2009;16:539–550. doi: 10.1016/j.devcel.2009.02.004. [DOI] [PMC free article] [PubMed] [Google Scholar]
- Steegmaier M, et al. BI 2536, a potent and selective inhibitor of polo-like kinase 1, inhibits tumor growth in vivo. Curr Biol. 2007;17:316–322. doi: 10.1016/j.cub.2006.12.037. [DOI] [PubMed] [Google Scholar]
- Toya M, Terasawa M, Nagata K, Iida Y, Sugimoto A. A kinase-independent role for Aurora A in the assembly of mitotic spindle microtubules in Caenorhabditis elegans embryos. Nat Cell Biol. 2011;13:708–714. doi: 10.1038/ncb2242. [DOI] [PubMed] [Google Scholar]
- Trunnell NB, Poon AC, Kim SY, Ferrell JE., Jr. Ultrasensitivity in the regulation of Cdc25C by Cdk1. Mol Cell. 2011;41:263–274. doi: 10.1016/j.molcel.2011.01.012. [DOI] [PMC free article] [PubMed] [Google Scholar]
- Tsvetkov L, Stern DF. Phosphorylation of Plk1 at S137 and T210 is inhibited in response to DNA damage. Cell Cycle. 2005;4:166–171. doi: 10.4161/cc.4.1.1348. [DOI] [PubMed] [Google Scholar]
- Van Horn RD, et al. Cdk1 activity is required for mitotic activation of Aurora A during G2/M transition of human cells. J Biol Chem. 2010;285:21849–21857. doi: 10.1074/jbc.M110.141010. [DOI] [PMC free article] [PubMed] [Google Scholar]
- Wang R, Dong K, Lin F, Wang X, Gao P, Wei SH, Cheng SY, Zhang HZ. Inhibiting proliferation and enhancing chemosensitivity to taxanes in osteosarcoma cells by RNA interference-mediated downregulation of stathmin expression. Mol Med. 2007;13:567–575. doi: 10.2119/2007-00046.Wang. [DOI] [PMC free article] [PubMed] [Google Scholar]
- Xu D, Dai W. The function of mammalian Polo-like kinase 1 in microtubule nucleation. Proc Natl Acad Sci USA. 2011;108:11301–11302. doi: 10.1073/pnas.1107723108. [DOI] [PMC free article] [PubMed] [Google Scholar]
- Yuan H, Wang Z, Zhang H, Roth M, Bhatia R, Chen WY. Overcoming CML acquired resistance by specific inhibition of Aurora A kinase in the KCL-22 cell model. Carcinogenesis. 2012;33:285–293. doi: 10.1093/carcin/bgr278. [DOI] [PMC free article] [PubMed] [Google Scholar]
- Zhang HZ, Wang Y, Gao P, Lin F, Liu L, Yu B, Ren JH, Zhao H, Wang R. Silencing stathmin gene expression by survivin promoter-driven siRNA vector to reverse malignant phenotype of tumor cells. Cancer Biol Ther. 2006;5:1457–1461. doi: 10.4161/cbt.5.11.3272. [DOI] [PubMed] [Google Scholar]
- Zou J, Luo SD, Wei YQ, Yang SY. Integrated computational model of cell cycle and checkpoint reveals different essential roles of Aurora-A and Plk1 in mitotic entry. Mol Biosyst. 2011;7:169–179. doi: 10.1039/c0mb00004c. [DOI] [PubMed] [Google Scholar]
Associated Data
This section collects any data citations, data availability statements, or supplementary materials included in this article.