

Background: EBF1 is critical for early adipogenesis, yet its targets/function in mature fat cells are unknown.
Results: EBF1 binds to and/or regulates many core genes in metabolic and inflammatory signaling pathways, and loss of EBF1 results in impaired insulin and inflammatory signaling.
Conclusion: EBF1 regulates signaling pathways in adipocytes.
Significance: We have defined a major regulator of metabolism and signal transduction in adipose cells.
Keywords: Adipocyte, Chromatin Immunoprecipitation (ChiP), Inflammation, Signal Transduction, Transcription/Developmental Factors, B Lymphocyte, EBF1, Insulin Signaling
Abstract
EBF1 plays a crucial role in early adipogenesis; however, despite high expression in mature adipocytes, its function in these cells is currently unknown. To identify direct and indirect EBF1 targets in fat, we undertook a combination of transcriptional profiling of EBF1-deficient adipocytes and genome-wide EBF1 location analysis. Our results indicate that many components of metabolic and inflammatory pathways are positively and directly regulated by EBF1, including PI3K/AKT, MAPK, and STAT1 signaling. Accordingly, we observed significant reduction of multiple signaling events in EBF1 knockdown cells as well as a reduction in insulin-stimulated glucose uptake and lipogenesis. Inflammatory signaling, gene expression, and secretion of inflammatory cytokines were also significantly affected by loss of EBF1 in adipocytes, although ChIP-sequencing results suggest that these actions are indirect. We also found that EBF1 occupies some 35,000 sites in adipocytes, most of which occur in enhancers. Significantly, comparison with three other published EBF1 ChIP-sequencing data sets in B-cells reveals both gene- and cell type-specific patterns of EBF1 binding. These results advance our understanding of the transcriptional mechanisms regulating signaling pathways in mature fat cells and indicate that EBF1 functions as a key integrator of signal transduction, inflammation, and metabolism.
Introduction
Adipocytes send and receive signals to and from other cell types to regulate appetite, metabolic fuel selection, and other homeostatic processes. Overnutrition causes adipocyte hypertrophy and inflammation, which, through incompletely understood mechanisms, leads to the secretion of a variety of proinflammatory cytokines from adipose tissue, including MCP-1, IL-6, CCL5 (RANTES),2 CXCL10, and TNF-α (1, 2) (reviewed in Ref. 3). These molecules in turn induce a variety of local and systemic effects, most notably a state of cellular insulin resistance in fat as well as in extra-adipose tissues, such as muscle and liver. Accordingly, the signaling pathways that link inflammation to insulin resistance in fat have been intensively studied in recent years. Although many of the major signaling pathways (such as PI3K/AKT, MAPK, and JAK-STAT) have been studied in detail in adipocytes and other cell types, very little is known about the transcriptional mechanisms that establish these pathways.
One factor found to participate in adipogenesis by our laboratory and others is early B-cell factor 1 (EBF1), which was originally identified as a key regulator of B-cell differentiation (4–7). Another group simultaneously identified EBF1 as a factor involved in olfactory development and called it OLF-1 (8, 9). Previous studies in our laboratory have shown that EBF1 is induced by C/EBPβ and C/EBPδ and in turn induces expression of the key adipogenic transcription factors C/EBPα and PPARγ1 (10) and that RNAi-mediated loss of EBF1 prevents differentiation. Ebf1 expression rises early in adipogenesis and then returns to near base-line levels by day 4; however, its expression rises again during terminal differentiation and remains elevated. Ebf1−/− mice are lipodystrophic (11, 12), probably due to a nearly complete absence of adipocyte precursor cells (13). These results establish that EBF1 is required early in the formation of adipose lineage cells in vitro and in vivo. Of note, the related factor EBF2 was recently identified as a key element involved in brown adipogenesis (14).
In B-cells, EBF1 plays a critical role in specifying the B-cell lineage and operates in a complex transcriptional network involving E2A, PAX5, and FOXO1 (reviewed in Refs. 15 and 16). It also represses genes involved in other hematopoietic programs (17, 18). Some examples of direct EBF1 targets in B-cells include Pax5, Cd79a (mb-1), Vpreb1, Cd19, and Pou2af1 (19–21), although a comprehensive catalogue of EBF1 targets in these cell types remained unexplored for many years. Recent ChIP-seq and loss-of-function experiments in EBF1-deficient pro-B-cells as well as in mature B-cells have shown that EBF1 regulates genes involved in AKT and B-cell receptor signaling and the cell cycle (22–24). In pro-B-cells, EBF1 “poises” chromatin for expression at later stages of differentiation and has been suggested to act as a pioneer factor (22, 25).
Despite clear evidence that EBF1 is required for adipogenesis per se, little is known about the function or targets of EBF1 in mature adipocytes. To address this, we sought to identify both direct and indirect EBF1 targets in fat in an unbiased manner using expression analysis and ChIP-seq. We show that loss of EBF1 in mature adipocytes results in significant changes in the expression of ∼600 genes, many of which encode key signaling intermediates. We also show that EBF1 binds to ∼35,000 sites in 3T3-L1 cells, including several thousand that are unique to adipocytes. Two of the major pathways regulated by EBF1 in adipocytes are inflammation (principally through Toll-like receptors) and insulin signaling.
EXPERIMENTAL PROCEDURES
Lentiviral Knockdown of EBF1
Scrambled and shEbf1 hairpins were designed using the iRNAi program for Mac (Netherlands Cancer Institute). shRNA sequences for each hairpin can be found in supplemental Table 1. The 58-mer forward and reverse oligonucleotide sequences were annealed and cloned into pLKO.1 (Addgene). Constructs were transfected into 293T cells, and viral supernatants were collected at 48 and 72 h post-transfection. Mature 3T3-L1 cells were subjected to 3–4 serial infections with virus and selected with 5 μg/ml puromycin for at least 8 days prior to harvest.
Retroviral Expression of FLAG-tagged EBF1
Prior to differentiation, subconfluent 3T3-L1 cells were infected with retrovirus harboring FLAG-tagged EBF1 in pMSCV vector (AddGene) and then selected and passaged in the presence of 500 μg/ml hygromycin for 7 days. 8–10 days after the induction of differentiation with MDI (0.5 mm methylisobutylxanthine, 10 nm dexamethasone, and 5 μg/ml insulin), cells were infected with lentivirus harboring scrambled or shEbf1 constructs and then harvested at the indicated time points.
Microarrays
Three RNA samples for each of the three lentiviral shRNA-treated conditions were individually hybridized to Affymetrix GeneChip Mouse Genome 430 2.0 microarrays. RNA concentration was measured by Nanodrop, and the integrity of RNA was tested with the RNA integrity number score on an Agilent Bioanalyzer 2010. All samples were used only when RNA integrity number scores were verified to be larger than 7.0. Microarray hybridization and scanning were performed after amplification with the NuGEN Ovation WTA Pico kit and fragmentation and labeling with the Encore Biotin Module.
Microarray Data Analysis
Data were normalized and summarized using the Robust multi-array average algorithm (26). The quality of each chip was determined by manually checking mean values, variances, and paired scatter plots as well as principal component analysis plots. All chips passed the quality check. Differentially expressed genes were identified based on statistical significance, which was determined using the significance analysis of microarrays algorithm (27) and -fold change. The genes with p < 0.01 and -fold change >1.5 or <−1/1.5 were considered as up- or down-regulated. This combination of p value and -fold change threshold serves to eliminate most false positives (28). To further minimize false positives, only genes with maximum expression values across samples greater than 200 were considered as differentially expressed genes. We used unsupervised hierarchical analysis to cluster samples. The distance between single samples or genes were based on Pearson correlation coefficients. The distances between clusters were calculated using the “complete linkage” method, and differentially expressed genes were classified into two groups using the K-means algorithm as shown in Fig. 1A (29). Data were then subjected to GSEA (Gene Set Enrichment Analysis) (version 2.0.10), using default parameters described by Subramanian et al. (30).
FIGURE 1.

Ebf1 knockdown and selected adipocyte-enriched gene expression in EBF1-deficient cells. A, expression of Ebf1 and Ebf2 by qPCR in the same RNA samples used for the microarray. Error bars, S.E.; *, p < 0.05. B, time course of EBF1 protein decay in shEbf1-treated cells. *NS, nonspecific band. C, expression of several adipocyte-enriched transcripts by qPCR, using the same RNA samples used for the microarray. Error bars, S.E.; *, p < 0.05.
ChIP-seq
Mature 3T3-L1 adipocytes were cross-linked with 1% formaldehyde 10 days after induction with MDI. Frozen cell pellets were submitted to the Broad Institute for subsequent analysis of EBF1-bound regions using anti-EBF1 antibody (Abnova H00001879-M01). Sequencing libraries were generated essentially as described (31) except that up to 50 ng of DNA was used as starting material. Libraries were sequenced using Illumina HiSeq 2000. The length of reads was 36 nt.
ChIP-seq Analysis
All reads were aligned to the mm9 genome using MAQ (32) with default parameters. Duplicate reads were filtered out. Peaks were called as described by Mikkelsen et al. (33). Briefly, windows with 200 bp were used to scan along chromosomes with step size of 25 bp. A peak is called if the number of reads within a window is significant based on a Poisson statistical model. The λ parameter of the Poisson model was set at the normalized expected number of reads within the window in the WCE sample if the read number within the window in WCE was greater than the expected number within the window in the WCE sample or the expected number of reads within the window in the ChIP sample if the number of WCE reads within the window was less than or equal to the expected number in WCE sample. Significance was determined at a level of Benjamini-Hochberg multiple-testing corrected p value of 0.001 (34). Overlapping peaks were merged. The number of reads within each region was counted using the bedtools coverage version 2.16.1 (also known as coverageBed) program (35).
Motif Analysis
For top quartile EBF1 peaks, a 300-bp central sequence was cut out and scanned for known motifs in the Transfac database using the FIMO program from MEME (36). For the background set, we chose 1000 300-bp sequences that have been previously defined as open chromosome regions in 3T3-L1 adipocytes using DNase hypersensitivity (37) and that did not overlap with EBF1 peaks. For each transcription factor motif from Transfac database, we counted the number of sequences containing the motif in both the “differentially modified region” set and random set. Fisher's exact test was then applied to test whether the number of sequences containing the motif was significantly enriched or depleted in the differentially modified region set compared with the random set. De novo motif identification was performed using GLAM2 from the MEME software suite from the top 5000 peaks. The genes associated with peaks were submitted to the DAVID gene annotation and analysis Web site to identify enriched functional categories.
To compare the EBF1 cistrome in adipocytes and B-cells, we downloaded the raw read data associated with three prior publications from the NCBI SRA database (22–24) (IDs SRP002223, SRP010974, and SRP002585). We applied the same ChIP-seq data analysis procedure as used for adipocytes, including read alignment against the mm9 reference genome, duplicate removal, and peak calling, to obtain EBF1 binding sites from all three different data sets. To make the results comparable, we selected the top 25% of peaks from each set and merged them together to form a “unity” EBF1 B-cell peak set.
Luciferase Assays
Genomic fragments (∼250 bp) were amplified from genomic mouse liver DNA by PCR and subcloned into pGL4.23 (Promega) and transfected into 293T cells along with an EBF1 expression plasmid. The genomic coordinates (NCBI37/mm9) of the 12 peaks that were cloned were as follows: Peak 1 (chr1: 82282369–82282606), Peak 2 (chr1: 82186135–82186382), Peak 3 (chr13: 102531546–102531779), Peak 4 (chr13: 102618653–102618886), Peak 5 (chr7: 28392731–28393002), Peak 6 (chr5: 51912294–51912531), Peak 7 (chr5: 51822954–51823199), Peak 8 (chr11: 60038441–60038686), Peak 9 (chr11: 59995832–59996081), Peak 10 (chr2: 167770483–167770735), Peak 11 (chr4: 104767983–104768239), Peak 12 (chr1: 82407849–82408089). Luciferase assays were conducted using the Dual Luciferase Assay Kit (Promega) according to the manufacturer's instructions.
RNA Isolation and qPCR
RNA was isolated using TRIzol and washed twice with 80% EtOH, and then 1 μg was subjected to reverse transcription using the RetroScript kit (Ambion). For qPCR analysis, cDNA was diluted 100-fold in 2× SYBR master mix (Applied Biosystems) and subjected to amplification using the gene-specific primers described in supplemental Table S1. 36B4 was used as a normalization control.
Signaling and Western Blots
For phosphosignaling experiments, cells were treated with insulin, LPS, or IFN-γ and then harvested in high salt Triton X-100 lysis buffer (400 mm NaCl, 50 mm Tris-HCl, pH 7.4, 5 mm EDTA, 1% Triton X-100) supplemented with protease inhibitor tablets (Roche Applied Science) and phosphatase inhibitors (Boston BioProducts). Protein concentrations were determined using the DC protein assay kit (Bio-Rad), and 5–20 μg of total protein was loaded onto an SDS-polyacrylamide gel. Following transfer to PVDF membranes, lysates were subjected to immunoblotting. Antibodies for AKT, phospho-AKT (Ser-473), ERK1/2, phospho-ERK (Thr-202/Tyr-204), phospho-IRS1 (Ser-612), insulin receptor-β, STAT1, and phospho-STAT1 (Tyr-701) were obtained from Cell Signaling Technology (catalogue nos. 9272S, 9271S, 9102, 9101S, 2386S, 3025, 9172P, and 9171S, respectively). Anti-FLAG antibodies were obtained from Sigma-Aldrich (catalog no. F-1804), phospho-IRβ antibodies were obtained from Invitrogen (catalog no. 44804G), and PI3K-p85 antibodies were obtained from Millipore Corp. (catalog no. 06-496). Anti-Irs1 antibody was obtained as a gift from Dr. Morris White (Children's Hospital, Boston, MA).
Glucose Uptake and Lipogenesis
For glucose uptake assays, cells were serum-starved for 3–6 h before adding insulin. After 30 min of insulin, [3H]deoxyglucose/cold deoxyglucose was added to each well and incubated for 10 min at 37 °C. Cells were washed four times in PBS containing 10 μm cytochalasin B and then harvested in 100 μl of high salt Triton X-100 lysis buffer. A small aliquot of each sample was used for protein concentration determination using the DC protein assay, and the rest was subjected to scintillation counting.
For lipogenesis assays, cells were incubated in low glucose medium containing 2.5% FBS for 3–6 h prior to the addition of insulin. After 15 min, [14C]glucose was added to each well and incubated for an additional 45 min at 37 °C. Cells were washed four times in ice-cold PBS and then harvested in 1% SDS. A small aliquot was used for protein concentration measurements using the DC protein assay kit, and the rest were subjected to scintillation counting after extraction of neutral lipids with scintillation fluid.
ELISA
ELISA experiments were performed using kits according to the manufacturer's instructions (Abcam). In all cases, media from a few sample wells were first tested at various dilutions to empirically determine which ones best fell within the linear range of the ELISA for that particular protein. Typical working dilution factors ranged from 2- to 100-fold. For normalization, total cellular protein concentration from each well was measured in Triton X-100 lysates using the DC protein assay kit (Bio-Rad).
Lipolysis
Cells were washed twice in serum-free media and then incubated in serum-free medium + 0.2% BSA with or without LPS. After 24 h, medium was collected, and the free glycerol content was measured by spectrophotometry using the Free Glycerol Reagent (Sigma-Aldrich). Cells were washed and harvested in high salt Triton X-100 lysis buffer for protein concentration determination using the DC protein assay kit.
RESULTS
Identification of Genes and Pathways Functionally Regulated by EBF1
To ascertain the functional targets of EBF1 in adipocytes, we depleted EBF1 from mature 3T3-L1 cells by transducing them with lentivirus harboring one of two different Ebf1-specific hairpins or a scrambled control. We then performed expression profiling using Affymetrix arrays with triplicate samples for each hairpin. In repeated experiments, each hairpin knocked down endogenous Ebf1 by 70–80% (Fig. 1A). Notably, the expression levels of Ebf2 were significantly increased with both knockdown constructs, suggesting a compensatory mechanism operative in these cells (Fig. 1A), although it should be pointed out that basal levels of Ebf2 are an order of magnitude lower than Ebf1 in white adipose tissue and 3T3-L1 cells (14). In order to confirm EBF1 knockdown at the protein level, we treated FLAG-EBF1-expressing adipocytes with our knockdown constructs; EBF1 began to disappear 2 days after infection and was nearly undetectable by day 7 (Fig. 1B). Thus, for all subsequent experiments, we waited at least 1 week before harvesting cells.
In another control experiment, we selected a dozen genes known to be highly enriched in adipocytes and examined their expression by qPCR (Fig. 1C). Some adipocyte-specific genes, including Pparg and Adipoq, were significantly reduced in EBF1-deficient cells. Most of the other genes did not change significantly, indicating that EBF1 deficiency is selective for the expression of the affected genes and not the result of a global reduction of adipocyte-enriched transcripts. Notably, with the exception of Adipoq (for which there was no probe featured on the arrays), Pparg, Adrb3, and Lpin1, none of these other genes changed more than 10% in the array either, highlighting the excellent correspondence between the array data and more quantitative gene-specific qPCR.
Analysis of the transcriptional/microarray data showed good correspondence between the two hairpins in terms of which genes changed significantly with both (R2 = 0.489; Figs. 1C and 2 (A and B)). There were 209 and 357 genes that were significantly down-regulated and up-regulated (p < 0.01) by both hairpins, respectively (Fig. 2B), consistent with the idea that EBF1 can act as both a repressor and activator of gene expression (22). We next used gene set enrichment analysis (GSEA) (30) to determine which pathways were most strongly affected by EBF1 knockdown (Fig. 2C). Among the most strongly affected pathways were insulin signaling and Toll-like receptor signaling, both of which have important roles in metabolic homeostasis.
FIGURE 2.

Microarray and gene set enrichment analysis of EBF1-deficient adipocytes. A, heat map of probes whose signals were significantly up- or down-regulated (p < 0.01 and -fold change of >1.5 or <1/1.5) in cells infected with lentivirus harboring either of two shEbf1 constructs. Clustering of the two hairpins is indicated by the dendrogram. y axis, probes; x axis, sample identity. Vertical scale indicates log(-fold change). B, scatter plot comparing the relative expression of individual genes (shown as dots) in cells treated with shEbf1-A versus shEbf1-B. Genes significantly (p < 0.01) down-regulated by both hairpins are shown in green, and genes significantly (p < 0.01) up-regulated by both hairpins are shown in red. The axis indicates log(-fold change) with each hairpin. C, scatter plot comparing the p values of enriched KEGG pathways in cells treated with shEbf1-A versus shEbf1-B. KEGG pathways that scored significantly (p < 0.05) with both shEbf1 constructs are shown inside the dotted box.
Genome-wide ChIP-seq Analysis of EBF1 Binding in Mature 3T3-L1 Adipocytes
Next, in order to identify direct targets of EBF1, we used ChIP-seq to acquire an unbiased census of sites bound by EBF1 in mature adipocytes. We compared sequence reads from EBF1-bound and control (whole cell) extracts covering the whole genome. A total of 34,534 EBF1-bound regions were identified using previously described methods (33). Several prominent adipocyte-enriched genes were associated with strong peaks; for instance, the Adipoq gene was associated with multiple high amplitude EBF1 peaks clustered toward the 5′-end of the gene (Fig. 3A). Others, such as Fasn, contained a single sharp peak only in the putative promoter region. The genome browser tracks of many other loci, such as Scd1, showed multiple distinct peaks within intronic regions as well as both upstream and downstream of the gene body.
FIGURE 3.

Genome-wide EBF1 ChIP-seq in 3T3-L1 adipocytes. A, genome browser tracks of selected genes of interest. Peak calls scoring in the top quartile by amplitude are marked with a red bar. B, chart showing distribution of EBF1 binding sites expressed as absolute numbers (top) or percentages (bottom). C, position-weight matrix of the most common motif found underneath all peaks in our study. D, table showing the percentage of EBF1 binding sites found associated with various motifs and histone modification marks, arranged by quartile. N, number of peaks in each quartile. All other values represent percentages of the number of peaks in that quartile. E, table showing all non-EBF1 motifs associated with the top quartile of peaks, ±300 bp. % bound, percentage of peaks that feature the indicated motif, arranged in order of decreasing odds ratio. F, DAVID analysis of ChIP-seq data. All genes associated with top quartile EBF1 peaks were subjected to DAVID analysis. The most significantly enriched KEGG pathways (p < 0.001) are arranged in order of increasing p value; pathways also scoring significantly in the GSEA (Fig. 2C) are highlighted.
We then assigned each peak to the closest annotated TSS in order to determine the distribution of EBF1 binding sites across the genome. We found that less than a quarter of all binding sites were found within ±10 kb of the TSS, whereas the majority were located between 10 and 100 kb from the TSS (Fig. 3B), suggesting that EBF1 might act mainly in enhancer regions to stimulate gene transcription, in agreement with EBF1 binding data in B-cells (22). Additionally, very few peaks were found more than 100 kb from the TSS (∼10% in either direction), suggesting a relatively high co-enrichment of EBF1 binding sites near and within genes. Motif analysis using MEME confirmed the consensus EBF1/OLF-1 motif as the most highly represented sequence within the peaks (Fig. 3C).
To more finely analyze the distribution of EBF1-bound sites and determine their co-occurrence with epigenetic marks, we divided our peaks into quartiles (based on amplitude) and compared the data with our previous studies on various histone modifications and PPARγ binding in 3T3-L1 cells (33) (Fig. 3D). Overall, we found a high degree of overlap between EBF1 sites and marks associated with open chromatin, which was especially prominent among top quartile peaks. Similarly, top quartile peaks overlapped significantly with PPARγ sites (28.9%), suggesting that EBF1 and PPARγ may co-regulate a subset of genes in adipocytes.
Using a de novo search algorithm, we asked what transcription factor binding sites might co-occur with EBF1 sites within a 300-bp segment underneath each of the top quartile peaks in our study (Fig. 3E). We found that other than the dominant EBF1 (p = 4.2E−207) and OLF-1 (p = 2.34E−91) sites, several additional transcription factor binding sites were significantly enriched (Fig. 2E). The most heavily overrepresented motifs primarily corresponded to members of the forkhead box family, HNF members, and nuclear receptors, such as COUP-TFs and PPARs, many of which are highly expressed in adipocytes. This suggests that EBF1 may physically or functionally interact with these factors, especially because about 25% of the first quartile peaks do not contain an identifiable EBF1 motif. We also identified co-occurring motifs in a more restricted area around EBF1 sites (±50 bp; Fig. 4A). Interestingly, only four sites were found to be highly enriched in this interval, including that for ZFP423, which was previously found to act as an important co-factor for EBF1 and which has also been shown to be an important determinant of adipose lineage specification (38–41).
FIGURE 4.

Motif analysis and comparison with EBF1 cistrome in B-cells. A, motifs that co-occur with EBF1 ± 50bp. We analyzed all EBF1-containing first quartile peaks for enrichment of other TF motifs at an interval of ±50 bp using the TRANSFAC database. All sites recognized by transcription factors not found in mice or scoring an odds ratio of <1.5 were filtered from the lists. Enriched sites are sorted according to decreasing odds ratio. B, Venn diagram comparing the number of peaks in our first quartile versus the three other published B-cell data sets and DAVID analysis of the genes associated with the adipocyte-specific peaks, the common peaks, and the B-cell-specific peaks. Note than any given gene may fall into all three categories as long as it is associated with at least one of each type of peak. Only the top 10 most significantly enriched KEGG pathways are shown. C, Venn diagram comparing the number of genes bound by EBF1 in fat (associated with the first quartile of peaks) versus the number of genes bound by EBF1 in B-cells (also associated with the first quartile of peaks).
DAVID Analysis of the ChIP-seq Data Indicates That Insulin Signaling and Adipocytokine Pathways Are Highly Enriched in EBF1
In order to determine the top pathways regulated by EBF1, we subjected the ∼5000 genes associated with the first quartile of peaks to DAVID analysis (Fig. 3F). Of the top 12 most significant KEGG pathways scoring in this analysis, three of them also scored as significant with both hairpins in the GSEA analysis. These include insulin signaling and adipocytokine signaling, with p values of 5.7E−5 and 6.8E−4, respectively. This suggests that EBF1 binding correlates with transcriptional activation of these genes. Additionally, many EBF1-bound genes were shared between these pathways, suggesting that EBF1 may regulate multiple pathways through the same set of core genes. Of note, this analysis did not identify a significant association between Toll-like receptor signaling genes and EBF1 binding sites, as discussed below.
Unique and Shared EBF1 Binding Sites in Adipocytes and B-cells
We next sought to compare the EBF1 cistrome in adipocytes with previously published data from pro-B-cells and mature splenic B-cells (22–24). To perform this analysis, we took raw data from each of the three published studies in B-cells and recalled peaks in exactly the same manner as was done for the adipocyte data. In this way, we identified 7795 unique peaks found in B-cells at any of the developmental stages studied. These peaks were largely distinct from EBF1 binding sites in adipocytes, and only ∼10% of the top quartile adipocyte peaks were shared in B-cells. We next looked for peaks that were specific for adipocytes or B-cells and compared them with peaks that were shared in both cell types. We then asked what genes are associated with these peaks and performed DAVID bioinformatics analysis separately on the three categories (Fig. 4B). For genes that have at least one adipocyte-specific peak, the results were similar to the global analysis of our top quartile peaks. Interestingly, insulin signaling appeared as the number one “hit” after DAVID analysis of genes containing at least one shared peak, although there were only 14 genes in this KEGG pathway that fell into this category (compared with 49 genes in this pathway that have at least one adipocyte-specific peak). For genes that have at least one B-cell-specific peak but no shared peak, cancer pathways and B-cell receptor signaling were atop the list.
We also compared the adipocyte and B-cell data sets in terms of which genes are bound by EBF1 (Fig. 4C). In this analysis, the “overlap” would include all genes bound by EBF1 in both fat and B-cells, regardless of whether they are associated with any shared peaks. Thus, a gene in this category could be bound by EBF1 in two separate places in fat and B-cells. Notably, there was significantly more overlap between the genes that are bound by EBF1 in both fat in B-cells (∼26% of all genes represented in the first quartile of peaks in both data sets were shared) than in the peak overlap (only ∼6% of all peaks in both first quartile data sets were shared), suggesting that for most of the shared genes, EBF1 binds at different sites. This may reflect differences in local chromatin accessibility directing EBF1 binding in the two cell types. It is also possible that EBF1 binding at a cell type-unique enhancer site is associated with fat cell-enriched transcription factors in fat (i.e. PPARγ and COUP-TF) and B-cell-enriched transcription factors in B-cells (i.e. Ets and PAX5).
Visual inspection of several key gene tracks in fat and B-cells demonstrated both gene- and cell type-specific patterns of EBF1 binding (Figs. 5 and 6). For instance, EBF1 binds to the Pparg locus at numerous sites in adipocytes, yet no peaks can be observed in any of the three B-cell ChIP-seq data sets (Fig. 5A). In contrast, the B-cell gene Cd79b displayed sharp peaks in all three B-cell data sets but not in fat (Fig. 5B). Phka1 and Lipe are examples of insulin signaling-related genes that are only bound by EBF1 in adipocytes, whereas Mapk1 is bound by EBF1 at a common site in both cell types (Fig. 6). Finally, some genes like Foxo1 are bound by EBF1 in both cell types at a common site as well as cell type-specific sites, suggesting both a shared and cell type-specific mode of regulation of these loci. Interestingly, the gene for Ebf1 itself was strongly bound by EBF1 at several places in adipocytes and several places in the Murre B-cell data set, although these sites were largely different (Fig. 6F), implying that EBF1 autoregulates in fat through a mechanism distinct from that in B-cells (42).
FIGURE 5.
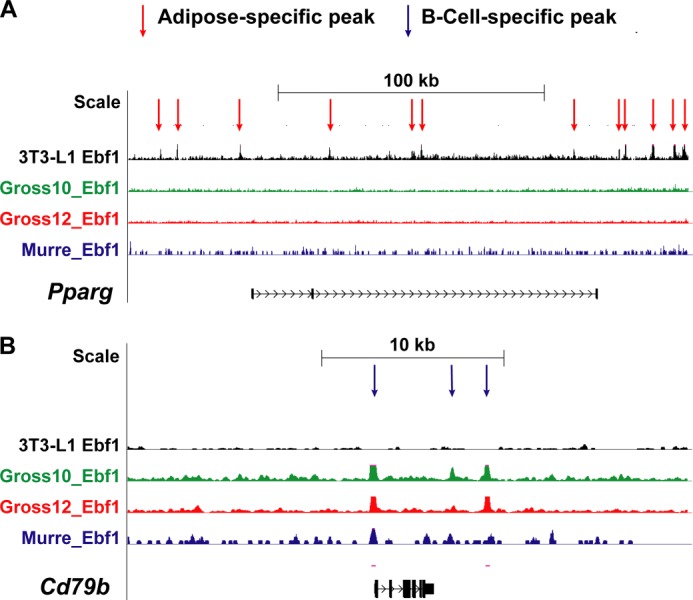
Examples of two genome browser tracks showing binding of EBF1 to selected loci in fat versus B-cells. Genome browser tracks from our data as well as the three other published B-cell ChIP-seq data sets are depicted in A and B. Some genes, like Pparg, are only bound by EBF1 in adipocytes (A), and others (Cd79b) are only bound by EBF1 in B-cells (B). 3T3-L1, current study; Gross_10, Treiber et al. (22); Gross_12, Györy et al. (24); Murre, Lin et al. (23).
FIGURE 6.

Genome browser tracks from our data as well as the three other published B-cell ChIP-seq data sets are depicted in A–F. Some genes, like Foxo1, are bound by EBF1 at different sites in different cell types (A). Still others, like Mapk1, contain a prominent common peak (D). WCE and EBF1 ChIP are shown. Gross_10, Treiber et al. (22); Gross_12, Györy et al. (24); Murre, Lin et al. (23).
In Vitro Validation of EBF1 Peak Activation
In order to demonstrate functional activation of EBF1-bound regions in fat cells in vitro, we generated a serious of luciferase constructs containing a minimal promoter driven by a few selectively chosen, short (∼250-bp) EBF1-bound regions. We first examined several insulin signaling genes for the occurrence of peaks within and near the gene body (Fig. 7A). For the most prominent peaks, we searched for EBF1 consensus sites using the MULAN algorithm (43) and then cloned several ∼250-bp fragments into a reporter vector (Fig. 7B). Co-transfection of EBF1 significantly induced 10 of the 11 constructs; a randomly chosen “non-peak” genomic region of similar size showed no activation by EBF1 (Fig. 7B). These results indicate that the peak fragments identified by our ChIP-seq studies can confer responsiveness to EBF1 in a heterologous system.
FIGURE 7.

Validation of EBF1 responsiveness to sequences underneath EBF1 peaks in vitro. A, genome browser tracks of select loci of interest. Numbers indicate specific peaks chosen for further analysis. WCE and EBF1 ChIP are shown. B, schematic of luciferase constructs used for in vitro luciferase assays and the corresponding results, shown in bar graph format. Green bars, relative size of the cloned fragments underneath the selected peaks; orange marks, approximate position of the putative EBF1 motifs (not to scale). In cases where there were two consensus EBF1 sites underneath the identified peak sequence, the two sites are labeled as 5a, 5b, etc. Details regarding the specific genomic coordinates corresponding to each cloned fragment can be found under “Experimental Procedures.” For activation assay experiments, 293T cells were transfected with each construct with or without Ebf1 in quadruplicate. Results are shown as absolute activation relative to cells transfected with equivalent amounts of empty vector, along with the indicated reporter construct.
Knockdown of EBF1 Inhibits Insulin Signaling
The appearance of the Insulin Signaling gene set in both the GSEA and ChIP-seq experiments as a significantly enriched pathway led us to hypothesize that insulin action would be impaired in EBF1-deficient cells. We first confirmed that loss of EBF1 significantly reduces the expression levels of key insulin signaling genes like Irs1, Pik3r1, and Akt2 as well as Prkaa2 and Srebf1 (Fig. 8A). We next examined the effect of EBF1 deficiency on insulin signaling per se as well as proximal metabolic readouts (insulin-stimulated glucose uptake and lipogenesis). Although knockdown of EBF1 had no effect on levels of total insulin receptor protein levels (IR-β) or insulin-induced IR-β phosphorylation, the levels of both total and phospho-IRS1 were severely diminished (Fig. 8B), consistent with the effects we observed upon mRNA expression of this gene. Insulin-stimulated AKT phosphorylation was also abolished, although total levels of AKT did not change. Levels of p85α were also dramatically decreased at both the RNA and protein levels. These effects occur distal to the insulin receptor, because its expression levels were not affected, and are also are not likely to be due to decreased efficiency of phosphorylation per se, because the decrease in phosphoprotein levels of IRS1 and AKT2 closely followed the decrease in total Irs1 protein levels.
FIGURE 8.

EBF1 knockdown impairs insulin signaling in adipocytes. A, expression of selected insulin signaling genes in EBF1-deficient 3T3-L1 adipocytes by qPCR. Error bars, S.E.; *, p < 0.05. B, insulin signaling is impaired in EBF1-deficient cells. EBF1 knockdown or control cells were treated with or without 10 nm insulin for 30 min and then harvested with lysis buffer and subjected to SDS-PAGE/immunoblotting with the indicated antibodies. Each transduction was performed in triplicate. Experiments were performed with scrambled hairpin versus shEbf1-A. C, EBF1 knockdown impairs insulin-stimulated glucose uptake. Data are normalized to total protein; transductions were performed in quadruplicate. Error bars, S.E. Experiments were performed with scrambled hairpin versus shEbf1-A. D, EBF1 knockdown impairs insulin-stimulated lipogenesis. Data are normalized to total protein obtained in each sample, and each infection was performed in quadruplicate. Experiments were performed with scrambled hairpin versus shEbf1-A. Error bars, S.E.
Consistent with the signaling data, insulin-stimulated (but not basal) glucose uptake was reduced in EBF1-deficient cells (Fig. 8C). A similar result was seen with de novo lipogenesis, with insulin-stimulated conversion of glucose to palmitate reduced by 35% in the absence of EBF1 (Fig. 8D).
In order to visualize the list of direct and indirect targets of the insulin signaling pathway by EBF1 in fat, we compared the GSEA data with the ChIP-seq data in the context of an expanded and modified KEGG pathway (Fig. 9). Positively regulated genes are colored green, and negatively regulated genes are colored red. Genes assigned a high confidence peak within the first quartile data set are marked with an Ebf1 label. Although the expression of many genes in the pathway (∼54%) was altered by EBF1 knockdown, only about one-third of these were associated with a strong (first quartile) peak, suggesting that EBF1 may regulate the remaining weakly bound (or unbound) genes through additional factors.
FIGURE 9.

Schematic of genes in the insulin signaling KEGG pathway that are directly or indirectly regulated by EBF1. Shown is a modified insulin signaling pathway depicting integrated results obtained from microarray/GSEA and EBF1-ChIP-seq. Genes that are positively regulated by EBF1 are shown in green, genes that are negatively regulated by EBF1 are shown in red, and genes that EBF1 binds to directly (as determined by ChIP-seq) are marked with a yellow oval Ebf1 symbol. The pie chart on the right depicts the number of genes falling into each of four possible categories (see “Discussion”).
Knockdown of EBF1 Impairs Toll-like Receptor Signaling
Because Toll-like receptor signaling was the most significantly affected pathway in the loss-of-function experiment, we investigated whether responsiveness to TLR ligands was affected in EBF1-deficient cells. We first validated the reduction of several core genes in the pathway by qPCR. The expression of many of these genes was indeed dramatically altered (Fig. 10A); two chemokines, Ccl5 and Cxcl10, were reduced by over 95% in the absence of EBF1. We also found that the expression levels of Tlr2, Tlr3, and Tlr4 were decreased in EBF1-deficient cells. Importantly, we also validated the expression of several genes not affected in the microarray (Fig. 10B) and confirmed that only a subset of key genes in the pathway is regulated by EBF1. Importantly, we found that for three of the most significantly down-regulated cytokines (CCL5, CXCL10, and IL-6), basal and LPS-stimulated protein secretion were significantly reduced, as measured by ELISA (Fig. 10C), indicating that reduced expression levels of the genes encoding these factors translates into reduced protein secretion in EBF1-deficient cells. Notably, TLR signaling did not appear as a significantly enriched pathway in the ChIP-seq experiment, and visual inspection of the genome tracks of several of the relevant loci revealed no discernible peaks within ±10 kb of the gene body, with the exception of Irf1 and Stat1 (data not shown). Although it is possible that the peaks closest to these genes (typically ±10–100 kb from the TSS) might confer direct regulation by EBF1, our peak-calling algorithm in fact assigned those distal peaks to the (closer) TSSs of neighboring genes, suggesting that all but Irf1 and Stat1 are secondary targets of EBF1 in fat.
FIGURE 10.

EBF1 knockdown inhibits inflammatory signaling in adipocytes. A and B, expression of Toll-like receptor signaling genes in EBF1-deficient 3T3-L1 adipocytes. Error bars, S.E.; *, p < 0.05. C, LPS-stimulated secretion of CCL5 (RANTES), CXCL10, and IL-6 proteins are impaired in EBF1 knockdown cells. Cells were treated with or without 100 ng/ml LPS for 24 h in serum-free medium; conditioned cell medium was collected and diluted as needed, and concentrations of the relevant antigen were measured by ELISA. Data were normalized to total protein recovered from each well. All measurements were performed in quadruplicate. Error bars, S.E.; *, p < 0.01; **, p < 0.001; NS, not significant. D, LPS-induced ERK1/2 signaling is impaired in EBF1 knockdown cells. Control or EBF1 knockdown cells were serum-starved for 6 h and then treated with 100 ng/ml LPS for the indicated time period. Relative levels of phosphorylated and total ERK1/2 were determined by immunoblotting. For phosphoproteins, the blot was exposed to film at two different time points: <5 min after the addition of ECL reagent (Early Exposure) and >20 min after the addition of ECL reagent (Late Exposure). E, LPS-stimulated lipolysis is impaired in EBF1 knockdown cells. Error bars, S.E.; *, p < 0.01; **, p < 0.001; NS, not significant. F, IFN-γ-stimulated STAT1 and ERK1/2 phosphorylation is impaired in EBF1-deficient cells. Relative levels of phosphorylated and total STAT1 and ERK1/2 were determined by SDS-PAGE and immunoblotting.
Because of the significant decrease in the expression of TLR-signaling pathway genes observed in EBF1-deficient cells, we reasoned that LPS-stimulated ERK-1/2 phosphorylation and lipolysis would also be impaired. Indeed, 100 ng/ml LPS had a significantly diminished stimulatory effect on ERK phosphorylation in cells lacking EBF1 (Fig. 10D). Total ERK did not change significantly, indicating that the results are due to a proximal signaling event and not simply the result of reduced ERK protein. Finally, we incubated control and knockdown cells with varying concentrations of LPS for 24 h in serum-free medium. This robustly stimulated lipolysis and was maximal at 10 ng/ml, although the magnitude was significantly reduced at the higher concentrations of LPS in EBF1-deficient cells (Fig. 10E). Thus, lack of EBF1 impairs the actions of LPS in 3T3-L1 cells.
Reduced STAT1 Phosphorylation in EBF1 Knockdown Cells
Because expression levels of STAT1 were reduced in EBF1-deficient cells, we asked whether total and phospho-STAT1 protein levels would also be impaired. To this end, we treated cells with IFN-γ, a potent inducer of STAT1 phosphorylation in 3T3-L1 cells (44). IFN-γ strongly induced STAT1-Ser-701 phosphorylation with all hairpin constructs, although this was reduced in the knockdown cells along with total STAT1 protein (Fig. 10F). We also found that IFN-γ could induce a transient but weak ERK1/2 phosphorylation at 15 min, which failed completely in the knockdown cells (bottom panels). These results indicate that JAK-STAT signaling is a target of EBF1 in adipocytes in addition to the PIK3/AKT and ERK/MAPK signaling pathways.
DISCUSSION
Our results provide significant insights into the mechanisms by which metabolic and signaling pathways are established at the transcriptional level in adipocytes. We have identified EBF1 as a crucial new player in both insulin and TLR signaling in mature fat cells. The former occurs through direct binding of EBF1 to its targets, whereas the latter may occur through a secondary mechanism. In either case, loss of EBF1 dramatically reduces the cellular response to insulin and inflammatory agents. The present study clearly demonstrates that EBF1 drives core signaling machinery involved in glucose and lipid metabolism through both proximal and distal components of these pathways. This largely occurs through EBF1 binding to regions distal to the TSSs of putative target genes.
Our results expand greatly upon our previous studies of EBF1 target and function during adipogenesis to illuminate the role of this protein in mature fat. We previously identified a binding site for EBF1 within the first 0.4-kb PPARγ promoter by EMSA and ChIP analysis that is occupied up until at least day 7 of differentiation (10); however, in the current experiment, this site is evidently not occupied in late stage mature L1 cells because no peak was observed within this region. Nevertheless, PPARγ levels did change significantly in the loss-of-function experiments, and the Pparg locus does have multiple distinct peaks, suggesting that EBF1 binding sites may change in early differentiation versus late stage cells. Curiously, we also did not observe any peaks in the proximal Slc2a4 gene promoter region corresponding to the EBF1 site previously claimed to mediate insulin repression of this gene (45). A trivial explanation for the disparity between our current and previous results could be the different antibodies employed (anti-FLAG versus anti-EBF1); we also cannot rule out the possibility that EBF1 binding might be different between day 7 after differentiation and day 9 (current study). These results highlight the importance of conducting an unbiased search for transcription factor binding sites.
Qualitative analysis of the loss-of-function and microarray findings demonstrates four categories of genes in our study: genes that are neither bound nor regulated by EBF1, genes that are bound by EBF1 but not regulated, genes that are regulated but not EBF1-bound, and genes that are both bound and regulated by EBF1. For the genes that are unbound but change with loss of EBF1, the most parsimonious explanation would be that these are secondary targets of EBF1 (i.e. subject to direct regulation by an EBF1-regulated transcription factor). Other genes, such as Foxo1, have clear peaks assigned to them but do not change with the loss-of-function analysis. We consider several possible explanations for this discrepancy. 1) the peak may simply be misassigned, so that the suspected EBF1-bound region is irrelevant to that particular locus. One would need to employ chromosome conformation capture or a similar assay to reveal physical contact between a binding site and a particular promoter. 2) our knockdown is incomplete (typically ∼75–80%), such that residual EBF1 could still be capable of driving expression of a subset of genes, perhaps those associated with the highest affinity peaks. These “surviving” genes would essentially score as false negatives in the GSEA. 3) we cannot rule out the possibility of EBF2 and/or EBF3 compensating for EBF1 at some sites in EBF1 knockdown cells, because the consensus sites for all three proteins are similar, and all EBFs are predicted to be capable of binding to the same consensus sequence (46). In support of this, the expression of Ebf2 in the knockdown cells increases slightly (Fig. 1A); the expression of Ebf3 is very difficult to detect by qPCR even in control cells (not shown). Finally, it is also possible that at some genes EBF1 “poises” chromatin for activation by other factors or stimuli that would have been absent during our ChIP-seq experiment (e.g. activation of certain genes with an exogenous PPARγ ligand). Because no such ligands were added, these activation events would go undetected with our experimental conditions, regardless of the presence of EBF1.
Given the clear reduction of inflammatory signaling in our study, the co-occurrence of EBF1/NF-κB motifs in adipocytes is intriguing (see Fig. 4). A relationship between EBF1 and NF-κB is also consistent with the results of Treiber et al. (22), who showed a highly significant co-enrichment of NF-κB sites with EBF1-bound regions in B-cells. Additionally, in a search for factors that cooperate with NF-κB, Karczewski et al. found an association in silico between motifs for EBF1 and NF-κB using ChIP-seq in a human lymphoblastoid cell line (47). The present results suggest the possibility of an inflammatory network involving EBF1, NF-κB, and STAT1 in adipocytes. Future experiments involving replacement of one or more STAT1/NF-κB pathway components in EBF1-deficient adipocytes might shed light on this possibility.
The significance of dual regulation of insulin signaling and inflammation by EBF1 in fat is unclear at best. A reduction in inflammatory signaling would be expected to improve insulin signaling in adipocytes; thus, it is intriguing that EBF1 appears to positively regulate two opposing pathways. What, if any, effect this has on systemic insulin sensitivity in vivo remains to be determined. Global Ebf1−/− mice have been reported to possess the unusual combination of lipodystrophy and insulin sensitivity (11), although it is unclear whether or to what extent effects in mature adipocytes account for these observations. Further studies of EBF1-regulated pathways in mice deficient in EBF1 in adipose tissue should shed light on the role of this protein in vivo.
Acknowledgments
We thank Mikael Sigvardsson and Morris White for antibodies and the Rosen laboratory for helpful discussions. We also thank Supriya Gupta and the Broad Gene Expression Platform for performing the microarray studies.
This work was supported, in whole or in part, by National Institutes of Health Grants R01 DK078061 (to E. D. R.) and F32 DK082161 (to M. J. G.).

This article contains supplemental Table S1.
- RANTES
- regulated on activation normal T cell expressed and secreted
- TLR
- Toll-like receptor
- ChIP-seq
- ChIP-sequencing
- WCE
- whole cell extract
- qPCR
- quantitative PCR
- TSS
- transcription start site.
REFERENCES
- 1. Skurk T., Mack I., Kempf K., Kolb H., Hauner H., Herder C. (2009) Expression and secretion of RANTES (CCL5) in human adipocytes in response to immunological stimuli and hypoxia. Horm. Metab. Res. 41, 183–189 [DOI] [PubMed] [Google Scholar]
- 2. Lee H. S., Park J. H., Kang J. H., Kawada T., Yu R., Han I. S. (2009) Chemokine and chemokine receptor gene expression in the mesenteric adipose tissue of KKAy mice. Cytokine 46, 160–165 [DOI] [PubMed] [Google Scholar]
- 3. Gregor M. F., Hotamisligil G. S. (2011) Inflammatory mechanisms in obesity. Annu. Rev. Immunol. 29, 415–445 [DOI] [PubMed] [Google Scholar]
- 4. Gisler R., Jacobsen S. E., Sigvardsson M. (2000) Cloning of human early B-cell factor and identification of target genes suggest a conserved role in B-cell development in man and mouse. Blood 96, 1457–1464 [PubMed] [Google Scholar]
- 5. Hagman J., Belanger C., Travis A., Turck C. W., Grosschedl R. (1993) Cloning and functional characterization of early B-cell factor, a regulator of lymphocyte-specific gene expression. Genes Dev. 7, 760–773 [DOI] [PubMed] [Google Scholar]
- 6. Lin H., Grosschedl R. (1995) Failure of B-cell differentiation in mice lacking the transcription factor EBF. Nature 376, 263–267 [DOI] [PubMed] [Google Scholar]
- 7. Lukin K., Fields S., Hartley J., Hagman J. (2008) Early B cell factor. Regulator of B lineage specification and commitment. Semin. Immunol. 20, 221–227 [DOI] [PMC free article] [PubMed] [Google Scholar]
- 8. Milatovich A., Qiu R. G., Grosschedl R., Francke U. (1994) Gene for a tissue-specific transcriptional activator (EBF or Olf-1), expressed in early B lymphocytes, adipocytes, and olfactory neurons, is located on human chromosome 5, band q34, and proximal mouse chromosome 11. Mamm. Genome 5, 211–215 [DOI] [PubMed] [Google Scholar]
- 9. Wang M. M., Reed R. R. (1993) Molecular cloning of the olfactory neuronal transcription factor Olf-1 by genetic selection in yeast. Nature 364, 121–126 [DOI] [PubMed] [Google Scholar]
- 10. Jimenez M. A., Akerblad P., Sigvardsson M., Rosen E. D. (2007) Critical role for Ebf1 and Ebf2 in the adipogenic transcriptional cascade. Mol. Cell. Biol. 27, 743–757 [DOI] [PMC free article] [PubMed] [Google Scholar]
- 11. Fretz J. A., Nelson T., Xi Y., Adams D. J., Rosen C. J., Horowitz M. C. (2010) Altered metabolism and lipodystrophy in the early B-cell factor 1-deficient mouse. Endocrinology 151, 1611–1621 [DOI] [PMC free article] [PubMed] [Google Scholar]
- 12. Hesslein D. G., Fretz J. A., Xi Y., Nelson T., Zhou S., Lorenzo J. A., Schatz D. G., Horowitz M. C. (2009) Ebf1-dependent control of the osteoblast and adipocyte lineages. Bone 44, 537–546 [DOI] [PMC free article] [PubMed] [Google Scholar]
- 13. Festa E., Fretz J., Berry R., Schmidt B., Rodeheffer M., Horowitz M., Horsley V. (2011) Adipocyte lineage cells contribute to the skin stem cell niche to drive hair cycling. Cell 146, 761–771 [DOI] [PMC free article] [PubMed] [Google Scholar]
- 14. Rajakumari S., Wu J., Ishibashi J., Lim H. W., Giang A. H., Won K. J., Reed R. R., Seale P. (2013) EBF2 determines and maintains brown adipocyte identity. Cell Metab. 17, 562–574 [DOI] [PMC free article] [PubMed] [Google Scholar]
- 15. Nutt S. L., Kee B. L. (2007) The transcriptional regulation of B cell lineage commitment. Immunity 26, 715–725 [DOI] [PubMed] [Google Scholar]
- 16. Mandel E. M., Grosschedl R. (2010) Transcription control of early B cell differentiation. Curr. Opin. Immunol. 22, 161–167 [DOI] [PubMed] [Google Scholar]
- 17. Pongubala J. M., Northrup D. L., Lancki D. W., Medina K. L., Treiber T., Bertolino E., Thomas M., Grosschedl R., Allman D., Singh H. (2008) Transcription factor EBF restricts alternative lineage options and promotes B cell fate commitment independently of Pax5. Nat. Immunol. 9, 203–215 [DOI] [PubMed] [Google Scholar]
- 18. Lukin K., Fields S., Guerrettaz L., Straign D., Rodriguez V., Zandi S., Månsson R., Cambier J. C., Sigvardsson M., Hagman J. (2011) A dose-dependent role for EBF1 in repressing non-B-cell-specific genes. Eur. J. Immunol. 41, 1787–1793 [DOI] [PMC free article] [PubMed] [Google Scholar]
- 19. Zandi S., Mansson R., Tsapogas P., Zetterblad J., Bryder D., Sigvardsson M. (2008) EBF1 is essential for B-lineage priming and establishment of a transcription factor network in common lymphoid progenitors. J. Immunol. 181, 3364–3372 [DOI] [PubMed] [Google Scholar]
- 20. Sigvardsson M., Clark D. R., Fitzsimmons D., Doyle M., Akerblad P., Breslin T., Bilke S., Li R., Yeamans C., Zhang G., Hagman J. (2002) Early B-cell factor, E2A, and Pax-5 cooperate to activate the early B cell-specific mb-1 promoter. Mol. Cell. Biol. 22, 8539–8551 [DOI] [PMC free article] [PubMed] [Google Scholar]
- 21. O'Riordan M., Grosschedl R. (1999) Coordinate regulation of B cell differentiation by the transcription factors EBF and E2A. Immunity 11, 21–31 [DOI] [PubMed] [Google Scholar]
- 22. Treiber T., Mandel E. M., Pott S., Györy I., Firner S., Liu E. T., Grosschedl R. (2010) Early B cell factor 1 regulates B cell gene networks by activation, repression, and transcription-independent poising of chromatin. Immunity 32, 714–725 [DOI] [PubMed] [Google Scholar]
- 23. Lin Y. C., Jhunjhunwala S., Benner C., Heinz S., Welinder E., Mansson R., Sigvardsson M., Hagman J., Espinoza C. A., Dutkowski J., Ideker T., Glass C. K., Murre C. (2010) A global network of transcription factors, involving E2A, EBF1 and Foxo1, that orchestrates B cell fate. Nat. Immunol. 11, 635–643 [DOI] [PMC free article] [PubMed] [Google Scholar]
- 24. Györy I., Boller S., Nechanitzky R., Mandel E., Pott S., Liu E., Grosschedl R. (2012) Transcription factor Ebf1 regulates differentiation stage-specific signaling, proliferation, and survival of B cells. Genes Dev. 26, 668–682 [DOI] [PMC free article] [PubMed] [Google Scholar]
- 25. Maier H., Ostraat R., Gao H., Fields S., Shinton S. A., Medina K. L., Ikawa T., Murre C., Singh H., Hardy R. R., Hagman J. (2004) Early B cell factor cooperates with Runx1 and mediates epigenetic changes associated with mb-1 transcription. Nat. Immunol. 5, 1069–1077 [DOI] [PubMed] [Google Scholar]
- 26. Irizarry R. A., Hobbs B., Collin F., Beazer-Barclay Y. D., Antonellis K. J., Scherf U., Speed T. P. (2003) Exploration, normalization, and summaries of high density oligonucleotide array probe level data. Biostatistics 4, 249–264 [DOI] [PubMed] [Google Scholar]
- 27. Tusher V. G., Tibshirani R., Chu G. (2001) Significance analysis of microarrays applied to the ionizing radiation response. Proc. Natl. Acad. Sci. U.S.A. 98, 5116–5121 [DOI] [PMC free article] [PubMed] [Google Scholar]
- 28. MAQC Consortium, Shi L., Reid L. H., Jones W. D., Shippy R., Warrington J. A., Baker S. C., Collins P. J., de Longueville F., Kawasaki E. S., Lee K. Y., Luo Y., Sun Y. A., Willey J. C., Setterquist R. A., Fischer G. M., Tong W., Dragan Y. P., Dix D. J., Frueh F. W., Goodsaid F. M., Herman D., Jensen R. V., Johnson C. D., Lobenhofer E. K., Puri R. K., Schrf U., Thierry-Mieg J., Wang C., Wilson M., Wolber P. K., Zhang L., Amur S., Bao W., Barbacioru C. C., Lucas A. B., Bertholet V., Boysen C., Bromley B., Brown D., Brunner A., Canales R., Cao X. M., Cebula T. A., Chen J. J., Cheng J., Chu T. M., Chudin E., Corson J., Corton J. C., Croner L. J., Davies C., Davison T. S., Delenstarr G., Deng X., Dorris D., Eklund A. C., Fan X. H., Fang H., Fulmer-Smentek S., Fuscoe J. C., Gallagher K., Ge W., Guo L., Guo X., Hager J., Haje P. K., Han J., Han T., Harbottle H. C., Harris S. C., Hatchwell E., Hauser C. A., Hester S., Hong H., Hurban P., Jackson S. A., Ji H., Knight C. R., Kuo W. P., LeClerc J. E., Levy S., Li Q. Z., Liu C., Liu Y., Lombardi M. J., Ma Y., Magnuson S. R., Maqsodi B., McDaniel T., Mei N., Myklebost O., Ning B., Novoradovskaya N., Orr M. S., Osborn T. W., Papallo A., Patterson T. A., Perkins R. G., Peters E. H., Peterson R., Philips K. L., Pine P. S., Pusztai L., Qian F., Ren H., Rosen M., Rosenzweig B. A., Samaha R. R., Schena M., Schroth G. P., Shchegrova S., Smith D. D., Staedtler F., Su Z., Sun H., Szallasi Z., Tezak Z., Thierry-Mieg D., Thompson K. L., Tikhonova I., Turpaz Y., Vallanat B., Van C., Walker S. J., Wang S. J., Wang Y., Wolfinger R., Wong A., Wu J., Xiao C., Xie Q., Xu J., Yang W., Zhang L., Zhong S., Zong Y., Slikker W., Jr. (2006) The MicroArray Quality Control (MAQC) project shows inter- and intraplatform reproducibility of gene expression measurements. Nat. Biotechnol. 24, 1151–1161 [DOI] [PMC free article] [PubMed] [Google Scholar]
- 29. Hartigan J. A., Wong M. A. (1979) A K-means clustering algorithm. J. R. Stat. Soc. Ser. C 28, 100–108 [Google Scholar]
- 30. Subramanian A., Tamayo P., Mootha V. K., Mukherjee S., Ebert B. L., Gillette M. A., Paulovich A., Pomeroy S. L., Golub T. R., Lander E. S., Mesirov J. P. (2005) Gene set enrichment analysis. A knowledge-based approach for interpreting genome-wide expression profiles. Proc. Natl. Acad. Sci. U.S.A. 102, 15545–15550 [DOI] [PMC free article] [PubMed] [Google Scholar]
- 31. Mikkelsen T. S., Ku M., Jaffe D. B., Issac B., Lieberman E., Giannoukos G., Alvarez P., Brockman W., Kim T. K., Koche R. P., Lee W., Mendenhall E., O'Donovan A., Presser A., Russ C., Xie X., Meissner A., Wernig M., Jaenisch R., Nusbaum C., Lander E. S., Bernstein B. E. (2007) Genome-wide maps of chromatin state in pluripotent and lineage-committed cells. Nature 448, 553–560 [DOI] [PMC free article] [PubMed] [Google Scholar]
- 32. Li H., Ruan J., Durbin R. (2008) Mapping short DNA sequencing reads and calling variants using mapping quality scores. Genome Res. 18, 1851–1858 [DOI] [PMC free article] [PubMed] [Google Scholar]
- 33. Mikkelsen T. S., Xu Z., Zhang X., Wang L., Gimble J. M., Lander E. S., Rosen E. D. (2010) Comparative epigenomic analysis of murine and human adipogenesis. Cell 143, 156–169 [DOI] [PMC free article] [PubMed] [Google Scholar]
- 34. Benjamini Y., Hochberg Y. (1995) Controlling the false discovery rate. A practical and powerful approach to multiple testing. J. R. Stat. Soc. Ser. B 57, 289–300 [Google Scholar]
- 35. Quinlan A. R., Hall I. M. (2010) BEDTools. A flexible suite of utilities for comparing genomic features. Bioinformatics 26, 841–842 [DOI] [PMC free article] [PubMed] [Google Scholar]
- 36. Grant C. E., Bailey T. L., Noble W. S. (2011) FIMO. Scanning for occurrences of a given motif. Bioinformatics 27, 1017–1018 [DOI] [PMC free article] [PubMed] [Google Scholar]
- 37. Siersbæk R., Nielsen R., John S., Sung M. H., Baek S., Loft A., Hager G. L., Mandrup S. (2011) Extensive chromatin remodelling and establishment of transcription factor “hotspots” during early adipogenesis. EMBO J. 30, 1459–1472 [DOI] [PMC free article] [PubMed] [Google Scholar]
- 38. Tsai R. Y., Reed R. R. (1998) Identification of DNA recognition sequences and protein interaction domains of the multiple-Zn-finger protein Roaz. Mol. Cell. Biol. 18, 6447–6456 [DOI] [PMC free article] [PubMed] [Google Scholar]
- 39. Tsai R. Y., Reed R. R. (1997) Cloning and functional characterization of Roaz, a zinc finger protein that interacts with O/E-1 to regulate gene expression. Implications for olfactory neuronal development. J. Neurosci. 17, 4159–4169 [DOI] [PMC free article] [PubMed] [Google Scholar]
- 40. Kang S., Akerblad P., Kiviranta R., Gupta R. K., Kajimura S., Griffin M. J., Min J., Baron R., Rosen E. D. (2012) Regulation of early adipose commitment by Zfp521. PLoS Biol. 10, e1001433. [DOI] [PMC free article] [PubMed] [Google Scholar]
- 41. Gupta R. K., Arany Z., Seale P., Mepani R. J., Ye L., Conroe H. M., Roby Y. A., Kulaga H., Reed R. R., Spiegelman B. M. (2010) Transcriptional control of preadipocyte determination by Zfp423. Nature 464, 619–623 [DOI] [PMC free article] [PubMed] [Google Scholar]
- 42. Smith E. M., Gisler R., Sigvardsson M. (2002) Cloning and characterization of a promoter flanking the early B cell factor (EBF) gene indicates roles for E-proteins and autoregulation in the control of EBF expression. J. Immunol. 169, 261–270 [DOI] [PubMed] [Google Scholar]
- 43. Loots G. G., Ovcharenko I. (2007) Mulan. Multiple-sequence alignment to predict functional elements in genomic sequences. Methods Mol. Biol. 395, 237–254 [PMC free article] [PubMed] [Google Scholar]
- 44. Balhoff J. P., Stephens J. M. (1998) Highly specific and quantitative activation of STATs in 3T3-L1 adipocytes. Biochem. Biophys. Res. Commun. 247, 894–900 [DOI] [PubMed] [Google Scholar]
- 45. Dowell P., Cooke D. W. (2002) Olf-1/early B cell factor is a regulator of glut4 gene expression in 3T3-L1 adipocytes. J. Biol. Chem. 277, 1712–1718 [DOI] [PubMed] [Google Scholar]
- 46. Travis A., Hagman J., Hwang L., Grosschedl R. (1993) Purification of early-B-cell factor and characterization of its DNA-binding specificity. Mol. Cell. Biol. 13, 3392–3400 [DOI] [PMC free article] [PubMed] [Google Scholar]
- 47. Karczewski K. J., Tatonetti N. P., Landt S. G., Yang X., Slifer T., Altman R. B., Snyder M. (2011) Cooperative transcription factor associations discovered using regulatory variation. Proc. Natl. Acad. Sci. U.S.A. 108, 13353–13358 [DOI] [PMC free article] [PubMed] [Google Scholar]