

Abstract
Proteins form a diverse array of complexes that mediate cellular function and regulation. A largely unexplored feature of such protein complexes is the selective participation of specific protein isoforms and/or post-translationally modified forms. In this study, we combined native size-exclusion chromatography (SEC) with high-throughput proteomic analysis to characterize soluble protein complexes isolated from human osteosarcoma (U2OS) cells. Using this approach, we have identified over 71,500 peptides and 1,600 phosphosites, corresponding to over 8,000 proteins, distributed across 40 SEC fractions. This represents >50% of the predicted U2OS cell proteome, identified with a mean peptide sequence coverage of 27% per protein. Three biological replicates were performed, allowing statistical evaluation of the data and demonstrating a high degree of reproducibility in the SEC fractionation procedure. Specific proteins were detected interacting with multiple independent complexes, as typified by the separation of distinct complexes for the MRFAP1-MORF4L1-MRGBP interaction network. The data also revealed protein isoforms and post-translational modifications that selectively associated with distinct subsets of protein complexes. Surprisingly, there was clear enrichment for specific Gene Ontology terms associated with differential size classes of protein complexes. This study demonstrates that combined SEC/MS analysis can be used for the system-wide annotation of protein complexes and to predict potential isoform-specific interactions. All of these SEC data on the native separation of protein complexes have been integrated within the Encyclopedia of Proteome Dynamics, an online, multidimensional data-sharing resource available to the community.
The majority of proteins function as part of multiprotein complexes and not as isolated polypeptides. These protein complexes range from simple homodimers to large structures composed of many different polypeptides. Protein complexes vary in their size and shape from small globular dimers, such as 14-3-3 proteins, to large elongated filaments of variable length, such as microtubules. The wide variety of possible protein–protein interactions within multiprotein complexes contributes to the diversity of functions that are involved in cellular processes and regulatory mechanisms.
Another important source of functional diversity and regulation is the large number of protein isoforms that may be generated from each gene. Functionally and structurally distinct isoforms can arise via multiple mechanisms, including alternative splicing, post-translational modification (PTM),1 and proteolytic cleavage. Distinct isoforms can exhibit radically different properties. For example, including or excluding individual exons can either create or remove protein–protein interaction interfaces for binding specific interaction partners. Similarly, phosphorylation, and other PTMs, can either create or remove binding sites for interacting proteins, substrates, or ligands. PTMs can also promote structural changes in proteins and affect catalytic activity.
The association of protein isoforms and post-translationally modified factors in multiprotein complexes can influence their subcellular location, activity, and substrate specificity. This can be dynamically regulated to modulate protein complex composition, and hence localization and function, to allow cells to respond to spatial and temporal stimuli. It is therefore important to characterize protein complexes at the level of the protein isoforms and post-translationally modified forms they contain in order to fully decipher the network of signaling and regulatory pathways within cells.
Although many types of protein complexes have been studied in detail, in-depth analysis of the composition, dynamics, and isoform association of protein complexes formed in either human cells or model organisms is still not well documented at a system-wide level. The CORUM database, compiled using a variety of information from the literature describing protein interactions and assemblies, currently provides the largest public dataset of protein complexes (1). CORUM contains information relating to ∼1,970 protein complexes identified in human cells. However, these complexes are formed from proteins encoded by only ∼16% of the known human protein-coding genes, indicating that many forms of protein complexes still remain to be identified and characterized (1). Furthermore, the CORUM database does not describe how the protein compositions of the complexes may vary, either dynamically or in different subcellular locations, or how this relates to protein isoforms and PTMs. This illustrates that there is still a major deficit in our knowledge of the structure and functions of cellular protein complexes and how they contribute to biological regulatory mechanisms.
The technique that is now most widely used to identify the components of protein complexes is affinity purification of an individual “bait” protein and subsequent analysis of the co-isolated proteins, usually via mass spectrometry (2). Affinity purification can use antibodies specific for an endogenous target protein (3, 4), if available, or, alternatively, can utilize a genetically constructed, epitope-tagged bait protein. The latter procedure is now widely used and is advantageous in that many different complexes can be compared using an identical antibody, or other affinity-purification method, targeted to the tag on the bait (for examples, see Refs. 5–7; for reviews, see Refs. 8 and 9). In contrast, it is harder to directly compare the results from immunoprecipitation of different endogenous protein complexes because each specific antibody that is used has different affinities and properties. Nonetheless, although epitope-tag “pull-down” techniques are now commonly used, they also have limitations. Not least, the addition of epitope tags to the bait can affect protein function and interactions (10, 11).
To help determine whether co-purifying proteins detected using pull-down strategies represent specific partner proteins in bona fide complexes or are nonspecific contaminants, we and others have developed quantitative approaches, for example, based on variations of the stable isotope labeling of amino acids in cell culture (12–16). Additional data analysis procedures, including the use of a “super experiment” database that predicts the likelihood of nonspecific protein interactions based on the frequency with which any given protein is co-purified across many separate experiments, can also help to define the composition of protein complexes (17). Nonetheless, affinity purification strategies have a limited ability to distinguish multiple related complexes that may differ with respect to isoforms and PTMs. They are also costly and difficult to implement for large-scale studies to survey cellular complexes, and thus not well suited to study variations in complexes under different cellular growth conditions and responses.
For system-wide studies of the composition and dynamics of protein complexes, alternative methods, in addition to immune-affinity purification, are required for convenient separation, characterization, and comparison of cellular protein complexes. To address this, a number of studies have utilized various forms of either column chromatography or native gel electrophoresis in combination with mass-spectrometry-based proteomics. For example, protein complexes have been separated using techniques including blue native polyacrylamide gel electrophoresis (18, 19), ion-exchange chromatography (20), and size-exclusion chromatography (21, 22) prior to MS analysis of proteins in the fractionated complexes. Size-exclusion chromatography (SEC) is a well-established technique used to separate proteins and protein complexes in solution on the basis of their shape/size (rotational cross-section) (23). SEC has been extensively used as an intermediate step in conventional multistep biochemical protein purification strategies. In contrast, SEC has been less commonly combined with mass-spectrometry-based proteomics for the high-throughput characterization of protein complexes. However, this has been demonstrated in previous studies that analyzed native protein complexes in plant chloroplasts (22) or large cytosolic complexes in mammalian cells (21).
In this study, we combined native SEC with high-throughput mass-spectrometry-based proteomic analysis to characterize soluble protein complexes isolated from human osteosarcoma cells. Herein we demonstrate the utility and reproducibility of this approach for the system-wide characterization of endogenous, untagged protein complexes and show how it can be used to identify specific protein isoforms and PTMs associated with distinct protein complexes. The resulting data are available to the community in a convenient format in the Encyclopedia of Proteome Dynamics (EPD) (www.peptracker.com/encyclopediaInformation/), a user-friendly, searchable online database.
EXPERIMENTAL PROCEDURES
Materials
U2OS cells were purchased from the American Type Culture Collection (Rockville, MD). Dulbecco's modified Eagle's medium (DMEM), fetal calf serum, antibiotics, NuPage gels, LDS sample buffer, MES SDS-PAGE running buffer, nitrocellulose iBlot stacks, SYPRO Ruby, Alexa Fluor 680-conjugated secondary antibodies, Dulbecco's phosphate-buffered saline (PBS), EZQ protein quantitation reagent, and a CBQCA assay kit were obtained from Invitrogen (Carlsbad, CA). IrDye 800-conjugated secondary antibodies were obtained from Rockland Immunochemicals (Gilbertsville, PA). Histone H3, NEDD8, and CUL3 primary antibodies and HRP conjugated secondary antibodies were from Cell Signaling Technology (Danvers, MA). Bicinchoninic acid (BCA) assay reagents, Coomassie Plus (Bradford) reagent, a Subcellular Protein Fractionation Kit, detergent removal plates, Acclaim Pepmap C18 columns and trapping cartridges, and triscarboxyethylphosphine (TCEP) (bond-breaker neutral pH solution) were from Thermo Scientific (Waltham, MA). Trypsin Gold was from Promega (Madison, WI). Sep-Pak tC18 96-well μ-elution plates were from Waters (Milford, MA). GAPDH primary antibody, complete protease inhibitor mixture tablets, and PhosStop phosphatase inhibitor tablets were from Roche (Basel, Switzerland). Odyssey nitrocellulose membrane was from Li-Cor Biosciences (Lincoln, NE). MRFAP1 primary antibody was from Proteintech Group (Chicago, IL). MORF4L1 primary antibody was from Santa Cruz Biotechnology Inc. (Dallas, TX). MLN4924 compound was a kind gift from Professor Sir Philip Cohen. PAF primary antibody was from Abcam (Cambridge, UK). MG132 was from Calbiochem-Novabiochem (Nottingham, UK). Ultrafree-MC centrifugal filter units were from Millipore (Billerica, MA). All other materials were obtained from Sigma (St. Louis, MO).
Cell Culture
Briefly, U2OS cells were grown in DMEM supplemented with 10% FCS, 100 U/l penicillin, and 100 μg/l streptomycin at 37 °C in 10% CO2 and passaged at ∼80% confluence. U2OS cells expressing LAP1-tagged MRFAP1 were grown in the same medium but with the addition of 150 μg/ml hygromycin B and 15 μg/ml blasticidine HCl.
GFP-IP from LAP1-MRFAP1 U2OS Cell Line
The cells for each condition were harvested separately via trypsinization, washed in PBS, and lysed in IP buffer (1% Nonidet P-40, 50 mm Tris-HCl, pH 7.4, 10% glycerol, 150 mm NaCl, complete protease inhibitor mixture (Roche Applied Science), PhosStop, 50 mm N-ethylmaleimide). The lysates were sonicated for 10 s at 10% power (three times in total) and then centrifuged for 10 min at 17,000g at 4 °C. Equal protein amounts of each sample were then combined with GFP-trap agarose beads from ChromoTek (Martinsried, Germany) that had been washed once in IP buffer (40 μl of 50% GFP-trap bead slurry per IP) and incubated for 2 h at 4 °C with rotation. The beads were then washed three times with IP buffer via centrifugation at 2,000g for 2 min at 4 °C. The beads were resuspended in 200 μl of PBS, transferred to a spin column (Thermo Scientific), and centrifuged dry at 500g for 1 min. LDS sample buffer that had been preheated to 65 °C was then added and incubated at 65 °C for 5 min. The eluate was collected via centrifugation at 500g for 1 min at room temperature.
Lysis of Cells for SEC
Ten 15-cm dishes (80% confluent) of U2OS cells were scraped, on ice, in 500 μl of ice-cold PBS containing Complete Protease Inhibitors EDTA-free (Roche) and PhosStop (Roche). Total cell lysates were sonicated for 10 s, three times in total, at 10% power at 4 °C and then centrifuged at 17,000g for 10 min at 4 °C. Samples were filtered through 0.45-μm Ultrafree-MC centrifugal filter units (Millipore). Bradford assays were performed on the filtrates for protein quantitation.
SEC, Trypsin Digestion, and Peptide Clean-up
Using a Dionex Ultimate 3000 HPLC system (Thermo Scientific), lysates in PBS and inhibitors were injected (200 μl per injection) onto a Superose 6 10/300GL column (GE Life Sciences) equilibrated with PBS (pH 7.2). The flow rate was 0.2 ml min−1, and 40 200-μl fractions were collected using a low protein binding 96-deep-well plate Eppendorf (Hamburg, Germany). Tris-HCl (1 m pH 8.0) was added to each fraction to a final concentration of 0.1 m to adjust the pH to 8.0, and trypsin diluted in 0.1 m Tris-HCl was added at ratios of 1:50 to 1:100. The fractions were then incubated for 18 h at 37 °C. For peptide desalting, trifluoroacetic acid (TFA) was added to a 1% (v/v) final concentration and peptides were purified using a Sep-Pak tC18 96-well μ-elution plate. Peptides were eluted in 200 μl of 50% (v/v) acetonitrile, 0.1% TFA, and a SpeedVac was used to dry them prior to resuspension in 5% (v/v) formic acid. Peptide concentrations were determined using the CBQCA assay after 25-fold dilution of peptide samples in 0.1 m borate buffer, pH 9.3.
Denaturing Size-exclusion Chromatography
For the denaturing SEC, cells were lysed in PBS containing inhibitors as above and supplemented with 4% SDS, 25 mm TCEP, and 50 mm N-ethylmaleimide. The column was equilibrated with 0.2% SDS, 100 mm NaCl, and 10 mm NaPO4. The lysate was otherwise injected onto the Superose 6 column as described above. Consecutive elution fractions were combined, heated to 65 °C for 10 min, subjected to chloroform methanol precipitation (24), and resuspended in 1X LDS with 25 mm TCEP for immunoblotting.
SDS-PAGE and Immunoblotting
For immunoblotting of non-denatured samples, Bradford protein quantitation assays were performed on the fractions. 20% SDS was added to each fraction to a 2% final concentration, and fractions were heated to 65 °C for 10 min. 100 μl of consecutive fractions were combined, and chloroform methanol precipitation was performed (24). Protein was then resuspended in equal volumes of 1X LDS, 25 mm TCEP so that the maximum concentration in the most concentrated fraction was 1 mg/ml and heated to 65°C for 10 min. Combined fractions were analyzed via EZQ quantitation assay (Invitrogen). 10 μl of each fraction was loaded per lane for SDS-PAGE. BCA protein quantitation (Thermo Scientific) was performed on denatured samples. Equal volumes (14 μl) of consecutive samples were combined and made up to a maximum of 0.1 mg/ml in 1X LDS/TCEP. 20 μl of sample was loaded per lane for SDS-PAGE. SDS-PAGE was performed using 4–12% (w/v) Bis-Tris NuPage gels using MES running buffer according to the manufacturer's instructions, but with the addition of 25 mm TCEP in the LDS sample buffer. SYPRO Ruby staining was performed as per the manufacturer's instructions (Invitrogen). For Western blotting, separated proteins were electrophoretically transferred to either an iBlot nitrocellulose membrane or an Odyssey nitrocellulose membrane, blocked with 3% nonfat milk in 0.1% Tween-20 in TBS, and incubated with primary antibody in 5% BSA in TBS Tween 20 overnight at 4 °C. After incubation, membranes were washed three times in TBS Tween 20 and incubated with either HRP-labeled or Alexa fluor 680/IrDye 800–labeled secondary antibodies in 3% nonfat milk in TBS Tween 20. Proteins were visualized using Immobillon chemiluminescent substrate (Millipore) and imaged with either a cooled charge-coupled device camera GE Life Sciences (Piscataway, NJ) for HRP-labeled secondary antibodies or a Licor Odyssey CLx imager for Alexa fluor 680/IrDye 800–labeled secondary antibodies.
LC-MS/MS and Analysis of Spectra
Using a Thermo Scientific Ultimate 3000 nanoHPLC system, 1 μg of peptides in 5% (v/v) formic acid (∼10 μl) was injected onto an Acclaim PepMap C18 nano-trap column Thermo Fisher Scientific (Waltham, MA). After being washed with 2% (v/v) acetonitrile, 0.1% (v/v) formic acid, peptides were resolved on a 150 mm × 75 μm Acclaim PepMap C18 reverse-phase analytical column over a gradient from 2% acetonitrile to 80% acetonitrile over 100 min with a flow rate of 300 nl min−1. The peptides were ionized by nano-electrospray ionization at 1.2 kV using a fused silica emitter with an internal diameter of 5 μm from New Objective (Woburn, MA). Tandem mass spectrometry analysis was carried out on an LTQ-Velos Orbitrap mass spectrometer (Thermo Scientific) using collision-induced dissociation fragmentation of precursor peptides and fragment ion measurement in the linear ion trap. The data-dependent acquisition method used was the FT10 protocol, described elsewhere (25). The RAW data produced by the mass spectrometer were analyzed using the quantitative proteomics software MaxQuant (26) (version 1.3.0.5). This version of MaxQuant includes an integrated search engine, Andromeda (27). The database supplied to the search engine for peptide identifications was the human UniProt database (June 7, 2011) containing 109,824 entries. The mass tolerance was set at 6 ppm for precursor ions, and the MS/MS mass tolerance was set at 0.5 Da. The enzyme was set as trypsin with up to two missed cleavages. Deamidation of Asn and Gln, oxidation of Met, pyro-Glu (with N-term Gln), and phosphorylation (STY) were set as variable modifications. N-ethylmaleimide on Cys was searched as a fixed modification. Identification was set to a false discovery rate of 1%. To achieve reliable identifications, all peptides identified were accepted based on the criteria that the number of hits in the “forward” database was at least 100-fold greater than the number of “reverse” database hits, thus resulting in a false discovery rate of less than 1%. The output from MaxQuant provided peptide level data as well as protein level data, grouped by protein isoforms.
Data Analysis
To create an elution profile for an individual protein isoform in each of the three replicates, the number of peptides observed in each fraction was summed to generate a count of peptides per fraction (spectral counts). The resulting spectral count profile minima and maxima were normalized within the limits of 0 and 1, respectively. The average of the three elution profiles was based on the normalized spectral peptide counts for each fraction. A minimum of two peptides were required for inclusion in our analysis. Further downstream data interpretation for this study was performed primarily using the R language (version 2.15.1). From the three biological replicates, it was required that a protein be identified in at least two replicates with a minimum of two peptides in each. Proteins labeled as either contaminants or reverse hits were removed from the analysis. These stringent criteria left a subset of 8,165 proteins with high data coverage across replicates (73.2%). For each protein, 120 quantitative measurements were recorded across the three replicates and 40 SEC fractions. The first six fractions were deemed to contain complexes outside the resolution range of the column and thus were excluded from further data analysis.
To analyze reproducibility between replicates, the peptide count profile across the remaining 34 fractions for each replicate was correlated between replicates. A quality filter was applied to ensure that a minimum of two out of the three pairwise correlations had a positive correlation coefficient. The biological replicates were collapsed by averaging to obtain a resultant mean peptide count profile describing the behavior of each protein across the 34 fractions. The standard deviation for the three biological replicates per fraction was also calculated to provide standard error bars on the protein profile graphs. The protein count profiles across the 34 fractions were normalized using the maximum peptide count for that protein and then hierarchically clustered based on Euclidean distance measurement and a “complete” agglomeration method. The output of the clustering has been presented in a heatmap using the RColorBrewer library.
The gene ontology analysis was carried out using the DAVID Functional Annotation Tool for Biological Processes (28). The full Homo sapiens proteome, supplied by DAVID, was selected as a background list. When cross-analyzing with the CORUM dataset, a set proportion of proteins in a complex were required to co-fractionate to provide sufficient evidence that a complex had been identified. To calculate this proportion, we used the equation max(0.3, 2/n) × 100, meaning 30% of the components or 2 divided by the number of proteins in the complex, whichever was greater, multiplied by 100. This approach ensured that for small complexes (i.e. containing six or fewer components), more than simply one or two of the component proteins needed to co-fractionate before we labeled the complex as identified.
RESULTS
Workflow for the Identification of Native Protein Complexes
To prepare lysates for the characterization of native protein complexes from human U2OS osteosarcoma cells, cellular lysis was performed by resuspending cells in PBS buffer containing protease and phosphatase inhibitors and then subjecting samples to sonication. PBS buffer provides a neutral pH and a physiological salt concentration that mildly solubilizes most protein complexes. No detergents were used to minimize the disruption of protein–protein interactions (Fig. 1). The resulting protein complexes were fractionated by size/shape using non-denaturing SEC. The eluate was collected in 40 sequential fractions of equal volume (Fig. 1). For proteomic analysis, the fractions were digested with trypsin, and then the peptides were desalted and analyzed via LC-MS/MS. Peptides were identified using MaxQuant (26) and quantified by the normalized spectral count in each fraction with standard parameters (see “Experimental Procedures”). Three biological replicates were performed and analyzed identically. In total, over 71,500 peptides, corresponding to over 8,100 proteins, were identified after the data had been filtered such that each protein was identified by at least two peptides in at least two out of the three biological replicates (supplemental Tables S1 and S2).
Fig. 1.

Native protein complex analysis using a comprehensive proteomics workflow. Workflow for SEC-based protein complex separation.
Protein standards were analyzed using our SEC method to identify the approximate molecular weight range across each fraction. These standards are ideal globular proteins and so provide a general size indication. However, SEC also separates proteins and their complexes by shape (rotational cross-section). Therefore, an elongated protein complex can appear larger than its true molecular weight. This aside, our analysis showed that overall this method separated protein complexes with estimated molecular weights ranging from ∼15 kDa to >1 MDa (Fig. 2A).
Fig. 2.

Characterization of protein complex separation. A, the UV chromatogram from one of the biological replicates indicates the profile of the U2OS total cell lysate as it eluted from the Superose 6 SEC column across 40 fractions. The retention time, measured in minutes, is represented on the x-axis. UV absorbance is represented on the y-axis. Protein standards of known molecular weights (thyroglobulin, ferritin, BSA, and RNase) were injected onto the same column, and their elution peaks were used to calculate approximate molecular weights for fractions. Proteins eluting in fractions 1–6 were termed the void. Complexes that eluted in fractions 7–23 were classed as “larger,” and those in fractions 24–40 were classed as “smaller.” B, SYPRO ruby total protein stain of proteins in the total cell lysate and consecutively combined fractions. 10 μg of protein were loaded in lane 2 (total), and a maximum of 10 μg of protein were loaded per lane for elution fractions.
The elution profile for each protein standard was used to calculate a predicted molecular weight range for each SEC fraction, from which we generated a linear regression model (supplemental Fig. S1). This model was then used to calculate the approximate observed molecular weight of all complexes/proteins identified in our dataset based on their peak elution fraction. The predicted molecular weights of all proteins identified through MS analysis were extracted from the UniProt database (29) and compared with the observed molecular weight, as estimated from the linear regression model, for the fractionation behavior of each protein (supplemental Fig. S2). The resulting scatter plot shows that most proteins were identified fractionating from SEC at an apparent molecular weight greater than the predicted molecular weights of individual proteins. This strongly supports our hypothesis that with cell extracts prepared using physiological buffer conditions and with SEC carried out using native conditions, the majority of proteins in the human proteome are detected in association with one or more complexes.
To evaluate whether our SEC method predominantly separated intact protein complexes, an analysis was carried out in which pairs of consecutive elution fractions were combined, resulting in 20 combined fractions in total. The pairwise combined fractions were further separated by molecular weight, using SDS-PAGE, and the resulting gel was stained for total protein (Fig. 2B). This showed that the earliest to middle fractions eluting from the SEC column (corresponding to larger complexes) contained proteins with very heterogeneous sizes, whereas fractions eluting progressively later (corresponding to smaller complexes) contained a greater proportion of proteins that migrated in SDS-PAGE close to their predicted molecular weight (Fig. 2B). This suggests that small complexes are less heterogeneous, as would be expected, and that monomeric proteins that do not form complexes are mostly found in these fractions. We also observed that the first three fractions (labeled “void”) included proteins that likely form complexes larger than the separation range of the SEC column (Fig. 2B).
As a control, we also analyzed lysates from U2OS cells prepared using a highly denaturing (4% SDS-containing) PBS buffer, which will disrupt essentially all non-covalent protein complexes. In this case there was a major shift in the elution profiles of most proteins from the SEC column relative to the previous analysis of lysates under native conditions. Even though denatured proteins in general will appear larger than their native forms because of the loss of their globular structure, this appears to have only a relatively small effect on elution behavior. When the highly denaturing lysate buffer was used, most proteins migrated at, or close to, their predicted molecular weight when injected into the same SEC column (supplemental Fig. S3). From these data we conclude that the native SEC analysis separates bona fide multiprotein complexes across a broad range of fractions.
Reproducibility of the SEC Elution Profiles
To determine the reproducibility of protein complex separation by SEC, we performed a pairwise comparison of the proteomic analysis of all proteins in each dataset across each of the three biological replicates (i.e. 1 versus 2, 2 versus 3, 1 versus 3). In each comparison a Pearson correlation coefficient was calculated to compare each normalized protein elution profile across the 40 SEC fractions. Each pairwise comparison is shown in a density plot that reveals a high correlation (>0.8) between the replicates for the majority of proteins (Fig. 3A). Most proteins demonstrated one or more peaks in their profile, as illustrated in the elution profiles for a representative group of proteins (Fig. 3B). We hypothesized that many of these peaks will correspond to the elution of proteins that are, at least in part, associated in complexes with other proteins that co-elute within that fraction.
Fig. 3.

Reproducibility of the SEC elution profiles. A, the Pearson correlation coefficient was calculated for the three biological replicates (replicate 1 versus replicate 2, replicate 1 versus replicate 3, and replicate 2 versus replicate 3). The relative protein density (y-axis) was plotted against the Pearson correlation coefficient for each replicate (x-axis). B, the SEC elution profiles for selected proteins are displayed as line graphs with the normalized peptide count (y-axis) plotted against each elution fraction (x-axis). Error bars indicate the standard deviation from the mean across three biological replicates. Below each line graph are immunoblots for each protein of interest. A total of 10 μg of protein was loaded in the “total” lane and up to a maximum of 10 μg of protein was loaded per lane for each of the fractions. The annotated molecular weights were estimated from the elution profiles of the protein standards injected onto the SEC column.
Many proteins showed complex elution profiles, as expected, because we were detecting within the cell lysate a combination of protein polymers, large and small complexes as well as monomeric proteins. To characterize further the separation of protein complexes by native SEC, we analyzed the co-fractionating proteins using the orthogonal technique of Western blotting. For this, the pairwise pooled SEC fractions, as described above, were separated via SDS-PAGE and immunoblotted to detect four representative proteins with different elution profiles displaying profile peaks in different fractions (Fig. 3B and supplemental Fig. S4). Regardless of whether the protein was a small ubiquitin-like modifier (NEDD8), a protein involved in large complexes (CUL3), a protein known to form either multimers (GAPDH) or extended polymers (tubulin), or a small DNA damage repair protein (PAF), we saw not only a close match within the MS replicate data (i.e. relatively small error bars), but also a close match between the MS data and the immunoblot profiles.
In summary, all of the data comparing the SEC fractionation of proteins by MS-based analysis and immunoblotting showed that the SEC approach was reproducible and demonstrated that both detection methods gave similar results that were in agreement with previously published information.
Analysis of Protein and Complex Coverage
To determine whether the resulting SEC protein dataset had any intrinsic bias for the preferential detection of either low or high copy number proteins, we compared our dataset with the CORUM database, which records known protein complexes (1). For this comparison we used previously published information reporting protein abundance levels in human cells (30). This showed that there is a wide distribution of copy numbers for proteins found in complexes reported in the CORUM database (Fig. 4A). The same comparison of protein copy numbers applied to our U2OS cell SEC dataset demonstrated a related distribution, but with more representation of the higher copy numbers per cell protein (Fig. 4B). A Wilcoxon–Mann–Whitney test used to compare both distributions gave a p value of 7.006 × 10⁻⁵, demonstrating a statistically significant difference, likely due in part to the increased representation of high copy number proteins in our dataset. Overall, our SEC dataset contained 1,464 out of the 2,713 human proteins reported in the CORUM database (i.e. 54%). The lower number of proteins in part reflects the fact that there are differences in the expressed proteomes between the U2OS cell line we used for this study and the multiple different cell lines used to generate the CORUM database. In addition, our SEC analysis involved the extraction of complexes using native conditions without detergent. Therefore, potentially, specific types of complexes, including membrane-associated and/or chromatin-associated proteins, may have been either underrepresented or absent. Despite this limitation in protein extraction efficiency, this study was still able to sample more than 50% of the proteins estimated to constitute the U2OS proteome (31).
Fig. 4.
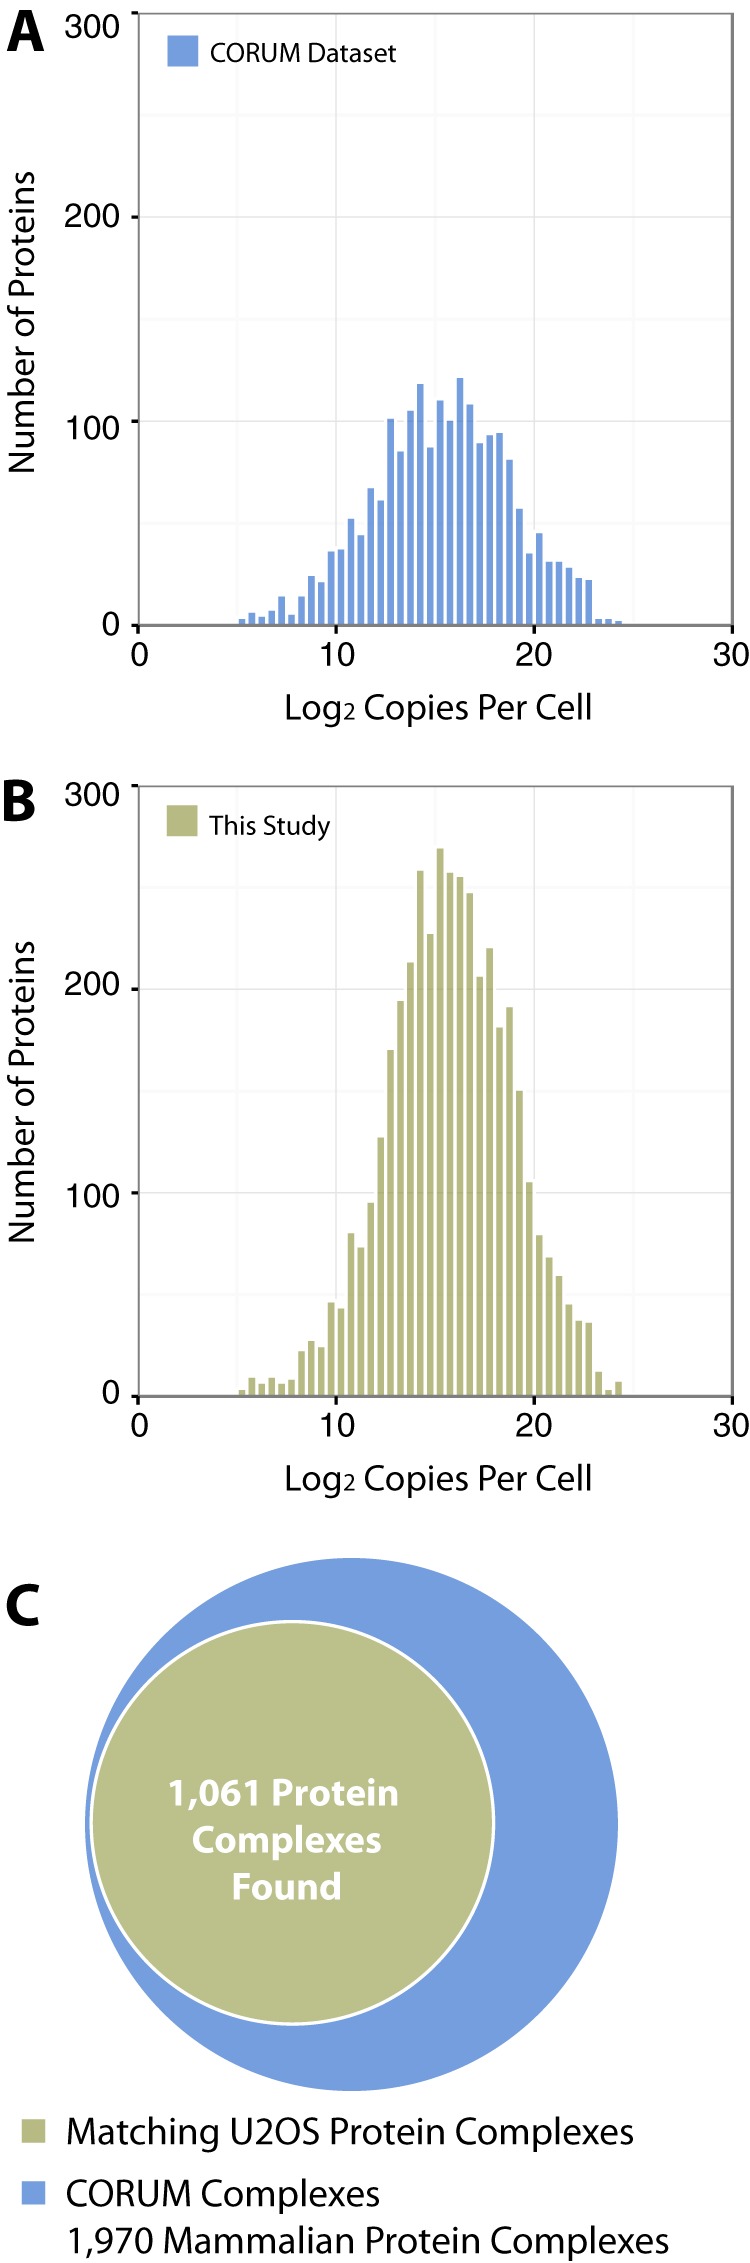
Comparison of SEC separated complexes with the CORUM database. A, protein copy numbers per cell reported in a previous study (30) were applied to our SEC dataset. The results are displayed as a histogram comparing the number of proteins (y-axis) and the log2 copies of that protein per cell (x-axis). B, the protein copy numbers per cell were also applied to the proteins listed in the CORUM database and displayed in the same format as in part A. C, the proportion of protein complexes found in our SEC dataset that were previously described in the CORUM dataset are presented as a Venn diagram.
To estimate how many of the complexes described in the CORUM database were identified in this study, we cross-correlated proteins that we observed co-fractionating in SEC with the complexes described in CORUM. Analysis of the CORUM dataset indicated that 74% of the annotated protein complexes contain only four components or less. Using this figure as a guide, we deemed a protein complex detected in our dataset if we identified a significant proportion of the components within one elution fraction. To ensure that our identifications were based upon suitably stringent criteria, we applied a variable cut-off for the number of components that had to be identified to reflect the total number of proteins in different types of complex. Thus, we defined a “significant proportion” as 50% or more of the components for smaller complexes with four or fewer subunits and at least 30% of the protein components for large complexes with five or more subunits (see “Experimental Procedures”). When these strict parameters were applied, our dataset identified 1,061 of the 1,970 complexes described in the CORUM database (54%) (Fig. 4C). As some of the CORUM complexes will likely not be expressed in U2OS cells, this represents a greater overall fraction of the protein complexes present in U2OS cells.
Comparative Analysis of Differentially Sized Complexes
For subsequent bioinformatics analysis, protein complexes were classified by size and deemed as either “larger” (fractions 7–23) or “smaller” (fractions 24–40) complexes using the cut-off between 130 and 440 kDa (Fig. 2A). To examine whether a bias in protein function was evident between the larger and smaller complexes, we compared the biological process gene ontology (GO) annotations (28) for the identified proteins that peaked in larger size fractions (1,720 proteins), smaller size fractions (2,280 proteins), or both size ranges (4,076 proteins) (Fig. 5A). The 10 most frequently associated GO terms for proteins in each of these size categories are shown. Proteins in larger complexes were primarily associated with the terms “cell division,” “chromosome organization,” “vesicle mediated transport,” and “ribonucleoprotein complex biogenesis” (Fig. 5C). In contrast, proteins in smaller complexes were mostly associated instead with the terms “oxidation reduction,” “coenzyme metabolic process,” “phosphate metabolic process,” and “hexose metabolic process” (Fig. 5D). Proteins that peaked in both the smaller and larger size classes were mainly associated with yet another set of terms, mostly related to gene expression and regulatory functions, including “RNA processing,” “cell cycle regulation,” and “splicing” (Fig. 5B). This unexpectedly revealed a clear relationship in the distribution of biological functions associated with protein complexes of different sizes. Thus, each size class had a distinct set of most frequently associated GO terms, while within each class the different GO terms predominantly reflected similar functions and/or processes.
Fig. 5.

Comparative analysis of higher and lower molecular weight complexes. A, the proportions of proteins identified in the SEC dataset that correspond to “larger complex proteins” (eluting in fractions 7–23) and “smaller complex proteins” (eluting in fractions 24–40) are presented as a Venn diagram. The overlap represents proteins that eluted in both larger and smaller complexes. B–D, bubble graphs demonstrating the top 10 gene ontology terms (biological process) (x-axis) plotted against the −log10(EASE score) for proteins eluting in both larger and smaller complexes, in larger complexes, and in smaller complexes, respectively.
Hierarchical Clustering of Protein Elution Profiles
The separation and characterization of native protein complexes across the SEC fractions were used to facilitate the identification of putative interacting proteins, because we expected proteins interacting within complexes to display similar elution profiles. To evaluate the clustering of protein elution profiles, we therefore performed hierarchical clustering across the 34 SEC fractions. To determine the number of protein clusters required, we tested the generation of 1 to 1,000 clusters using our SEC dataset (supplemental Fig. S5). For each cluster, the correlation coefficient for the proteins within that cluster was calculated to determine the optimum cluster size, based on the similarity of protein profiles (see “Experimental Procedures”). As shown in supplemental Fig. S5, generating 200 separate clusters from the SEC dataset provided an optimum classification—that is, it showed a high correlation coefficient (above 0.9) for each cluster while minimizing the subdivision of known protein complexes into separate clusters. We therefore used 200 protein clusters as the basis for further analysis.
Four examples of protein clusters were selected, including complexes separated across the SEC fractions, and these are indicated on the hierarchical clustering heat map (Fig. 6A, numbers 1–4). The protein components of each of these clusters were analyzed using the STRING database to identify either previously known protein–protein interactions or other relationships within the cluster (32, 33). Examination of proteins in example cluster 1 (green annotations) showed that it contained many components of the chaperonin containing TCP1 complex, a hetero-oligomeric complex ∼850 to 900 kDa in size (34). This correlates with the size range determined for the cognate elution fraction from the SEC column (Fig. 6B). In addition, elongation factor proteins that are known to interact also were present within this cluster, as were some lamins (Fig. 6B). Although these complexes showed their strongest elution peak around fraction 14, we were able to clearly differentiate them using a heat map and a hierarchical tree-based representation of the protein profiles (Fig. 6C). To further demonstrate this, we have plotted the elution profiles of each protein within example cluster 1 and highlighted the average protein profile of each labeled complex (Fig. 6D). This shows that small differences in the overall elution profile can be used to differentiate these separate complexes within the same cluster.
Fig. 6.

Hierarchical clustering of protein elution profiles. A, all 8,165 proteins were clustered on the basis of the similarity of their normalized elution profiles across 34 SEC fractions, and the results are presented as a heat map. The dendrogram cut-offs for 200 clusters are illustrated to the left of the heat map. The peak elution fraction for each of the protein standards was used to estimate the approximate molecular weight of proteins/complexes eluting within that specific fraction. Four example clusters are highlighted on the heat map. The key indicates the color attributed to the normalized peptide count. B, STRING interaction network for proteins identified in example cluster 1. C, higher resolution view of the heat map for example cluster 1. Individual complexes previously identified in the literature are highlighted in gray boxes. D, the elution profiles for all proteins identified in example cluster 1 are illustrated as gray lines with their normalized peptide count (y-axis) plotted against the SEC elution fraction number (x-axis). The average elution profiles for co-clustering proteins known to be in highlighted complexes are overlaid in the following colors: chaperonin containing TCP1 complex in red, elongation factor complex proteins in blue, and Lamins in green.
The components of the other example clusters highlighted (2–4) are illustrated in supplemental Fig. S6. Sample cluster 2 contained many components of the 80S ribosome, including proteins from both the large (60S) and small (40S) subunits. This cluster eluted from the column at a molecular weight above 670 kDa. The molecular weight of the intact ribosome is ∼4 MDa (35), which is outside the effective fractionation range of the SEC column used in this study. However, we may also detect large ribosome fragments and/or assembly intermediates of ribosome subunits with an approximate molecular weight of ∼1 to 2 MDa, which correlates with the observed peak in elution fraction 7 for cluster 2. Components of the eukaryotic initiation factor 3 complex were also identified within this cluster. As the STRING diagram illustrates, there are proposed interactions between the eukaryotic initiation factor 3 complex and the ribosome. This demonstrates that potentially interacting complexes can be identified within the same cluster. Components of the base unit of the 19S proteasome cap also eluted in this same cluster, demonstrating that, given the resolving capacity of the Superose 6 SEC column, multiple complexes can exist within one cluster. The 19S proteasome has a molecular weight of ∼900 kDa (36), which correlates with the approximate size for this cluster.
Example cluster 3 contained several groups of known interacting proteins, including components of the DNA synthesome complex. This is a multisubunit complex involved in DNA replication (37, 38) (supplemental Fig. S6, box 3). Example cluster 4 (supplemental Fig. S6, box 4) did not contain any known large protein complex networks based on STRING analysis. Within this group, only occasional pairs of interacting proteins were identified. This result was expected because the peak elution fraction for this cluster is between 15 and 67 kDa, where we find mostly free proteins and very small complexes. The absence of major networks in this cluster when analyzed by STRING therefore supports the relevance of the interactions detected in the clusters that eluted from the SEC column in fractions that we have shown contained proteins associated within complexes.
In summary, the cluster analysis performed on the four selected examples illustrates the utility of the SEC fractionation strategy for physically separating groups of proteins based upon their interactions.
Encyclopedia of Proteome Dynamics
To provide convenient community access to the large-scale, quantitative proteomics data generated in this study, we have incorporated the entire dataset into the EPD. This is a searchable online database that collates the proteomics data from this study on protein complexes with our previous large-scale studies on subcellular protein localization and turnover in a publicly available Web-based resource (39). The integration of the multidimensional proteomics data in the EPD allows cross-correlation and analysis of protein properties. For example, this can facilitate the identification of candidate interacting proteins. As shown below, it also aids analysis of the relation of protein isoforms and PTMs to specific complexes.
To demonstrate the utility of the multidimensional data integration provided by the EPD, we analyzed the characteristics of the relatively unstudied ADP-sugar pyrophosphatase NUDT5. First, analysis of the SEC protein fractionation data in this study showed that NUDT5 is detected in at least two distinct complexes that peak in separate fractions (Fig. 7A). The EPD provided convenient cross-comparison with other proteins that displayed an elution profile similar to that of NUDT5, as judged by hierarchical clustering, and these data are shown in a heat map (Fig. 7A). Second, the EPD showed that NUDT5 is detected predominantly in the cytoplasmic fraction (Fig. 7B), consistent with its role in nucleotide metabolism. This result is in agreement with data based on immunofluorescence microscopy in the Human Protein Atlas, a large-scale resource reporting protein localization in U2OS cells and other human cell lines (40, 41). Finally, the EPD showed that NUDT5 was not among the subset of proteins with a half-life of less than six hours in U2OS cells, similar to many other metabolic enzymes, as judged by cycloheximide experiments (Fig. 7C).
Fig. 7.

Computational analysis of large-scale experiments: the Encyclopedia of Proteome Dynamics (EPD). A, screenshot from the EPD demonstrating the elution profile of the NUDT5 protein and a heat map of co-clustering proteins. The EPD also provides information regarding the subcellular localization (B) and turnover rates (C) of proteins identified in previous large-scale experiments reported by the Lamond Laboratory. The EPD database is freely accessible online.
Together, these collected measurements of protein properties that are described in the EPD for each protein will help to either predict or disprove possible interactions and potential mechanisms of regulation that can be tested in future experiments. Further network analysis and examples of phosphorylation-dependent interactions for NUDT5 are illustrated below, and the EPD facilitates similar studies on the thousands of other human proteins described in this resource.
Analysis of Proteins in Multiple Complexes
Looking more closely at the heat maps for each of the 200 protein clusters derived from the SEC elution profiles, we observed that some clusters contained proteins that eluted in two or more distinct peaks across multiple fractions. The heat map shown in Fig. 8A illustrates one such cluster, which includes the MORF4L1 adaptor protein (red box). MORF4L1 is known to interact with multiple proteins, including a component of the NuA4 complex called MRGBP (42), PHD factor 1, a component of the Sin3A complex (43–46), and MRFAP1 (47, 48). This explains why it showed such a broad elution profile, with multiple peaks in different fractions (Fig. 8B). The previous pull-down and IP data describing interactions between these proteins, however, do not reveal in detail the degree of overlap between these different MORF4L1-containing complexes.
Fig. 8.
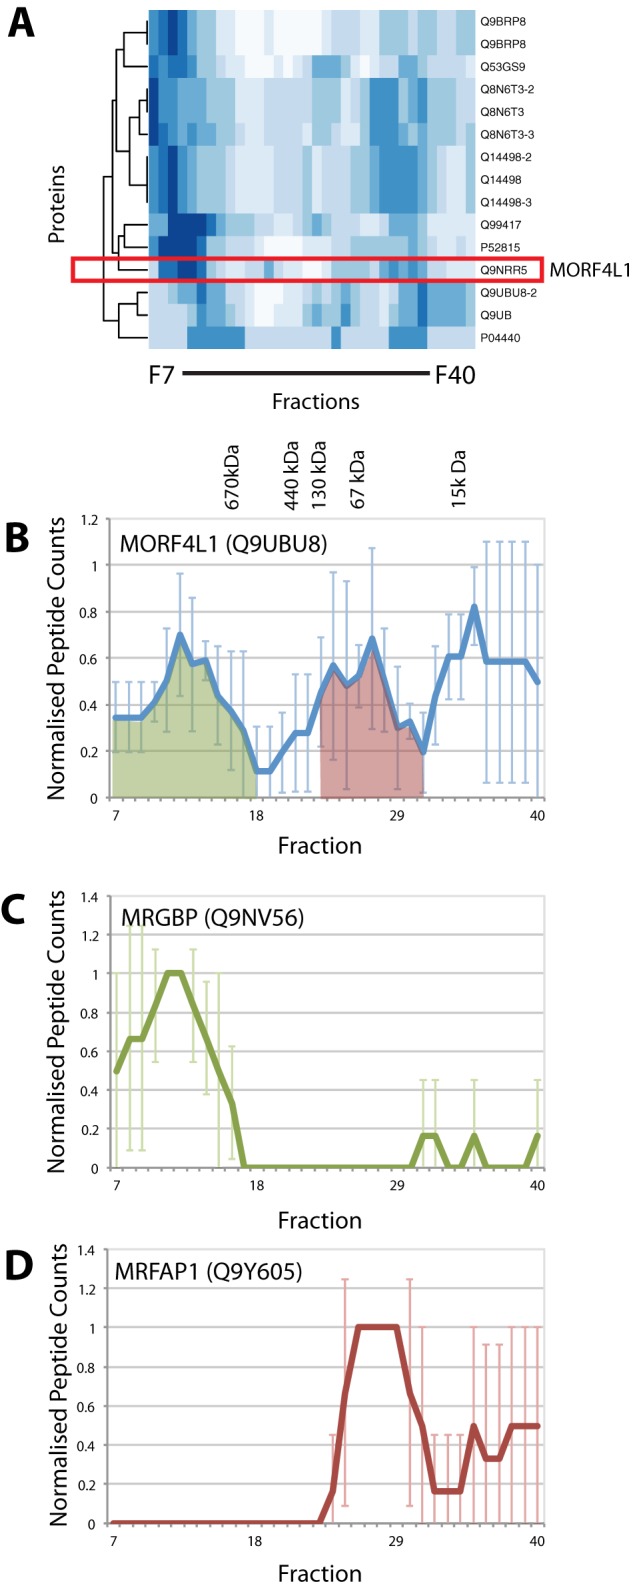
Analysis of proteins participating in multiple complexes. A, heat map for one cluster containing proteins with multiple elution peaks across 34 SEC fractions. The MORF4L1 protein is highlighted in the red box. The SEC elution profiles for MORF4L1 (B), MRGBP (C), and MRFAP1 (D) are shown as line graphs with normalized peptide counts (y-axis) plotted for each SEC fraction (x-axis). Peaks where MORF4L1 and MRGBP profiles overlap are shaded in green, and those where MORF4L1 and MRFAP1 overlap are in red. Error bars indicate the standard deviation from the mean.
To help dissect the MORF4L1 interactome further, we examined the elution profiles for the MORFL41 binding proteins MRGBP and MRFAP1. This demonstrated that these two proteins coincide with the MORF4L1 elution profile in distinct and nonoverlapping peaks at very different size ranges. The elution profile of MRGBP peaked in fraction 12 (Fig. 8C) at a molecular weight of >670 kDa, which correlates with previously published data on the size of the NuA4 complex (49). In contrast, the elution profile of MRFAP1 peaked exclusively in fractions 26–28, which corresponds to a molecular weight range between 15 and 67 kDa (Fig. 8D), with no peptides detected in the high molecular weight range. These data indicate the presence of at least two distinct complexes containing MORF4L1, of very different sizes and with mutually exclusive interactions with MRGBP or MRFAP1, respectively.
To complement the mass-spectrometry-based analysis, the pairs of combined SEC fractions were immunoblotted with antibodies specific for MORF4L1, MRGBP, and MRFAP1 (Fig. 9A). The results from the immunoblots closely correlated with the LC-MS/MS peptide data, although MRGBP was also detected in immunoblotted fractions 12 and 13. These bands likely represent monomeric MRGBP (37 kDa), as a complex containing MRFAP1, MORF4L1, and MRGBP would be predicted to elute in a higher molecular weight range. It was noted that MRFAP1 was not detected in fractions with a molecular weight above 67 kDa; therefore, it was unlikely that all three proteins formed a complex together. The SEC co-fractionation data are thus consistent with the existence of distinct MORF4L1 complexes containing either MRGBP or MRFAP1 as mutually exclusive interactive partners, as judged both by MS and immunoblotting analysis to detect the elution profiles of the respective proteins.
Fig. 9.
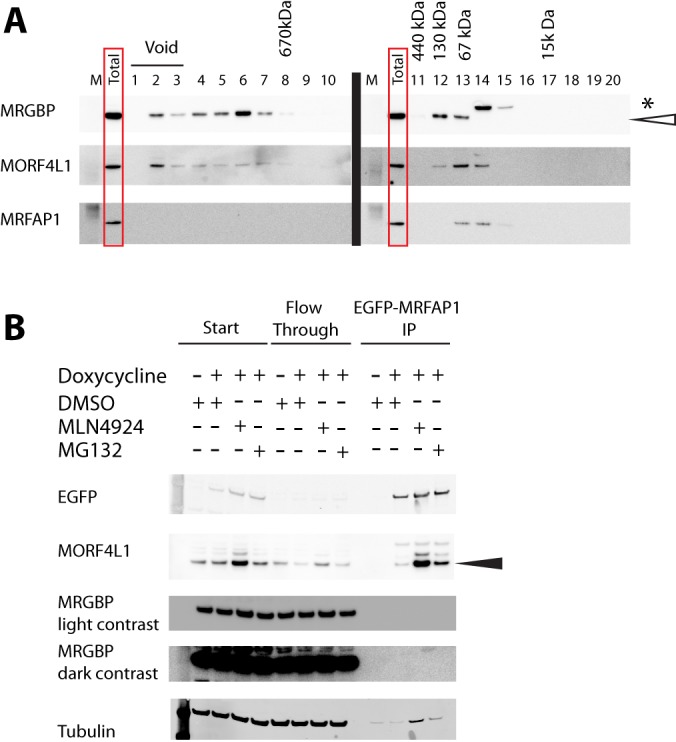
Confirmation of MORF4L1/MRGBP/MRFAP1 interactions. A, consecutive elution fractions were combined for immunoblotting. 10 μg of total protein was loaded in the lane labeled “total,” representing the material injected onto the SEC column. B, immunoblots for GFP-IP analysis of GFP-MRFAP1 cell line (n = 3). Cells were induced with doxycycline and treated with 1 μm MLN4924 for 16 h where indicated, 10 μm MG132 for 2 h where indicated, or dimethyl sulfoxide as a control. Solid arrow indicates the unmodified MORF4L1 protein band.
To test this further, we next performed IP experiments to examine whether MRGBP could be detected as a component that co-purifies in a pull-down assay with the MRFAP1–MORF4L1 complex. To do this, a stable cell line expressing wild-type, doxycycline-inducible LAP1-MRFAP1 (50) was utilized to co-immunoprecipitate proteins interacting with MRFAP1. The same immunoprecipitation assay was also performed on lysates from the same cells that had been treated with MLN4924 (1 μm for 16 h). MLN4924 is an inhibitor of NEDDylation that is known to increase the levels of MRFAP1 and MORF4L1 by reducing their degradation rates (50). In addition, the same IP assay was also performed on lysates from the same cells that had been treated with the proteasome inhibitor MG132 (10 μm for 2 h), which also increases MRFAP1 protein levels (50). Immunoblotting of these immunoprecipitates with an antibody raised against MORF4L1 confirmed that after doxycycline induction, MORF4L1 was recovered together with GFP-MRFAP1. It also showed that this co-purification was increased when cells had been treated with either MG132 or MLN4924 (Fig. 9B). In contrast, there were no specific MRGBP bands detected in these immunoprecipitates that could be detected using the MRGBP antibody. These data thus confirm the results from both the MS and protein blotting analyses of elution profiles in the SEC dataset.
Collectively, the data demonstrate that MRGBP–MORF4L1 and MRFAP1–MORF4L1 complexes represent distinct functional units containing mutually exclusive interaction partners. These data also validate the use of the native SEC approach to profile co-fractionation of proteins at a system-wide level and thus to predict the existence of distinct forms of protein complexes. Next, therefore, we extended our analysis of the SEC dataset to profile the association of specific protein isoforms and phosphorylated proteins with distinct forms of protein complexes.
Analysis of Protein Isoforms
Mass-spectrometry-based analysis enables the unbiased detection of many protein isoforms, such as those generated by pre-mRNA alternative splice site selection, proteolytic cleavage, or protein phosphorylation. We used the known isoform annotations for the proteins identified in this study to determine whether each isoform of a single protein displayed distinct SEC elution profiles. All of the protein isoforms identified in our dataset are included in the EPD and are available for analysis. This identified examples of specific protein isoforms that may participate in different protein complexes.
The first example is the alternative splicing of heterochromatin protein 1–binding protein 3 (HP1BP3). This protein is a component of heterochromatin and has been proposed to have a role in modulating chromatin structure and function (51). HP1BP3 is known to have four isoforms formed by alternative splicing, all of which were identified by up to 14 peptides spanning 26% (isoform 2) to 37% (isoform 5) of the expressed sequences of all four isoforms in our dataset (Fig. 10A; peptide locations are marked with asterisks). Closer analysis showed near-identical elution profiles for isoforms 1, 2, and 4 (Fig. 10B); isoform 3 alone was missing from a peak between fractions 22 and 30 (Fig. 10C). As none of the peptides were isoform specific, this discrepancy cannot be attributed to either low expression or poor sequence coverage.
Fig. 10.

Analysis of protein isoforms formed by alternative splicing. A, schematic of the four isoforms of the HP1BP3 protein. Asterisks indicate the location of identified peptides. SEC elution profiles for the canonical sequence and isoforms 2 and 5 (B) and the SEC elution profile for isoform 3 (C) are demonstrated as line graphs with the normalized peptide count (y-axis) plotted for each SEC fraction number (x-axis). Error bars denote the standard deviation from the mean.
Although little is known from the literature about the potential protein interaction partners of HP1BP3, based on our data, we predict that isoform 3 is absent from one or more protein complexes that may form with the other HP1BP3 isoforms in the molecular weight range from ∼30 kDa to ∼170 kDa. When the protein structures of the isoforms are compared, it is apparent that a region between positions 39 and 116 is missing in isoform 3 but is present in the other isoforms. We hypothesize that this region may be required for an interaction involved in forming the complex(es) that show an elution peak between fractions 22 and 30 (Fig. 10A). This will be an interesting point to pursue in the future as more information about this protein, and its isoforms, is uncovered.
In addition to protein isoforms generated by alternative splicing, we have also identified protein isoforms generated by post-translational proteolytic cleavage, such as in the NUP98 polyprotein. The NUP98 mRNA is translated into the NUP98-96 precursor protein, which is then cleaved to form the N-terminal NUP98 protein and the C-terminal NUP96 component as separate proteins (Fig. 11A) (52). The NUP98 pre-mRNA can also undergo alternative splicing to form only the NUP98 protein. The NUP98–96 precursor has six known isoforms, and isoforms 3 and 4 correspond to the NUP98 protein without NUP96.
Fig. 11.

Analysis of protein isoforms formed by proteolytic cleavage. A, schematic showing that the NUP98-NUP96 polyprotein is cleaved to form the separate proteins NUP98 and NUP96. B, NUP98 interacting proteins as proposed by the STRING database. C, average SEC elution profiles for peptides associated with specific regions corresponding to the NUP98 protein (orange profile) and the NUP96 protein (green profile). The line graphs represent the peptide count (y-axis) detected for each SEC fraction (x-axis). D, SEC elution profiles for RAE1 and NUP133 (x- and y-axes labeled as for part C). The gray boxes highlight fractions where we propose RAE1 and NUP98 interact and where NUP133 and NUP96 interact. Error bars indicate standard deviation from the mean.
In the second example analyzed, all six known isoforms of the NUP98 protein were identified in our dataset. Interestingly, isoforms 1, 2, 5, and 6 (corresponding to NUP96) showed elution profiles that clustered together, whereas isoforms 3 and 4 also clustered together, but with a different elution profile than the other isoforms. Fig. 11B shows the NUP98 interaction partners as identified by STRING. Fig. 11C shows the elution profiles for the NUP96/98 isoforms in our dataset. The profiles for isoforms 3 and 4 (NUP98) are illustrated in orange, and the green profile is that of the four isoforms for NUP96. From these profiles we conclude that protein–protein interactions involving NUP96 occur predominantly in fractions 8–17, whereas those specifically involving the N-terminal region (i.e. NUP98) occur predominantly in fractions 22–31.
We interrogated the SEC dataset for elution profiles of known NUP98 interaction partners and illustrate this here for some of these proteins (Fig. 11D). These elution profiles show that some reported interaction partners have peaks that overlap with the NUP96 component (i.e. SEC13, NUP107, NUP133, NUP160, NUP37, NUP43, and SEH1L), whereas RAE1 has a peak coinciding instead with the N-terminal NUP98 protein peak. This suggests that RAE1 may interact selectively with NUP98, but not with NUP96. These data indicate that the isoform groups corresponding to the respectively named NUP96 and NUP98 proteins are involved in forming distinct protein complexes. Our data also show a bias in detection sensitivity between NUP96 and NUP98 isoforms. We propose that this may have arisen in the native extracts examined because of the different solubility of the NUP98 protein, which is known to be tightly membrane associated, relative to the more soluble NUP96 protein.
Protein phosphorylation is known to affect many protein–protein interactions. The presence of the additional negative charge can increase affinity between interaction partners and thus generate new binding sites, or, alternatively, it can decrease affinity and thereby block interactions (53). We therefore searched our dataset for peptides showing phosphorylation at serine, threonine, or tyrosine residues and used this information to correlate with the elution profiles of the respective modified and unmodified forms of each protein (supplemental Table S3).
NUDT5 is a protein known to form a homodimer (54). It functions in cells to hydrolyze ADP-ribose and other similar molecules, such as 8-oxoGDP, which can be generated by nucleotide-damaging events (55). NUDT5 was detected in this dataset with 13 peptides, representing 64% sequence coverage spanning the full length of the protein (Fig. 12A). Using NUDT5 as an example, we observed that its elution profile had two main peaks, one in fraction 21 (molecular weight ∼ 440 kDa) and the other in fraction 28 (molecular weight ∼ 67 kDa) (Fig. 12B).
Fig. 12.

Comparison of unmodified and phosphorylated protein profiles. A, graphical representation of the peptides identified for the NUDT5 protein (shown in green). The letter “P” in the red circle denotes a phosphorylation site on the NUDT5 protein. B, the line graph illustrates the SEC elution profile for the NUDT5 unmodified protein. Error bars represent the standard deviation from the mean. The letter “P” in a red circle denotes a fraction containing the phosphorylated peptide (Ac-MEpSQEPTESSQNGK). C, a screen shot of these data presented in the Encyclopedia of Proteome Dynamics. Elution profiles show the normalized peptide count on the y-axis plotted against the SEC fraction on the x-axis.
Our dataset identified a peptide from NUDT5 with phosphorylation of serine 3 that was present in all three biological replicates. Whereas the remaining 12 NUDT5 peptides we identified were present in both peak fractions, including the unphosphorylated form of the serine-3-containing peptide, the serine 3 phosphorylated NUDT5 peptide was exclusively identified in fractions 27–29, corresponding to the second, lower molecular weight peak in the overall protein elution profile (Fig. 12B). Interestingly, this site is part of an S-Q phosphorylation motif recognized by the DNA damage responsive kinases ATM and ATR (56). These data suggest that the formation of one or more forms of protein complex containing NUDT5 may be regulated, at least in part, by the phosphorylation of serine 3. These phosphorylation-specific data are represented in the EPD with the detection of phosphopeptides for each protein highlighted on the elution profile of the entire protein based upon nonphosphorylated peptides (Fig. 12D).
In summary, the data above illustrate that the combined use of native SEC, MS-based peptide identification, and data analysis can identify candidate protein complexes involving selective interactions of specific protein isoforms and/or post-translationally modified protein forms.
DISCUSSION
In this study we used size exclusion chromatography combined with mass spectrometry in a quantitative proteomics strategy to provide a system-wide analysis of the diverse range of protein complexes formed in human cells. In particular, we have shown how this strategy can be used to annotate proteins with respect to their participation in complexes and to predict the formation of complexes involving specific protein isoforms and post-translationally modified forms. We provide here one of the largest concerted experimental surveys to date of native protein complexes, involving the detection and characterization of the SEC elution profiles for more than 71,600 peptides, corresponding to over 8,000 human proteins, and including the detection of many distinct isoforms and phosphorylation sites. Furthermore, the data are derived from three independent biological replicates, allowing statistical evaluation of the quality of the data during all downstream analyses.
Using hierarchical clustering, we identified proteins that co-elute with known components of protein complexes and thus may represent either previously unidentified interaction partners or entirely new complexes. Using these data, we have demonstrated examples of proteins that form multiple, separable complexes and confirmed these findings in detail for the MRFAP1, MORF4L1, and MRGBP protein interaction network. We have also confirmed, using multiple examples, that the conclusions derived from MS-based protein identifications are supported by parallel antibody-based protein detection using Western blots. To enable easy interrogation of these data and provide wide access to the community, the entire dataset has been integrated into our online searchable database, the EPD.
This study demonstrates the utility of the combined SEC-MS approach for the systematic characterization and annotation of protein complexes at a system-wide level. By comparing the results from independent biological replicates, we have shown that the methodology is reproducible and provides deep coverage of cellular protein complexes. For example, analysis of this dataset indicated that we identified in the native extracts from U2OS cells more than 50% of the total protein complexes for humans published in the CORUM database, which is compiled from a cumulative analysis of the published literature, including data derived from multiple cell types. Importantly, we have also demonstrated that different isoforms of a single protein can be detected, whether they are generated by alternative splicing, proteolytic cleavage, and/or post-translational modifications, and we have provided examples in which such isoforms are involved in distinct complexes and protein–protein interactions that can be differentiated and analyzed systematically. This provides a powerful tool for detecting and annotating protein complexes that augments other techniques commonly used to characterize protein complexes, including affinity pull-down methods and previously described SEC and ion-exchange chromatography methods. Furthermore, by combining these data in the EPD with our previous large-scale measurements of protein properties, such as subcellular localization and protein turnover rates, we have shown here how a Super Experiment approach (17) can be developed to provide a deep, multidimensional annotation of the human proteome.
Although we have demonstrated here the current feasibility of using a combined SEC-MS approach for identifying potential protein complexes and isoform and PTM-dependent interactions, there is considerable room for further technical improvements that will extend the resolution and sensitivity to detect lower abundance proteins and PTMs that are underrepresented using current technology. For example, recent and ongoing developments in mass spectrometry techniques and instrumentation have resulted in large increases in the sensitivity and resolution of proteome analyses, which we took advantage of in this study. Further improvements in both MS technology and the associated software for the analysis of raw MS data will undoubtedly continue and thereby enhance the number of proteins, isoforms, and PTMs that can be routinely detected across all of the SEC fractions. Furthermore, there is a clear opportunity to improve the resolution and size range of protein complex fractionation through future advances in SEC column technology and the advent of advanced ultra-high-performance liquid chromatography systems. Considering that even with the limitations of the resolution currently available with SEC, it is still possible to separate protein complexes at a level that is sufficient to derive a large amount of useful biological information, future improvements in SEC technology should make this approach substantially more powerful. For example, we anticipate that modifications in the design of SEC columns and improvements in silica matrices will result in improved resolution that will allow better separation of protein complexes such as the chaperonin containing TCP1 and elongation factor complexes shown in Fig. 6D. Potentially, this could also allow the effective separation of complexes up to the largest protein complexes present in cells, such as the nuclear pore complex at 45 MDa. Improvements in the algorithms used for the clustering of proteins and the in silico detection of their component peaks will also allow the identification of more potential protein–protein interactions, particularly for proteins present in more than one independent complex.
We and others have previously combined mass-spectrometry-based proteomics with cell fractionation to measure the subcellular localization of the proteome. For example, we have recently examined differences in protein isoform distributions and properties such as degradation rates between subcellular compartments and have evaluated how such properties are changed upon cell perturbations (39). Combining the SEC methodology with cellular fractionation strategies, drug treatments, and analyses of specific cell cycle stages will allow detailed insight into how the dynamics of protein complex formation is controlled in space and time. For example, in a recent study it has been shown that protein complexes in cytoplasmic extracts can be separated and characterized via SEC combined with mass spectrometry (21). This study combined the SEC approach with stable isotope labeling of amino acids in cell culture to analyze temporal protein complex changes following epidermal growth factor stimulation in cytoplasmic extracts of HeLa cells. Analysis of complexes can also be applied at the organelle level, using methods described for the proteomic analysis of organelles fractionated by means of sucrose gradients and/or differential centrifugation (57), prior to SEC and subsequent LC-MS/MS analysis.
When the different methods for studying protein complexes are compared, an advantage of SEC that is apparent is the ability to compare in parallel the complexes that are recovered using a variety of different buffer conditions. We elected to use a buffer containing no detergent and physiological levels of sodium chloride to maintain the integrity of native protein complexes. However, the buffer can be varied systematically, for example, to increase the salt concentration and/or include increasing levels of detergents, which will reveal the differential stabilities of different forms of complexes. In addition, the use of detergents to solubilize various membrane-associated complexes and protein subdomains could also be informative and may allow the recovery and identification of a greater proportion of the human proteome than is possible using native extraction conditions. In this regard it will also be interesting to explore the use of cross-linking agents in conjunction with SEC fractionation to improve the coverage of lower affinity complexes. The use of cross-linkers has recently been shown to improve the coverage of protein complex components in IP analyses (58).
Compared with other techniques for protein separation, SEC has the advantage of providing a relatively high capacity for total protein loading. In addition, as the proteins are in solution throughout the separation, the yield and efficiency of proteomics workflows is improved, and the need to perform in-gel enzyme digestions and subsequent ex-gel peptide isolation is avoided. Havugimana et al. used a combination of ion-exchange chromatography with four analytical column combinations, sucrose gradient centrifugation, and isoelectric focusing to analyze soluble protein complexes formed by 5,584 proteins in HeLa S3 and HEK293 cells (20). By combining SEC with one or more of these other forms of HPLC chromatography, the separation of different forms of complexes could be enhanced further. However, not all complexes will remain stable using methods that, for example, require higher salt treatments as part of the elution or separation procedure. An advantage of SEC is that separation can be performed throughout in defined native buffer conditions.
We are optimistic that future applications of the SEC technique will provide a framework for the system-wide comparison of protein complexes under a wide range of conditions and responses. This could include the analysis of complexes at different cell cycle stages or following cellular perturbations, including drug treatments, as well as comparisons of differences in protein complexes between cell and tissue types. Such systematic, high-throughput, system-wide comparisons of protein complexes under different conditions are simply not feasible with the current affinity-purification-based methods, not least because of the sheer complexity and associated cost of performing and analyzing many thousands of pull-downs under multiple experimental conditions. Another limitation is associated with overexpression of the tagged bait and the fact that such exogenous proteins are often co-expressed with the endogenous, untagged protein and have to compete for binding to partner proteins and for incorporation into complexes. This is particularly relevant in human cells and in model organisms in which convenient genetic strategies are not available for direct replacement at the original locus of the endogenous gene with a transgene encoding the tagged bait. We note that the SEC approach directly analyzes untagged, endogenous protein complexes and thus avoids the need to construct thousands of cell lines expressing tagged constructs in order to compare large numbers of cellular complexes.
Size exclusion chromatography allows the separation of individual proteins that participate in multiple complexes of different sizes and/or shapes. In this work we have highlighted analysis of the MORF4L1 adaptor protein, which is an example of a protein that is a component of several large complexes, including the NuA4 (59), Sin3A (44), and BRCA1-PALB2 complexes (60). The MRFAP1 protein was known to interact with MORF4L1 (61), but the resulting complex had not been characterized. In our SEC dataset, the elution profiles of the MORF4L1 and MRFAP1 proteins were seen to overlap only in the small size fractions. This showed that the interaction occurred in a small complex that was separable and clearly distinct from the larger MORF4L1-containing complexes mentioned above. We note that when analyzed via immunoaffinity purification, all of the MORF4L1 complexes and interaction partners co-purified together. In this case the use of SEC provided the size resolution and prefractionation of the separate forms of complexes necessary to help delineate differences in their protein compositions.
Through SEC analysis, three different types of protein isoforms were found to form isoform-specific interactions with distinct protein complexes. This was typified by the NUDT5 protein, which is a nucleotide pyrophosphatase that is known to hydrolyze a variety of substrates, including ADP-ribose, ADP-mannose, ADP-glucose, 8-oxo-GDP, and 8-oxo-dGDP. Interestingly, the substrates 8-oxo-dGDP and 8-oxo-GDP are produced following the actions of reactive oxygen species on nucleotides, and this can lead to either mutations in the genome or mistranslation of mRNA (62).
NUDT5 is a ∼25-kDa protein that is known to form a homodimeric structure. This corresponds with the estimated size of the NUDT5 peak with an elution maximum in fraction 28 from our SEC data, and this was the same peak where we detected NUDT5 to be phosphorylated at serine 3. This phosphosite in NUDT5 has also been identified previously. We note that this phosphorylation site on NUDT5 was identified as an ATM/ATR kinase substrate motif in a large-scale study using Phospho-ATM/ATR substrate (S*Q) immunoaffinity beads (56). Therefore, we propose that phosphorylation at this site may activate NUDT5 to hydrolyze damaged nucleotides. We also hypothesize that the separate peak, with maximum elution in fraction 20, corresponds to a form of NUDT5 that was further multimerized and/or interacting with additional partner proteins.
These data on NUDT5 serve to illustrate the potential for mining complex data within the EPD to generate predictions that can be used to design further experiments and investigate potential new regulatory mechanisms. We note that the analysis of the SEC data also underlines the importance of achieving high peptide sequence coverage when identifying proteins. High sequence coverage enhances our ability to discriminate between separate protein isoforms (63). This in turn allows us to identify examples of protein complexes that involve isoform-specific interactions, as illustrated here for HP1BP3.
An unexpected result of this study was the observation that there were systematic differences in the likely biological functions performed by proteins in different-sized complexes, as judged by the frequency of association of GO terms with proteins in either the larger or smaller classes of complexes. The finding that smaller complexes are generally enriched for terms associated with metabolic processes may signify that these proteins/complexes generally require fewer subunits for enzymatic function and regulation. For example, many metabolic reactions may generate a single product from a specific substrate, with the modification being made to the substrate often by one enzyme, albeit with multiple subunits. The resulting product can move to the next enzyme in the pathway by diffusion, without a requirement for any additional protein–protein interactions. In contrast, mechanistically complex biological processes, such as vesicle transport and steps in gene expression, may require many proteins to work together within large, integrated complexes, such as, for example, RNA polymerases and the exocyst and COG complexes. Other large complexes, such as the CUL3 E3 ligase complex, may also rely on larger numbers of protein components to mediate regulation of their function in response to temporal and/or spatial cues. In contrast, smaller enzymatic complexes involved in intermediary metabolism, such as dimeric GAPDH, can have their activity modulated by allosteric regulation. This may require fewer, if any, additional protein–protein interactions to facilitate substrate recognition or regulatory functions and hence integrate their activity with metabolic homeostasis.
In summary, this study provides a resource identifying soluble, native protein complexes in U2OS cells, separated on the basis of size and shape. This work incorporates data on protein isoforms and phosphorylation sites and statistical evaluation of independent biological replicates. We have grouped proteins with similar elution profiles into clusters, thereby identifying both well-defined and known complexes and novel potential protein interaction networks. The workflow described here can be used and extended in the future to aid the system-wide characterization of protein complexes and their dynamics in cells and tissues. The resulting information will be provided for the community in the online Encyclopedia of Proteome Dynamics, thereby enhancing the value of the protein complex data by making it easy to search, visualize, and analyze.
Supplementary Material
Acknowledgments
We thank Dr. Eric Griffis for useful discussions. K.K. is a Wellcome Trust Clinical Ph.D. Student. A.I.L. is a Wellcome Trust Principal Research Fellow.
Footnotes
Author contributions: K.K. and M.L. performed SEC experiments. K.K. performed the immunoblotting. Y.A. performed the statistical analysis and created the Encyclopedia of Proteome Dynamics. K.K., Y.A., M.L., and A.I.L. wrote the paper. A.I.L. mentored the project.
* This work was supported by grants from the Wellcome Trust (Grant Nos. 083524/Z/07/Z, 097945/B/11/Z, 073980/Z/03/Z, 08136/Z/03/Z, and 0909444/Z/09/Z), the EU FP7 Prospects network (Grant No. HEALTH-F4-2008-201648), EpiGeneSys network (Grant No. HEALTH-F4-2010-257082), and the BBSRC LoLa (Grant No. BB/K003801/1).
 This article contains supplemental material.
1 The abbreviations used are:
- EPD
- Encyclopedia of Proteome Dynamics
- GO
- gene ontology
- HP1BP3
- heterochromatin protein 1–binding protein 3
- IP
- immunoprecipitation
- LDS
- lithium dodecyl sulfate
- MORF4L1
- mortality factor 4-like protein 1
- MRFAP1
- MORF4 family-associated protein 1
- MRGBP
- MRG/MORF4L-binding protein
- PTM
- post-translational modification
- SEC
- size-exclusion chromatography
- TCEP
- triscarboxyethylphosphine.
REFERENCES
- 1. Ruepp A., Waegele B., Lechner M., Brauner B., Dunger-Kaltenbach I., Fobo G., Frishman G., Montrone C., Mewes H.-W. (2010) CORUM: the comprehensive resource of mammalian protein complexes—2009. Nucleic Acids Res. 38, D497–D501 [DOI] [PMC free article] [PubMed] [Google Scholar]
- 2. Dunham W. H., Mullin M., Gingras A.-C. (2012) Affinity-purification coupled to mass spectrometry: basic principles and strategies. Proteomics 12, 1576–1590 [DOI] [PubMed] [Google Scholar]
- 3. Malovannaya A., Li Y., Bulynko Y., Jung S. Y., Wang Y., Lanz R. B., O'Malley B. W., Qin J. (2010) Streamlined analysis schema for high-throughput identification of endogenous protein complexes. Proc. Natl. Acad. Sci. U.S.A. 107, 2431–2436 [DOI] [PMC free article] [PubMed] [Google Scholar]
- 4. Malovannaya A., Lanz R. B., Jung S. Y., Bulynko Y., Le N. T., Chan D. W., Ding C., Shi Y., Yucer N., Krenciute G., Kim B.-J., Li C., Chen R., Li W., Wang Y., O'Malley B. W., Qin J. (2011) Analysis of the human endogenous coregulator complexome. Cell 145, 787–799 [DOI] [PMC free article] [PubMed] [Google Scholar]
- 5. Ewing R. M., Chu P., Elisma F., Li H., Taylor P., Climie S., McBroom-Cerajewski L., Robinson M. D., O'Connor L., Li M., Taylor R., Dharsee M., Ho Y., Heilbut A., Moore L., Zhang S., Ornatsky O., Bukhman Y. V., Ethier M., Sheng Y., Vasilescu J., Abu-Farha M., Lambert J.-P., Duewel H. S., Stewart I. I., Kuehl B., Hogue K., Colwill K., Gladwish K., Muskat B., Kinach R., Adams S.-L., Moran M. F., Morin G. B., Topaloglou T., Figeys D. (2007) Large-scale mapping of human protein-protein interactions by mass spectrometry. Mol. Syst. Biol. 3, 89. [DOI] [PMC free article] [PubMed] [Google Scholar]
- 6. Ho Y., Gruhler A., Heilbut A., Bader G. D., Moore L., Adams S.-L., Millar A., Taylor P., Bennett K., Boutilier K., Yang L., Wolting C., Donaldson I., Schandorff S., Shewnarane J., Vo M., Taggart J., Goudreault M., Muskat B., Alfarano C., Dewar D., Lin Z., Michalickova K., Willems A. R., Sassi H., Nielsen P. A., Rasmussen K. J., Andersen J. R., Johansen L. E., Hansen L. H., Jespersen H., Podtelejnikov A., Nielsen E., Crawford J., Poulsen V., Sorensen B. D., Matthiesen J., Hendrickson R. C., Gleeson F., Pawson T., Moran M. F., Durocher D., Mann M., Hogue C. W. V., Figeys D., Tyers M. (2002) Systematic identification of protein complexes in Saccharomyces cerevisiae by mass spectrometry. Nature 415, 180–183 [DOI] [PubMed] [Google Scholar]
- 7. Gavin A.-C., Aloy P., Grandi P., Krause R., Boesche M., Marzioch M., Rau C., Jensen L. J., Bastuck S., Dumpelfeld B., Edelmann A., Heurtier M.-A., Hoffman V., Hoefert C., Klein K., Hudak M., Michon A.-M., Schelder M., Schirle M., Remor M., Rudi T., Hooper S., Bauer A., Bouwmeester T., Casari G., Drewes G., Neubauer G., Rick J. M., Kuster B., Bork P., Russell R. B., Superti-Furga G. (2006) Proteome survey reveals modularity of the yeast cell machinery. Nature 440, 631–636 [DOI] [PubMed] [Google Scholar]
- 8. Collins M. O., Choudhary J. S. (2008) Mapping multiprotein complexes by affinity purification and mass spectrometry. Curr. Opin. Biotech. 19, 324–330 [DOI] [PubMed] [Google Scholar]
- 9. Gingras A.-C., Gstaiger M., Raught B., Aebersold R. (2007) Analysis of protein complexes using mass spectrometry. Nat. Rev. Mol. Cell Biol. 8, 645–654 [DOI] [PubMed] [Google Scholar]
- 10. Goel A., Colcher D., Koo J.-S., Booth B. J. M., Pavlinkova G., Batra S. K. (2000) Relative position of the hexahistidine tag effects binding properties of a tumor-associated single-chain Fv construct. Biochim. Biophys. Acta 1523, 13–20 [DOI] [PubMed] [Google Scholar]
- 11. Rumlová M., Benedíková J., Cubínková R., Pichová I., Ruml T. (2001) Comparison of classical and affinity purification techniques of Mason-Pfizer monkey virus capsid protein: the alteration of the product by an affinity tag. Protein Expr. Purif. 23, 75–83 [DOI] [PubMed] [Google Scholar]
- 12. Ong S.-E., Blagoev B., Kratchmarova I., Kristensen D. B., Steen H., Pandey A., Mann M. (2002) Stable isotope labeling by amino acids in cell culture, SILAC, as a simple and accurate approach to expression proteomics. Mol. Cell. Proteomics 1, 376–386 [DOI] [PubMed] [Google Scholar]
- 13. Ong S.-E., Mann M. (2007) A practical recipe for stable isotope labeling by amino acids in cell culture (SILAC). Nat. Protoc. 1, 2650–2660 [DOI] [PubMed] [Google Scholar]
- 14. Hubner N. C., Bird A. W., Cox J., Splettstoesser B., Bandilla P., Poser I., Hyman A., Mann M. (2010) Quantitative proteomics combined with BAC TransgeneOmics reveals in vivo protein interactions. J. Cell Biol. 189, 739–754 [DOI] [PMC free article] [PubMed] [Google Scholar]
- 15. Trinkle-Mulcahy L., Boulon S., Lam Y. W., Urcia R., Boisvert F.-M., Vandermoere F., Morrice N. A., Swift S., Rothbauer U., Leonhardt H., Lamond A. (2008) Identifying specific protein interaction partners using quantitative mass spectrometry and bead proteomes. J. Cell Biol. 183, 223–239 [DOI] [PMC free article] [PubMed] [Google Scholar]
- 16. Trinkle-Mulcahy L., Andersen J., Lam Y. W., Moorhead G., Mann M., Lamond A. I. (2006) Repo-Man recruits PP1γ to chromatin and is essential for cell viability. J. Cell Biol. 172, 679–692 [DOI] [PMC free article] [PubMed] [Google Scholar]
- 17. Boulon S., Ahmad Y., Trinkle-Mulcahy L., Verheggen C., Cobley A., Gregor P., Bertrand E., Whitehorn M., Lamond A. I. (2010) Establishment of a protein frequency library and its application in the reliable identification of specific protein interaction partners. Mol. Cell. Proteomics 9, 861–879 [DOI] [PMC free article] [PubMed] [Google Scholar]
- 18. Heide H., Bleier L., Steger M., Ackermann J., Dröse S., Schwamb B., Zörnig M., Reichert A. S., Koch I., Wittig I., Brandt U. (2012) Complexome profiling identifies TMEM126B as a component of the mitochondrial complex I assembly complex. Cell Metab. 16, 538–549 [DOI] [PubMed] [Google Scholar]
- 19. Camacho-Carvajal M. M., Wollscheid B., Aebersold R., Steimle V., Schamel W. W. A. (2004) Two-dimensional blue native/SDS gel electrophoresis of multi-protein complexes from whole cellular lysates: a proteomics approach. Mol. Cell. Proteomics 3, 176–182 [DOI] [PubMed] [Google Scholar]
- 20. Havugimana P. C., Hart G. T., Nepusz T., Yang H., Turinsky A. L., Li Z., Wang P. I., Boutz D. R., Fong V., Phanse S., Babu M., Craig S. A., Hu P., Wan C., Vlasblom J., Dar V.-u.-N., Bezginov A., Clark G. W., Wu G. C., Wodak S. J., Tillier E. R. M., Paccanaro A., Marcotte E. M., Emili A. (2012) A census of human soluble protein complexes. Cell 150, 1068–1081 [DOI] [PMC free article] [PubMed] [Google Scholar]
- 21. Kristensen A. R., Gsponer J., Foster L. J. (2012) A high-throughput approach for measuring temporal changes in the interactome. Nat. Methods 9, 907–909 [DOI] [PMC free article] [PubMed] [Google Scholar]
- 22. Olinares P. D. B., Ponnala L., van Wijk K. J. (2010) Megadalton complexes in the chloroplast stroma of Arabidopsis thaliana characterized by size exclusion chromatography, mass spectrometry, and hierarchical clustering. Mol. Cell. Proteomics 9, 1594–1615 [DOI] [PMC free article] [PubMed] [Google Scholar]
- 23. Wheaton R. M., Bauman W. C. (1953) Non-ionic separations with ion exchange resins. Ann. N. Y. Acad. Sci. 57, 159–176 [DOI] [PubMed] [Google Scholar]
- 24. Wessel D., Flügge U. I. (1984) A method for the quantitative recovery of protein in dilute solution in the presence of detergents and lipids. Anal. Biochem. 138, 141–143 [DOI] [PubMed] [Google Scholar]
- 25. Haas W., Faherty B. K., Gerber S. A., Elias J. E., Beausoleil S. A., Bakalarski C. E., Li X., Villén J., Gygi S. P. (2006) Optimization and use of peptide mass measurement accuracy in shotgun proteomics. Mol. Cell. Proteomics 5, 1326–1337 [DOI] [PubMed] [Google Scholar]
- 26. Cox J., Mann M. (2008) MaxQuant enables high peptide identification rates, individualized p.p.b.-range mass accuracies and proteome-wide protein quantification. Nat. Biotechnol. 26, 1367–1372 [DOI] [PubMed] [Google Scholar]
- 27. Cox J. r., Neuhauser N., Michalski A., Scheltema R. A., Olsen J. V., Mann M. (2011) Andromeda: a peptide search engine integrated into the MaxQuant environment. J. Proteome Res. 10, 1794–1805 [DOI] [PubMed] [Google Scholar]
- 28. Huang D. W., Sherman B. T., Lempicki R. A. (2008) Systematic and integrative analysis of large gene lists using DAVID bioinformatics resources. Nat. Protoc. 4, 44–57 [DOI] [PubMed] [Google Scholar]
- 29. Consortium T. U. (2013) Update on activities at the Universal Protein Resource (UniProt) in 2013. Nucleic Acids Res. 41, D43–D47 [DOI] [PMC free article] [PubMed] [Google Scholar]
- 30. Nagaraj N., Wisniewski J. R., Geiger T., Cox J., Kircher M., Kelso J., Paabo S., Mann M. (2011) Deep proteome and transcriptome mapping of a human cancer cell line. Mol. Syst. Biol. 7, 548. [DOI] [PMC free article] [PubMed] [Google Scholar]
- 31. Geiger T., Wehner A., Schaab C., Cox J., Mann M. (2012) Comparative proteomic analysis of eleven common cell lines reveals ubiquitous but varying expression of most proteins. Mol. Cell. Proteomics 11, M111.014050. [DOI] [PMC free article] [PubMed] [Google Scholar]
- 32. Snel B., Lehmann G., Bork P., Huynen M. A. (2000) STRING: a web-server to retrieve and display the repeatedly occurring neighbourhood of a gene. Nucleic Acids Res. 28, 3442–3444 [DOI] [PMC free article] [PubMed] [Google Scholar]
- 33. Szklarczyk D., Franceschini A., Kuhn M., Simonovic M., Roth A., Minguez P., Doerks T., Stark M., Muller J., Bork P., Jensen L. J., Mering C. v. (2010) The STRING database in 2011: functional interaction networks of proteins, globally integrated and scored. Nucleic Acids Res. 39, D561–D568 [DOI] [PMC free article] [PubMed] [Google Scholar]
- 34. Leitner A., Joachimiak L. A., Bracher A., Mönkemeyer L., Walzthoeni T., Chen B., Pechmann S., Holmes S., Cong Y., Ma B., Ludtke S., Chiu W., Hartl F. U., Aebersold R., Frydman J. (2012) The molecular architecture of the eukaryotic chaperonin TRiC/CCT. Structure 20, 814–825 [DOI] [PMC free article] [PubMed] [Google Scholar]
- 35. Verschoor A., Srivastava S., Grassucci R., Frank J. (1996) Native 3D structure of eukaryotic 80s ribosome: morphological homology with E. coli 70S ribosome. J. Cell Biol. 133, 495–505 [DOI] [PMC free article] [PubMed] [Google Scholar]
- 36. Sharon M., Taverner T., Ambroggio X. I., Deshaies R. J., Robinson C. V. (2006) Structural organization of the 19S proteasome lid: insights from MS of intact complexes. PLoS Biol. 4, e267. [DOI] [PMC free article] [PubMed] [Google Scholar]
- 37. Coll J. M., Sekowski J. W., Hickey R. J., Schnaper L., Yue W., Brodie A. M., Uitto L., Syvaoja J. E., Malkas L. H. (1996) The human breast cell DNA synthesome: its purification from tumor tissue and cell culture. Oncol. Res. 8, 435–447 [PubMed] [Google Scholar]
- 38. Coll J. M., Hickey R. J., Cronkey E. A., Jiang H. Y., Schnaper L., Lee M. Y., Uitto L., Syvaoja J. E., Malkas L. H. (1997) Mapping specific protein-protein interactions within the core component of the breast cell DNA synthesome. Oncol. Res. 9, 629–639 [PubMed] [Google Scholar]
- 39. Larance M., Ahmad Y., Kirkwood K. J., Ly T., Lamond A. I. (2013) Global subcellular characterization of protein degradation using quantitative proteomics. Mol. Cell. Proteomics 12, 638–650 [DOI] [PMC free article] [PubMed] [Google Scholar]
- 40. Uhlén M., Björling E., Agaton C., Szigyarto C. A.-K., Amini B., Andersen E., Andersson A.-C., Angelidou P., Asplund A., Asplund C., Berglund L., Bergström K., Brumer H., Cerjan D., Ekström M., Elobeid A., Eriksson C., Fagerberg L., Falk R., Fall J., Forsberg M., Björklund M. G., Gumbel K., Halimi A., Hallin I., Hamsten C., Hansson M., Hedhammar M., Hercules G., Kampf C., Larsson K., Lindskog M., Lodewyckx W., Lund J., Lundeberg J., Magnusson K., Malm E., Nilsson P., Ödling J., Oksvold P., Olsson I., Öster E., Ottosson J., Paavilainen L., Persson A., Rimini R., Rockberg J., Runeson M., Sivertsson Å., Sköllermo A., Steen J., Stenvall M., Sterky F., Strömberg S., Sundberg M., Tegel H., Tourle S., Wahlund E., Waldén A., Wan J., Wernérus H., Westberg J., Wester K., Wrethagen U., Xu L. L., Hober S., Pontén F. (2005) A human protein atlas for normal and cancer tissues based on antibody proteomics. Mol. Cell. Proteomics 4, 1920–1932 [DOI] [PubMed] [Google Scholar]
- 41. Uhlen M., Oksvold P., Fagerberg L., Lundberg E., Jonasson K., Forsberg M., Zwahlen M., Kampf C., Wester K., Hober S., Wernerus H., Bjorling L., Ponten F. (2010) Towards a knowledge-based Human Protein Atlas. Nat. Biotechnol. 28, 1248–1250 [DOI] [PubMed] [Google Scholar]
- 42. Cai Y., Jin J., Tomomori-Sato C., Sato S., Sorokina I., Parmely T. J., Conaway R. C., Conaway J. W. (2003) Identification of new subunits of the multiprotein mammalian TRRAP/TIP60-containing histone acetyltransferase complex. J. Biol. Chem. 278, 42733–42736 [DOI] [PubMed] [Google Scholar]
- 43. Jelinic P., Pellegrino J., David G. (2011) A novel mammalian complex containing Sin3B mitigates histone acetylation and RNA polymerase II progression within transcribed loci. Mol. Cell. Biol. 31, 54–62 [DOI] [PMC free article] [PubMed] [Google Scholar]
- 44. Yochum G. S., Ayer D. E. (2002) Role for the mortality factors MORF4, MRGX, and MRG15 in transcriptional repression via associations with Pf1, mSin3A, and transducin-like enhancer of split. Mol. Cell. Biol. 22, 7868–7876 [DOI] [PMC free article] [PubMed] [Google Scholar]
- 45. Xie T., Graveline R., Kumar G. S., Zhang Y., Krishnan A., David G., Radhakrishnan I. (2012) Structural basis for molecular interactions involving MRG domains: implications in chromatin biology. Structure 20, 151–160 [DOI] [PMC free article] [PubMed] [Google Scholar]
- 46. Kumar G. S., Xie T., Zhang Y., Radhakrishnan I. (2011) Solution structure of the mSin3A PAH2–Pf1 SID1 complex: a Mad1/Mxd1-like interaction disrupted by MRG15 in the Rpd3S/Sin3S complex. J. Mol. Biol. 408, 987–1000 [DOI] [PMC free article] [PubMed] [Google Scholar]
- 47. Leung J. K., Berube N., Venable S., Ahmed S., Timchenko N., Pereira-Smith O. M. (2001) MRG15 activates the B-myb promoter through formation of a nuclear complex with the retinoblastoma protein and the novel protein PAM14. J. Biol. Chem. 276, 39171–39178 [DOI] [PubMed] [Google Scholar]
- 48. Zhang P., Zhao J., Wang B., Du J., Lu Y., Chen J., Ding J. (2006) The MRG domain of human MRG15 uses a shallow hydrophobic pocket to interact with the N-terminal region of PAM14. Protein Sci. 15, 2423–2434 [DOI] [PMC free article] [PubMed] [Google Scholar]
- 49. Allard S., Utley R. T., Savard J., Clarke A., Grant P., Brandl C. J., Pillus L., Workman J. L., Cote J. (1999) NuA4, an essential transcription adaptor/histone H4 acetyltransferase complex containing Esa1p and the ATM-related cofactor Tra1p. EMBO J. 18, 5108–5119 [DOI] [PMC free article] [PubMed] [Google Scholar]
- 50. Larance M., Kirkwood K. J., Xirodimas D. P., Lundberg E., Uhlen M., Lamond A. I. (2012) Characterization of MRFAP1 turnover and interactions downstream of the NEDD8 pathway. Mol. Cell. Proteomics 11, M111.014407. [DOI] [PMC free article] [PubMed] [Google Scholar]
- 51. Hayashihara K., Uchiyama S., Shimamoto S., Kobayashi S., Tomschik M., Wakamatsu H., No D., Sugahara H., Hori N., Noda M., Ohkubo T., Zlatanova J., Matsunaga S., Fukui K. (2010) The middle region of an HP1-binding protein, HP1-BP74, associates with linker DNA at the entry/exit site of nucleosomal DNA. J. Biol. Chem. 285, 6498–6507 [DOI] [PMC free article] [PubMed] [Google Scholar]
- 52. Fontoura B. M. A., Blobel G., Matunis M. J. (1999) A conserved biogenesis pathway for nucleoporins: proteolytic processing of a 186-kilodalton precursor cenerates Nup98 and the novel nucleoporin, Nup96. J. Cell Biol. 144, 1097–1112 [DOI] [PMC free article] [PubMed] [Google Scholar]
- 53. Nishi H., Hashimoto K., Panchenko A. R. (2011) Phosphorylation in protein-protein binding: effect on stability and function. Structure 19, 1807–1815 [DOI] [PMC free article] [PubMed] [Google Scholar]
- 54. Zha M., Zhong C., Peng Y., Hu H., Ding J. (2006) Crystal structures of human NUDT5 reveal insights into the structural basis of the substrate specificity. J. Mol. Biol. 364, 1021–1033 [DOI] [PubMed] [Google Scholar]
- 55. Ishibashi T., Hayakawa H., Sekiguchi M. (2003) A novel mechanism for preventing mutations caused by oxidation of guanine nucleotides. EMBO Rep. 4, 479–483 [DOI] [PMC free article] [PubMed] [Google Scholar]
- 56. Hornbeck P. V., Chabra I., Kornhauser J. M., Skrzypek E., Zhang B. (2004) PhosphoSite: a bioinformatics resource dedicated to physiological protein phosphorylation. Proteomics 4, 1551–1561 [DOI] [PubMed] [Google Scholar]
- 57. Gatto L., Vizcaíno J. A., Hermjakob H., Huber W., Lilley K. S. (2010) Organelle proteomics experimental designs and analysis. Proteomics 10, 3957–3969 [DOI] [PubMed] [Google Scholar]
- 58. Humphries J. D., Byron A., Bass M. D., Craig S. E., Pinney J. W., Knight D., Humphries M. J. (2009) Proteomic analysis of integrin-associated complexes identifies RCC2 as a dual regulator of Rac1 and Arf6. Sci. Signal. 2, ra51. [DOI] [PMC free article] [PubMed] [Google Scholar]
- 59. Doyon Y., Cote J. (2004) The highly conserved and multifunctional NuA4 HAT complex. Curr. Opin. Genet. Dev. 14, 147–154 [DOI] [PubMed] [Google Scholar]
- 60. Hayakawa T., Zhang F., Hayakawa N., Ohtani Y., Shinmyozu K., Nakayama J.-i., Andreassen P. R. (2010) MRG15 binds directly to PALB2 and stimulates homology-directed repair of chromosomal breaks. J. Cell Sci. 123, 1124–1130 [DOI] [PMC free article] [PubMed] [Google Scholar]
- 61. Tominaga K., Magee D. M., Matzuk M. M., Pereira-Smith O. M. (2004) PAM14, a novel MRG- and Rb-associated protein, is not required for development and T-cell function in mice. Mol. Cell. Biol. 24, 8366–8373 [DOI] [PMC free article] [PubMed] [Google Scholar]
- 62. Sekiguchi T., Ito R., Hayakawa H., Sekiguchi M. (2013) Elimination and utilization of oxidized guanine nucleotides in the synthesis of RNA and its precursors. J. Biol. Chem. 288, 8128–8135 [DOI] [PMC free article] [PubMed] [Google Scholar]
- 63. Ahmad Y., Boisvert F.-M., Lundberg E., Uhlen M., Lamond A. I. (2012) Systematic analysis of protein pools, isoforms, and modifications affecting turnover and subcellular localization. Mol. Cell. Proteomics 11, M111.013680. [DOI] [PMC free article] [PubMed] [Google Scholar]
Associated Data
This section collects any data citations, data availability statements, or supplementary materials included in this article.