Abstract
Objective
To study the relation between electronic health record (EHR) variables and healthcare process events.
Materials and methods
Lagged linear correlation was calculated between five healthcare process events and 84 EHR variables (24 clinical laboratory values and 60 clinical concepts extracted from clinical notes) in a 24-year database. The EHR variables were clustered for each healthcare process event and interpreted.
Results
Laboratory tests tended to cluster together and note concepts tended to cluster together. Within each of those two classes, the variables clustered into clinically sensible groupings. The exact groupings varied from healthcare process event to event, with the largest differences occurring between inpatient events and outpatient events.
Discussion
Unlike previously reported pairwise associations between variables, which highlighted correlations across the laboratory–clinical note divide, incorporating healthcare process events appeared to be sensitive to the manner in which the variables were collected.
Conclusion
We believe that it may be possible to exploit this sensitivity to help knowledge engineers select variables and correct for biases.
Keywords: Phenotype, Electronic Health Record, Data Mining
Introduction
The national push for electronic health records (EHR)1 should eventually lead to the documentation of approximately one billion patient visits per year in the USA and should represent a boon to observational research. One of the major challenges to reusing EHR data comes from the inaccuracy, incompleteness, complexity, and resulting bias inherent in the recording of the healthcare process.2 Therefore, EHR data cannot be treated simply as research data with noise and missing values; instead, the EHR carries systematic biases that must be addressed before the data can reach their potential.
The state of the art in generating phenotypes from EHR data is to use a heuristic, iterative approach.2 The Electronic Medical Records and Genomics (eMERGE) Network3 and the Observational Medical Outcomes Partnership (OMOP)4 provide two large-scale examples. For example, clinical experts may be enlisted to identify a subset of subjects relevant to a phenotype. A knowledge engineer then generates a heuristic rule that maps EHR data (such as physician notes, billing codes, and laboratory tests) to variables in the study. The rule is tested on the subset, and it is modified iteratively until sensitivity and specificity reach some threshold. The rule is eventually applied to the entire cohort. Unfortunately, these methods are themselves time consuming;5 there is much information that is not used, and knowledge engineers and clinical experts bring their own biases. The process can take months.
We believe that the path forward involves systemizing the phenotyping process with the hope of future automation or partial automation. We hope to understand better how the healthcare process affects the recording of clinical information in the EHR so that we can improve and perhaps speed the generation of phenotypes. This study is a first step in that process. We employ our existing techniques6 to measure lagged linear correlation to study the association between a number of EHR variables and five common healthcare process events: inpatient admission, inpatient discharge, outpatient visit, emergency department visit, and ambulatory surgery. We then cluster variables according to those associations, looking for groups of variables that behave similarly, hypothesizing that the groups will represent not only clinical and physiological properties but also characteristics related to the way the information is gathered and recorded.
Methods
We used the Columbia University Medical Center clinical data warehouse,7 which contains 24 years of data on 3.6 million patients. From this warehouse, we selected 24 laboratory tests and 60 clinical concepts derived from resident's signout notes to represent EHR variables (see supplement, available online only). Signout notes are used to transfer care to and from overnight shifts. There were 2 301 730 notes on 213 464 patients. The laboratory tests were all continuous and the concepts were represented as 1 if they were present in a note and 0 if they were absent from a note. We used simple regular expressions of stemmed concepts to detect the presence of the concepts in the notes. We had previously found6 in this particular corpus, resident signout notes, that performance in finding correlations was excellent despite ignoring negation and other modifiers. Based on a manual review of notes, we find that residents simply do not use negation frequently in the context of signing their service over; instead they state very concisely only what is present.
The tests and concepts were chosen as part of our previous publication.6 The laboratory tests were chosen because they were common. The concepts were chosen such that they were among the 250 most common diseases, symptoms, procedures, medications in the signout notes and such that we expected an association between the concept and the laboratory tests (eg, hyperkalemia) or expected no strong association (eg, atelectasis).
We selected five healthcare process events that are expected to be highly correlated with healthcare process effects: admission to the hospital, discharge from the hospital, emergency department visit, ambulatory visit, and ambulatory surgical procedure. For each variable–healthcare event pair (of which there are 84 times five of them), we calculated lagged linear correlation identically to our previous description.6 As before, we used linear interpolation to generate values between recorded time points so that we could get a correlation for two variables that do not have observations on the same days. We normalized the EHR variables within each patient by taking each patient's values for that variable, subtracting the mean and dividing by the SD. Patients with fewer than three values were dropped. We did not normalize the healthcare events (because it would be redundant). The effect is to remove inter-patient effects, leaving only the intra-patient effects so that each patient effectively acts as his own control.
We used lagged linear correlation as quantified by cross-covariance. Lagged linear correlation is a simple, robust, and commonly used technique that is highly related to power spectral analysis8 and is given by:
 |
1 |
| 2 |
where X and Y are time series, Xt and Yt are points at time t, τ is a lag (here in days), μX, μY, σX, and σY are the means and variances of X and Y, respectively, ρτ(X,Y) is linear correlation at lag τ, and ρ(X,Y) is the resulting correlation curve from −60 to +60 days. This method registers positive for positive correlation (both values are large and have the same sign) and negative for negative correlation (both values are large and have opposite signs). The lag captures how the correlation between the variables changes when the variables are moved in and out of synchronization with one another. This is explained in more detail in Koopmans8 and Stengel9 and in the healthcare context in Hripcsak et al.6 When choosing this method, the metric is predefined to be the Euclidean, least squares, or l2 metric.10 The outcome of this is a curve for each variable X (eg, glucose) relative to each healthcare context Y (eg, discharge, outpatient).
We then clustered the lagged linear correlation curves. While we believe that there is likely to be a great deal of information lurking in these curves, as a first step we clustered by similarity of curves. That is, we wanted curves that looked the same to be grouped together. Again, there are many methods (eg, k-means, spectral clustering, hierarchical clustering, standard classification, etc.) for decomposing this space, and each method is dependent both on a metric for specifying similarity and a characteristic or set of characteristics to cluster by.11 Because we want to understand how the different curves are related as a function of the distance between the lagged linear correlation curves, we imposed a similarity-dependent hierarchical structure that is agglomerative11 — meaning, we began with each observation (correlation curve) and merged the observations based on the distances between the curves.
To achieve this, we used an agglomerative hierarchical clustering scheme,11 or single linkage agglomerative clustering, executed via three steps. First, we calculated the ‘dissimilarity’ or distance between lagged linear correlation curves — we chose to specify distance to be the pairwise Euclidean distance between two lagged linear correlation curves, ρ(X,Y) and ρ(X′,Y′):
 |
3 |
where d is the dissimilarity between the curves. We quantified dissimilarity between clusters as the minimum Euclidean distance between member curves, resulting in single linkage.11 Given two clusters, Ci and Cj, the single-link distance, dSL, between clusters Ci and Cj, is given by:
| 4 |
where p and q are correlation curves ρ(X,Y) for some X and Y. Second, we clustered the curves. If we have N observations (lagged linear correlation curves) then we have N−1 steps where we merge the two most similar (least dissimilar) clusters; or, we agglomerate the two clusters that minimized over the remaining elements within the clusters. That is, at the kth step we agglomerate the two clusters, Ci and Cj of the remaining N−k clusters for which dSL is minimized. Third, we visualized the binary cluster tree using a dendrogram,12 in which the link denoting where the group is joined is the dSL. We also repeated the analysis using average linkage11 instead of single linkage to see if the clustering was sensitive to the linkage method.
Results
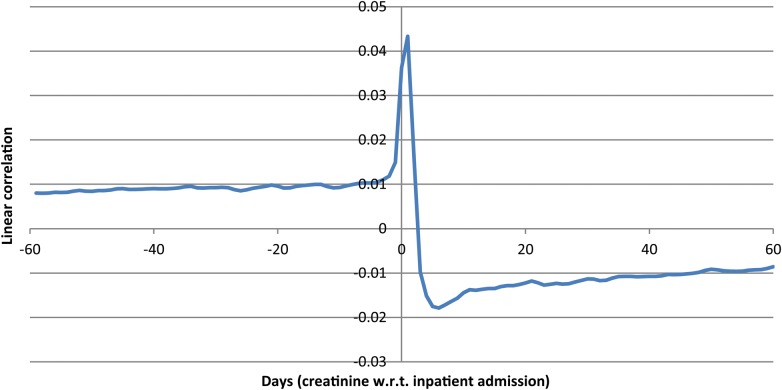
We first show a sample lagged linear correlation curve. Figure 1 shows the curve for intravascular creatinine with respect to inpatient admission.
Figure 1.
Lagged linear correlation curve for intravascular creatinine versus inpatient admission. Left of 0 days implies that a change in creatinine preceded the admission. Points above 0 are positively correlated. The curve indicates that patients tend to have higher creatinine leading up to the admission (perhaps as part of their disease state), that their creatinine peaks around admission (perhaps with the acute illness), and falls after admission (perhaps due to treatment and recovery).
To illustrate the clusters better, we first plotted the laboratory tests alone. Figure 2 shows the clusters of laboratory values based on their lagged linear correlation with inpatient admission. We see mostly logical groupings of variables, with groups of coagulation studies (partial thromboplastin time (PTT), prothrombin time (PT), and international normalized ratio (INR)), hematological studies (red blood cell count, hemoglobin, hematocrit), renal studies (urea nitrogen, creatinine), and liver and gastrointestinal studies (amylase, lipase, bilirubin, alanine aminotransferase, aspartate aminotransferase). In some cases the tests are naturally ordered together and track each other (hemoglobin and calculated hematocrit being an extreme example). While in many cases the tests are performed together in a battery (eg, red blood cell count, hemoglobin, hematocrit) in other cases they are not necessarily ordered together (eg, PTT, PT, INR). Similar clusters are found for inpatient discharge events (see supplement, available online only).
Figure 2.
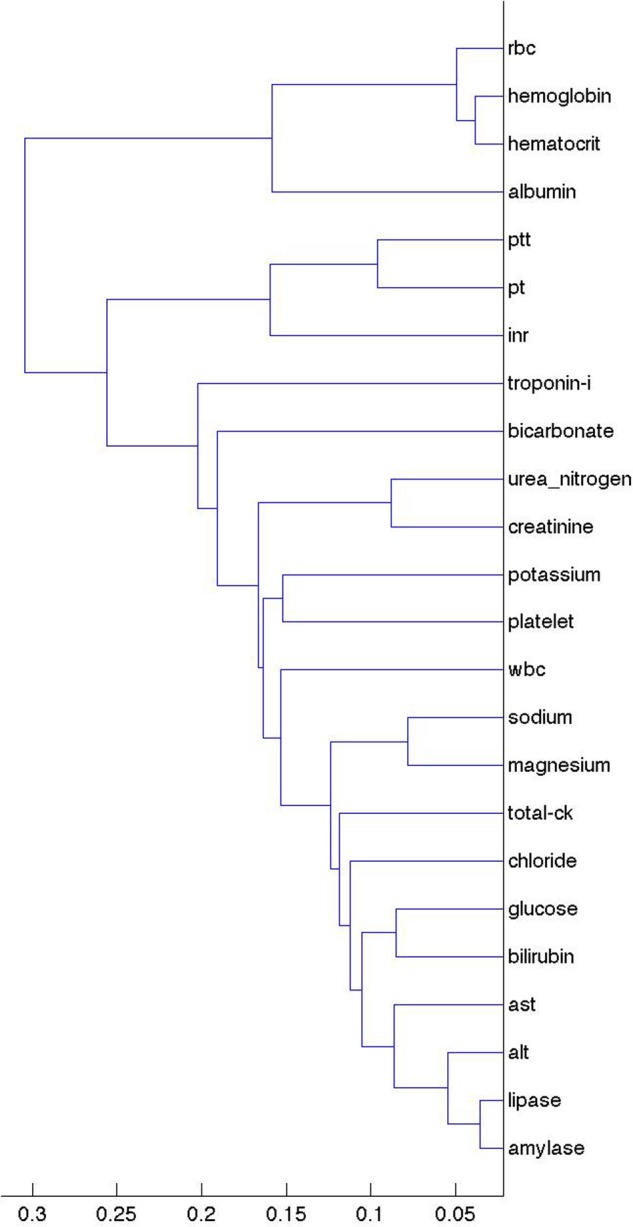
Clustering of laboratory values based on their lagged linear correlations with inpatient admission events. The x-axis shows the unitless single-link distance, with length of the horizontal line in the dentrogram representing the distance between the connected clusters. We see mostly logical groupings of variables, with groups of coagulation studies (INR, international normalized ratio; PT, prothrombin time; PTT, partial thromboplastin time), hematological studies (RBC, red blood cell count; hemoglobin, hematocrit), renal studies (urea nitrogen, creatinine), and liver and gastrointestinal studies (ALT, alanine aminotransferase; AST, aspartate aminotransferase; amylase, lipase, bilirubin). CK, creatine kinase; WBC, white blood cell.
Figure 3 shows the clusters for ambulatory surgery events. Note the change in the clusters, with PTT and INR still close but with PT in the distance. One might expect INR and PT to remain close because they are the same test other than the fact that the former is normalized, whereas PTT measures a different coagulation pathway. The clusters may therefore have more to do with physician ordering patterns (both what is ordered together and how the ordering of tests evolves over time) than with actual values. Outpatient visits and emergency department visits (see supplement, available online only) led to similar clusters to ambulatory surgery, perhaps implying that the major division is between inpatient events (admission and discharge) and outpatient events (ambulatory surgery, outpatient visits, emergency department).
Figure 3.
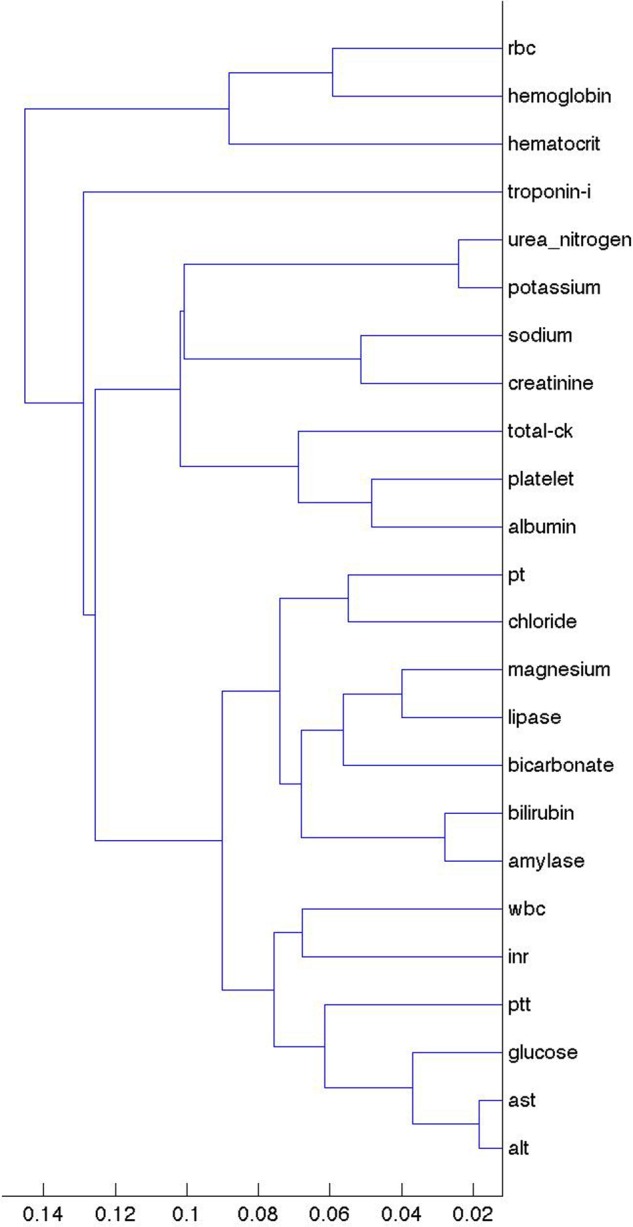
Clustering of laboratory values based on their lagged linear correlations with ambulatory surgery events. The x-axis shows the unitless single-link distance, with length of the horizontal line in the dentrogram representing the distance between the connected clusters. Compared to figure 2, note the change in the clusters, with partial thromboplastin time (PTT), and international normalized ratio (INR) still close but with prothrombin time (PT) in the distance. ALT, alanine aminotransferase; AST, aspartate aminotransferase; CK, creatine kinase; RBC, red blood cell; WBC, white blood cell.
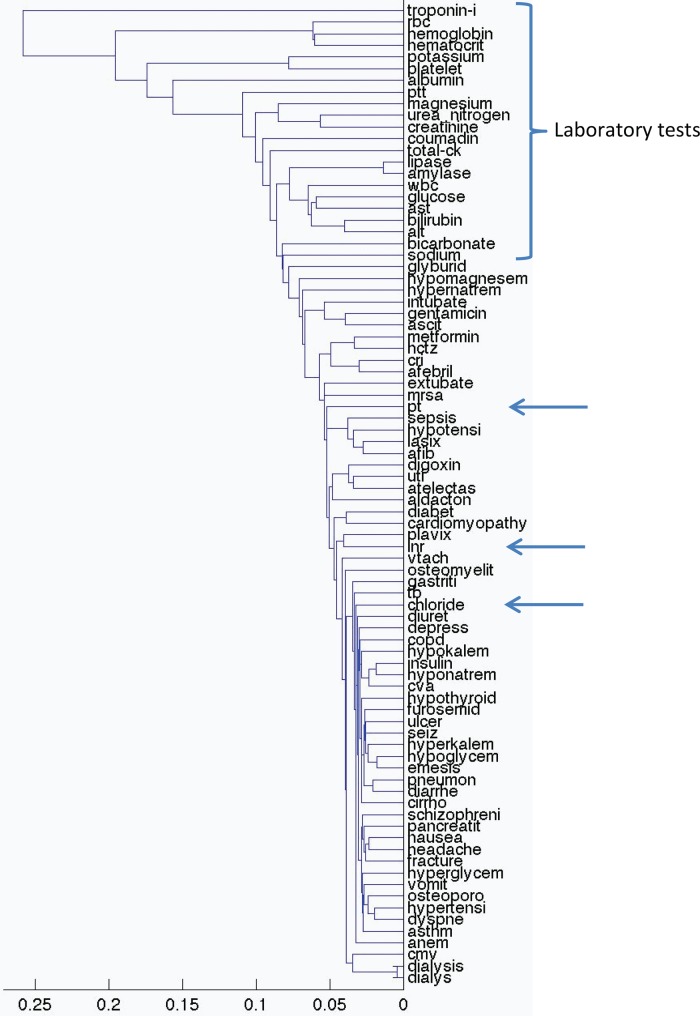
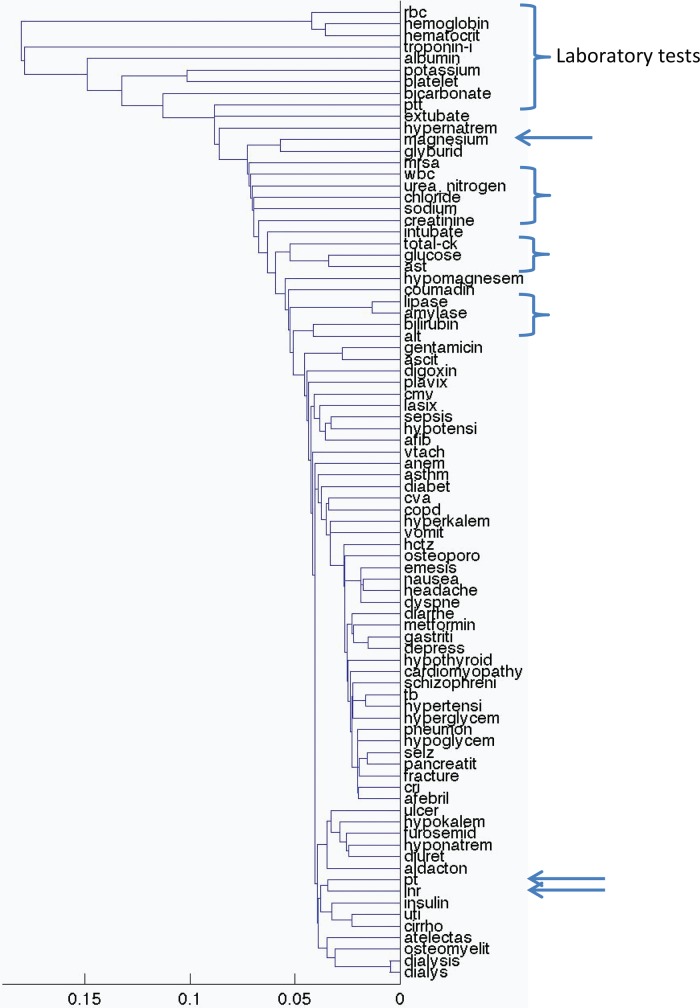
We then plotted all 84 variables. Figure 4 shows the clusters for all note concepts and laboratory values based on inpatient discharge events. Laboratory values tend to cluster together and note concepts tend to cluster together. There are some exceptions, with PT and INR both clustering away from the other laboratory variables. Within data type, clinical clustering begins to appear. For example, ulcer, emesis, diarrhea, cirrhosis, pancreatitis, nausea, and vomiting appear near each other, as do hypotension, lasix, atrial fibrillation (AFIB), and digoxin. Figure 5 shows the clusters for emergency department events. Outpatient visit events are similar (see supplement, available online only). Clustering using average linkage instead of single linkage led to essentially identical clusters, with figures 2 to 5 looking almost identical and changing none of the highlighted examples.
Figure 4.
Clustering of concepts and laboratory values based on their lagged linear correlations with inpatient discharge events. The x-axis shows the unitless single-link distance, with length of the horizontal line in the dentrogram representing the distance between the connected clusters. Laboratory values tend to cluster together (bracket) and note concepts tend to cluster together, although prothrombin time (PT), international normalized ratio (INR), and chloride (at arrows) cluster away from the other laboratory variables. Within data type, ulcer, emesis, diarrhea, cirrhosis, pancreatitis, nausea, and vomiting appear near each other, as do hypotension, lasix, atrial fibrillation (AFIB), and digoxin. afib, atrial fibrillation; alt, alanine aminotransferase; ast, aspartate aminotransferase; ck, creatine kinase; cmv, cytomegalovirus; copd, chronic obstructive pulmonary disease; cri, chronic renal insufficiency; cva, cerebrovascular accident; hctz, hydrochlorothiazide; inr, international normalized ratio; mrsa, methicillin-resistant Staphylococcus aureus; pt, prothrombin time; ptt, partial thromboplastin time; rbc, red blood cells; tb, tuberculosis; uti, urinary tract infection; vtach, ventricular tachycardia; wbc, white blood cells.
Figure 5.
Clustering of concepts and laboratory values based on their lagged linear correlations with emergency department events. The x-axis shows the unitless single-link distance, with length of the horizontal line in the dentrogram representing the distance between the connected clusters. Compared to figure 4, the laboratory results are further dispersed (brackets and arrows). afib, atrial fibrillation; alt, alanine aminotransferase; ast, aspartate aminotransferase; ck, creatine kinase; cmv, cytomegalovirus; copd, chronic obstructive pulmonary disease; cri, chronic renal insufficiency; cva, cerebrovascular accident; hctz, hydrochlorothiazide; inr, international normalized ratio; mrsa, methicillin-resistant Staphylococcus aureus; pt, prothrombin time; ptt, partial thromboplastin time; rbc, red blood cells; tb, tuberculosis; uti, urinary tract infection; vtach, ventricular tachycardia; wbc, white blood cells.
We then show the lagged linear correlation profiles for representative pairs of variables. Figure 6 shows PTT and INR, which is a pair that is non-trivial (the tests are not identical and not always ordered together) but that cluster together in all five healthcare event contexts. Figure 7 shows the nausea and vomiting note concepts, which should be medically related. Figure 8 shows a limitation of our clustering technique. Hemoglobin laboratory test and the anemia note concept are medically related but are not clustered together. Manual review of the graphs shows that they in fact do match to some degree but their signs are reversed: a drop in hemoglobin corresponds to an increase in anemia.
Figure 6.
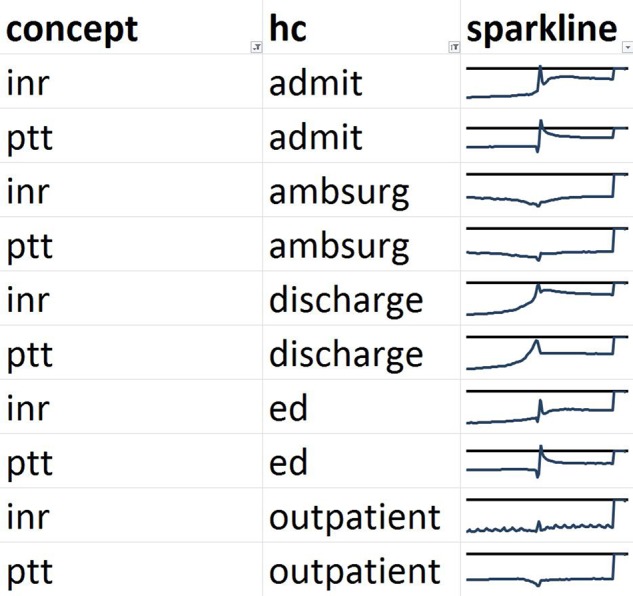
Comparison of profiles of lagged linear correlation with five healthcare (HC) events for partial thromboplastin time (PTT) and international normalized ratio (INR). Each graph shows the lagged linear correlation curve for a concept–healthcare event pair. In each graph, the horizontal axis covers –60 to +60 days with 0 days at the midpoint, and the horizontal line represents a correlation of zero with positive correlation above the line. The profiles are well matched for INR and PTT. ED, emergency department.
Figure 7.
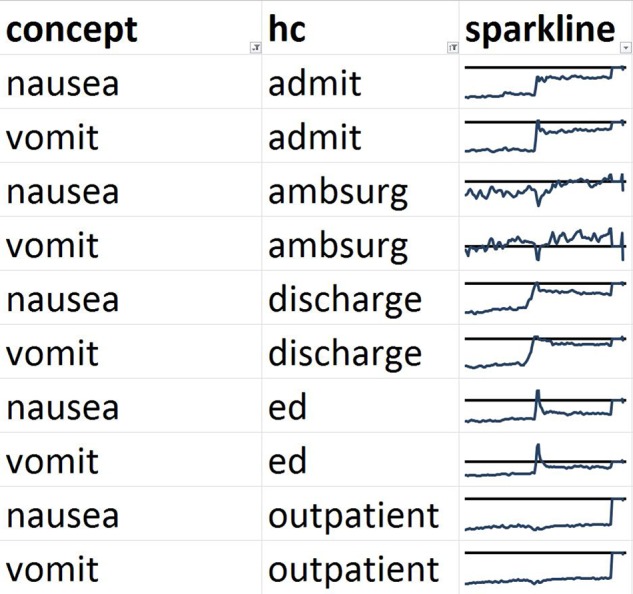
Comparison of profiles of lagged linear correlation with five healthcare (HC) events for nausea and vomiting. Each graph shows the lagged linear correlation curve for a concept–healthcare event pair. In each graph, the horizontal axis covers –60 to +60 days with 0 days at the midpoint, and the horizontal line represents a correlation of zero with positive correlation above the line. The profiles are well matched for nausea and vomiting. ED, emergency department.
Figure 8.
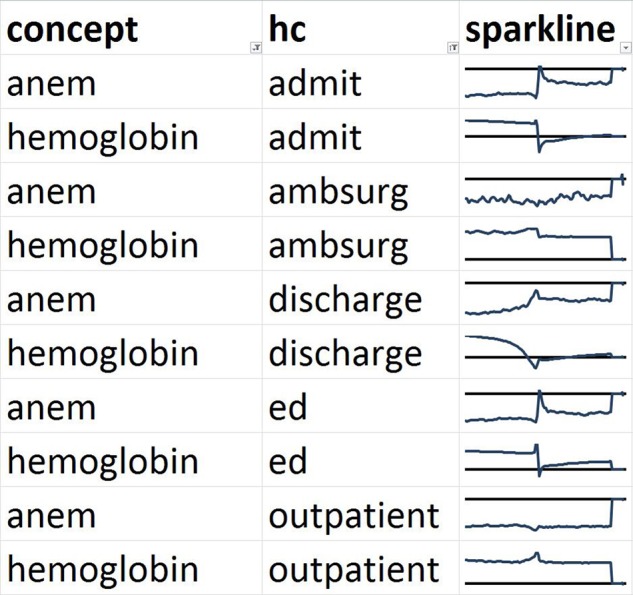
Comparison of profiles of lagged linear correlation with five healthcare (HC) events for hemoglobin laboratory test and the anemia note concept (ANEM). Each graph shows the lagged linear correlation curve for a concept–healthcare event pair. In each graph, the horizontal axis covers –60 to +60 days with 0 days at the midpoint, and the horizontal line represents a correlation of zero with positive correlation above the line. These profiles illustrate a limitation of our technique. The curves cluster away from each other but manual review reveals that they are indeed somewhat similar except for a reversal of sign. Low hemoglobin corresponds to more anemia. ED, emergency department.
Discussion
The approach of clustering EHR variables based on their associations with important healthcare process events appears to group variables into sensible clusters; this lends face validity to the approach. For example, related laboratory tests clustered together and related note concepts clustered together. Of course, if our goal were to find associations, then we could simply cluster the variables directly according to their pairwise associations, and we have carried out that study for note–laboratory pairs.6 Our goal instead is to learn how the healthcare process affects the variables, and our current approach does seem to pull in the healthcare context. The fact that the clusters differ from figures 2 to 3 demonstrates that healthcare context does affect the associations, and it appears to be sensitive to the manner in which the data were collected.
The distinction between pairwise associations and healthcare associations is important to emphasize. We did not, for example, attempt to study the pairwise relationship between inpatient concepts (eg, extubate and intubate) in the outpatient setting. Instead, we compared how extubation relates to the outpatient setting, and how intubation relates to the outpatient setting, and then how those two relationships compared. For example, it may be that they cluster together because they are similarly distant from the outpatient setting. Although it is less common, occasionally a patient will be admitted and intubated soon after an outpatient visit or be extubated and discharged with a follow-up visit soon afterwards, and this will also be reflected in the correlations.
We believe that we may be able to exploit these groupings for the phenotyping process. One of the challenges in creating phenotypes is accounting for the biases of data collection. Grouping variables based on their associations with healthcare process events may quickly—and on a large scale—clue the phenotype knowledge engineer to variables with similar biases. In this study, for example, laboratory values and note concepts were separated. While that division may be obvious, on a larger scale it may be possible to group variables based on less obvious but equally important divisions in the biases that they are likely to have. In effect, this study serves as the measurement study that demonstrates the approach's ability to group and separate variables according to their measurement properties.
The groupings might then be used in the phenotyping process. The knowledge engineer might purposely select input variables from a broad variety of bias types in an attempt to reduce the variance of the phenotype. This will require further study and proof, but the intuition is that averaging several variables with different measurement properties but similar underlying physiology will tend to improve the signal-to-noise ratio of the physiological signal being measured to the noise of measurement bias. For example, based on our results, if one is creating an anemia phenotype, it may be beneficial to include both a threshold on hemoglobin and the note concept anemia because the two appear to act somewhat independently despite their obvious clinical relation.
Our current approach is limited in the number of healthcare process events that were used and the number of EHR variables that were studied. We believe that an effective approach will require a larger number of disparate healthcare process events and should be applied to a large cohort of EHR variables. Another limitation is that many of our concepts and our corpus are primarily from the inpatient setting (resident signout notes are in fact occasionally used in the resident clinic setting). Nevertheless, our correlations with outpatient healthcare events still produced reasonable clusters. Our work was carried out at one academic medical center, and we do not yet know which healthcare processes will be generalizable. We believe that the high-level concepts, such as the overnight measurement of patients who are more ill, will be broadly applicable to other centers. We have made our code available via GitHub (github.org) and MATLAB Central (http://www.mathworks.com/matlabcentral), and verification via national efforts like the eMERGE network or OMOP would be beneficial.
In summary, correlating EHR variables with healthcare process events produced sensible grouping of variables, but appeared to be highly sensitive to the manner in which the variables were collected. We believe that it may be possible to exploit this sensitivity to improve the phenotyping process, and that the approach may point the way in the longer run to a more automated and reliable phenotyping process.
Supplementary Material
Footnotes
Contributors: The authors are responsible for the conception and design, acquisition of data, and analysis and interpretation of data; drafting the article and revising it; and final approval of the version to be published.
Funding: This work was funded by a grant from the National Library of Medicine, ‘Discovering and applying knowledge in clinical databases’ (R01 LM006910).
Competing interests: None.
Ethics approval: This study was approved by the Columbia University Medical Center Institutional Review Board.
Provenance and peer review: Not commissioned; externally peer reviewed.
References
- 1.Blumenthal D, Tavenner M. The “meaningful use” regulation for electronic health records. N Engl J Med 2010;363:501–4 [DOI] [PubMed] [Google Scholar]
- 2.Hripcsak G, Albers DJ. Next-generation phenotyping of electronic health records. J Am Med Inform Assoc 2012;20:117–21 [DOI] [PMC free article] [PubMed] [Google Scholar]
- 3.Kho AN, Pacheco JA, Peissig PL, et al. Electronic medical records for genetic research: results of the eMERGE consortium. Sci Transl Med 2011;3:79re71. [DOI] [PMC free article] [PubMed] [Google Scholar]
- 4.Overhage JM, Ryan PB, Reich CG, et al. Validation of a common data model for active safety surveillance research. J Am Med Inform Assoc 2012;19:54–60 [DOI] [PMC free article] [PubMed] [Google Scholar]
- 5.Wilcox AB, Hripcsak G. The role of domain knowledge in automating medical text report classification. J Am Med Inform Assoc 2003;10:330–8 [DOI] [PMC free article] [PubMed] [Google Scholar]
- 6.Hripcsak G, Albers DJ, Perotte A. Exploiting time in electronic health record correlations. J Am Med Inform Assoc 2011;18:i109–15 [DOI] [PMC free article] [PubMed] [Google Scholar]
- 7.Johnson SB. Generic data modeling for clinical repositories. J Am Med Inform Assoc 1996;3:328–39 [DOI] [PMC free article] [PubMed] [Google Scholar]
- 8.Koopmans LH. The spectral analysis of time series. New York: Academic Press, 1974 [Google Scholar]
- 9.Stengel RF. Optimal control and estimation. New York: Dover, 1994 [Google Scholar]
- 10.Wheeden RL, Zygmund A. Measure and integral, volume 43 of Monographs and textbooks in pure and applied mathematics. New York: Marcel Dekker, Inc., 1977 [Google Scholar]
- 11.Hastie T, Tibshirani R, Friedman J. The elements of statistical learning. New York: Springer, 2001 [Google Scholar]
- 12.Fayyad U, Grinstein GG, Wierse A. Information visualization in data mining and knowledge discovery. San Francisco, CA: Morgan Kaufmann Publishers, 2002 [Google Scholar]
Associated Data
This section collects any data citations, data availability statements, or supplementary materials included in this article.


