

Abstract
Emotional stress activates the sympathetic nervous system (SNS) and release of the neurotransmitter norepinephrine (NE) to promote breast tumor pathogenesis. We demonstrate here that the metastatic mammary adenocarcinoma cell line 4T1 does not express functional adrenergic receptors (AR), the receptors activated by NE, yet stimulation of AR in vivo altered 4T1 tumor progression in vivo. Chronic treatment with the antidepressant desipramine (DMI) to inhibit NE reuptake increased 4T1 tumor growth but not metastasis. Treatment with a highly-selective α2-AR agonist, dexmedetomidine (DEX), increased tumor growth and metastasis. Neither isoproterenol, a ß-AR agonist, nor phenylephrine, an α1-AR agonist, altered tumor growth or metastasis. Neither DMI- nor DEX-induced tumor growth was associated with increased angiogenesis. In DMI-treated mice, tumor VEGF, IL-6, and the pro-metastatic chemokines RANTES, M-CSF, and MIP-2 were reduced. Tumor collagen microstructure was examined using second harmonic generation (SHG), a non-absorptive optical scattering process to highlight fibrillar collagen. In DMI- and DEX-treated mice, but not ISO-treated mice, tumor SHG was significantly altered without changing fibrillar collagen content, as detected by immunofluorescence. These results demonstrate that α2-AR activation can promote tumor progression in the absence of direct sympathetic input to breast tumor cells. The results also suggest that SNS activation may regulate tumor progression through alterations in the extracellular matrix, with outcome dependent on the combination of AR activated. These results underscore the complexities underlying SNS regulation of breast tumor pathogenesis, and suggest that the therapeutic use of AR blockers, tricyclic antidepressants, and AR agonists must be approached cautiously in breast cancer patients.
Keywords: Breast cancer, norepinephrine, adrenergic receptors, second harmonic generation, fibrillar collagen
INTRODUCTION
In cancer patients, chronic emotional stress or other negative psychological factors, such as depression or lack of social support promote tumor growth and progression (1, 2). The sympathetic nervous system (SNS) is an important pathway by which stress can facilitate tumor growth (3–6). The SNS neurotransmitters norepinephrine (NE) and epinephrine activate α- and ß-adrenergic receptors (AR). In animal models employing ß-AR-expressing cancer cell lines, stressor exposure or ß-AR stimulation increased tumor growth and/or metastasis by mechanisms such as increased tumor angiogenesis and density of tumor associated macrophages (7, 8). SNS activation can also target ß-AR-expressing host cells residing in the tumor or in metastatic sites to promote tumor growth and metastasis (6, 9). These studies provide compelling evidence that NE and AR-expressing tumor cells or host stromal cells modulate tumor pathogenesis.
Despite progress in understanding the molecular mechanisms underlying sympathetic regulation of tumor progression, several critical questions remain. First, the role for α-AR has not been carefully examined despite the fact that in human breast cancer, α-AR expression has been linked to poor prognosis (10). Second, variation in breast cancer cell line AR expression (11, 12) is recapitulated in human breast tumors that display heterogeneity in α- and ß-AR expression (10). The functional consequences of such heterogeneity have yet to be systematically explored. It is reasonable to assume that when breast cancer cells express no or low levels of AR, host stromal AR would be the direct targets of elevated NE. Stromal cells, including cells of the immune system, endothelial cells, and fibroblasts, express α-AR and ß-AR normally and in tumors (8, 13, 14). We propose that SNS activation can promote tumor pathogenesis by acting on stromal cells to alter the tumor extracellular matrix.
To test this hypothesis, we have employed multiphoton laser scanning microscopy and second harmonic generation (SHG) to visualize a component of the tumor stroma, fibrillar collagen. SHG is an endogenous optical signal produced when two excitation photons combine to produce one emission photon, “catalyzed” by a non-centrosymmetric structure, such as ordered collagen triple helices (15). Tumor collagen fiber microstructure, as revealed by SHG, is of great interest because several studies have suggested that it influences tumor progression, specifically tumor metastasis. It is important to note that not all collagen fibers produce detectable SHG (16), and that tumor cells can migrate towards blood vessels via SHG+ fibers, locomoting along such fibers more efficiently than cells moving independently. Interestingly, the extent of SHG-associated tumor cell motility is correlated with metastatic ability (17, 18). In breast cancer patient biopsies, we demonstrated shifts in SHG emission patterns associated with progression to more metastatic disease (19), and lymph node metastasis was associated with increased breast tumor SHG+ collagen I density (20). Finally, SHG-based tumor-associated collagen signatures are prognostic factors for disease-free survival, independent of tumor grade, size, and hormonal receptor status (21). Thus, SHG imaging represents a novel imaging modality to assess the impact of SNS activation on tumor extracellular matrix and explore stromal pathways that may be activated by NE to influence tumor progression.
We demonstrate here that 4T1, a metastatic mammary adenocarcinoma (22), lacks functional α- and β-AR, and is unable to respond to NE in vitro. Therefore, we propose 4T1 as an excellent model for investigating effects of SNS activation on tumors in the absence of direct sympathetic input to the tumor cells themselves. To explore the impact of elevated NE in the 4T1 tumor model, mice were treated with the NE reuptake inhibitor, desipramine (DMI), a drug used clinically as an antidepressant (23, 24). We demonstrate that chronic treatment with DMI increased orthotopic 4T1 tumor growth while highly selective α2-AR activation by treatment with dexmedetomidine (DEX) increased both tumor growth and metastasis. DMI and DEX treatments were associated with altered SHG-emitting tumor collagen. These results provide evidence that activation of the SNS can promote tumor progression and metastasis through interactions with the tumor stroma, and can do so through activation of α2-AR.
MATERIALS AND METHODS
Mice
Female BALB/cByJ mice (6–8 weeks of age; The Jackson Laboratories, Bar Harbor, ME) were housed 3–4 per cage with food and water ad libitum, and used experimentally two weeks after arrival. All animal procedures were carried out in accordance with the National Institutes of Health Guide for the Care and Use of Laboratory Animals and were approved by the University of Rochester Committee on Animal Resources. The University of Rochester Animal Resource is fully accredited by AAALAC International.
Cell Lines and Tissue Culture
4T1 (mammary adenocarcinoma; CRL-2539), MDA-MB-231 (MB-231; HTB-26), and human foreskin fibroblast-1 cells (HFF; SCRC-1041) were acquired from American Type Culture Collection (ATCC, Manassas, VA) within the last two years. ATCC authenticates cell lines using short tandem repeat analyses. Upon acquisition, cells were expanded for no more than 3 passages and frozen. All cell lines were used within 3 months of thawing. For passaging, 4T1 was grown in RPMI containing penicillin/streptomycin and 10% fetal calf serum. MB-231 and HFF were grown in DMEM containing L-glutamine and supplemented with penicillin/streptomycin and 10% fetal calf serum. All media and media components were purchased from Gibco, Invitrogen Inc., Carlsbad, CA. All cells were regularly tested for mycoplasma contamination.
In vitro culture of 4T1 cells to measure proliferation and cytokine production was described previously (11). Proliferation was assessed using CyQuant NF Proliferation Assay kit (Invitrogen) following the manufacturer's instructions. Fluorescence was detected with a 485 nm excitation filter and 530 nm emission filter using a multiwell plate reader (Biotek). For cytokines, cell-free supernatants were harvested after 72 hours in culture and stored at −80°C.
Drug Treatment
Drug treatments commenced two days prior to tumor cell injection and continued for the duration of the experiment. For DMI treatment, continuous release pellets (Innovative Research of America; Sarasota, FL) were implanted subcutaneously under ketamine/xylazine anesthesia (90/9 mg/kg). The AR agonists isoproterenol (ISO; Sigma-Aldrich, St. Louis, MO), phenylephrine (PE; Sigma-Aldrich), and dexmedetomidine (DEX; Pfizer, New York, NY) were dissolved in sterile saline. Mice were injected intraperitoneally (IP) daily for the duration of the experiment. ISO and PE doses were chosen based on ISO-induced increased tumor pathogenesis reported in other murine tumor models (7, 8) and on pilot toxicity studies. Two doses of DEX were tested: 10 μg/kg elicited no apparent sedative effects and 25 μg/kg elicited mild and transient anesthetic effects (slowed movements following injection that were no longer apparent one hour after injection). DMI, ISO, and PE treatment elicited early and transient decreases in body weight (≤ 10%) that recovered over time.
Tumor Implantation, Growth, and Tissue Harvest
4T1 cells (1×10⁵ in sterile saline) were injected into the third mammary fat pad (MFP) under ketamine/xylazine anesthesia. Tumors were measured with calipers every 2–3 days without knowledge of experimental group. Mice were sacrificed by pentobarbital overdose (200 mg/kg, IP) followed by cervical dislocation to harvest tumor, spleen, and lungs. Tumors and spleens were weighed and divided. For catecholamine and cytokine analyses, tissue was immediately placed on dry ice and stored at −80°C.
Tumor volume (V) was calculated using the equation V=1/2*length*width2. Tumor growth is presented either as the raw tumor volume over time or as normalized tumor growth. Normalized tumor growth was calculated by dividing an individual's tumor volume at a given time point by its volume at the earliest time point all tumors were detected (day 3 or 5 post-4T1).
NE/Normetanephrine (NMN) and Cytokine Analyses
For NE and NMN, tissue was homogenized in 0.01M HCl at 10% volume (ml) by tissue weight. NE and NMN were determined by ELISA (Rocky Mountain Diagnostics; Colorado Springs, CO) following the manufacturer's instructions. For cytokines, tissue was homogenized in RIPA buffer containing protease inhibitors (Pierce, Rockford, IL). Cytokines were measured using mouse-specific ELISAs (R&D Systems, Minneapolis, MN) following the manufacturer's instructions.
For multiple analyte analysis, a Milliplex mouse cytokine/chemokine magnetic bead panel kit (Millipore, catalogue #MCYTOMAG-70K) was employed following the manufacturer's instructions. A Luminex 200 plate reader equipped with xPOnent software (University of Rochester Flow Cytometry Core) was used to determine median fluorescence intensity for each analyte. The concentration of each analyte was calculated using the corresponding standard curve fit to a 5-parameter logistic equation.
For all ELISAs, absorption was measured at 450 nm using a multiwell plate reader (Synergy HT, Biotek Instruments Inc, Winooski, VT). Curve fitting and sample concentration calculations were conducted with Gen5 software (Biotek). Concentrations were normalized to total protein in homogenates as determined with a BCA protein assay (Pierce).
Immunohistochemistry, Second Harmonic Generation (SHG), and Image Analysis
Tumors were fixed in 4% paraformaldehyde for 72 hours, followed by incubation in 10% sucrose and 30% sucrose for 24 hours each. Three adjacent tumor sections (20 μm thick) were collected every 100 μm. Standard immunohistochemical techniques were used to detect blood vessels using rat-anti CD31+ antibody (diluted 1:20; Abcam, Cambridge, MA), proliferating cells using polyclonal rabbit-anti Ki67 (1:500, Abcam) or collagen I using polyclonal rabbit anti-collagen type I antibody (1:200, Abcam). Species-appropriate Alexa-Fluor-594-conjugated secondary antibodies (Invitrogen) were used to detect the primary antibodies. FITC-conjugated anti-F4/80+ antibody (Abcam) was used to detect F4/80+ macrophages.
For immunofluorescent and SHG imaging of collagen, tumor sections were imaged using multiphoton microscopy. Five random fields of view per tumor section were imaged by a blinded observer using an 0.8 NA 20X water immersion objective lens and electronic zoom at 1X, one section per tumor. SHG and immunofluorescence emission was collected simultaneously under constant imaging conditions in each sample, including excitation wavelength (810 nm), laser power (8 mW at the sample) and photomultiplier tube voltages. To detect immunofluorescence, fluorophore emission was collected using bandpass filters 520/40 (for FITC) and 635/30 (for Alexa-Fluor 594). SHG signal was separated from fluorescence by a 475 nm long-pass dichroic (Semrock, Rochester, NY) and detected through a bandpass 405/30 emission filter.
All images were analyzed by personnel blinded to group using custom algorithms in ImageJ (NIH Freeware). To quantify CD31 and Ki67 immunofluorescence, a threshold that excluded autofluorescence was determined in adjoining tissue sections stained with secondary antibody alone, and the percentage of pixels above threshold was calculated. Average blood vessel area was calculated and normalized to cell density based on 4', 6-diamino-2-phenylindole (DAPI) nuclear staining. To quantify SHG and anti-collagen immunostaining, a common threshold was determined for all samples by determining background pixels averaged from two tissue-free images from each channel. The average background intensity was subtracted from all images, then common SHG and immunostained thresholds were applied to distinguish SHG or immunostained pixels from background pixels. Two calculations were used to represent SHG or immunohistochemical collagen signal: the percentage of pixels above threshold in each image and the average intensity of those pixels above threshold. The SHG and collagen immunostaining values from five regions of interest from each tumor section were averaged for each animal.
Lung Metastases
Lungs were fixed in 10% formalin and paraffin-embedded. Five μm-thick sections were collected every 100 μM through the entire lung. Tissue sections were stained using standard hematoxylin and eosin (H&E) techniques. Metastases were visualized using a 4X objective lens and counted in each tissue section by a blinded observer.
β-AR Expression and Intracellular cyclic AMP
A standard radioligand binding assay was used to determine specific binding of 125I-cyanopindolol (NEN Radiochemicals, Waltham, MA) to whole cells to quantify β-AR expression, as described previously (11). The procedure to measure intracellular cAMP was described previously (11). Cyclic AMP content was measured by ELISA (R&D Systems) following the manufacturer's instructions.
Statistical Analyses
Statistical analyses were conducted with GraphPad PRISM software with p<0.05 considered statistically significant. When two groups were compared, an F-test for variance was conducted to compare variance. If variance was similar, an unpaired two-tailed student's t-test was employed. If variance differed, group comparisons were conducted using the non-parametric Mann-Whitney U-test. To compare more than two groups, one-way or two-way ANOVA was used. When variance differed significantly between groups, the non-parametric Kruskal-Wallis test was employed, with post-hoc analysis by Dunn's multiple comparison test. Tumor growth over time was analyzed using repeated measures two-way ANOVA. Significant interactions or main effects were analyzed by simple effects or by Holm-Sidak multiple comparison test.
RESULTS
4T1 Tumor Cells Do Not Respond to NE In Vitro or Signal via AR
To determine if NE directly regulates 4T1 tumor cell functional responses, NE or selective AR agonists were incubated with 4T1 cells in vitro. NE did not alter 4T1 proliferation (Fig. 1A) or VEGF production (Fig. 1B) under in vitro conditions that altered VEGF production and proliferation in MB-231 and other ß-AR-expressing breast cancer cell lines (11). Furthermore, specific binding of the β-AR ligand 125I-cyanopindolol was readily detectable with MB-231 cells, but not 4T1 cells (Fig. 1C), and isoproterenol (ISO), a β-AR agonist, elevated intracellular cAMP in MB-231 cells but not in 4T1 cells (Fig. 1D). Together, these results demonstrate that 4T1 cells do not possess cell surface β-AR. In terms of β-AR, the β1-agonist phenylephrine (PE) did not significantly alter 4T1 proliferation or VEGF production (Fig. 1E,F). The β2-agonist DEX had no effect except at the highest concentration tested (42 μM), where 4T1 proliferation was reduced and VEGF production was increased (Fig. 1G,H; supplementary Fig. S1 A,B). However, yohimbine, an β2-AR antagonist, did not block these DEX-induced effects (supplementary Fig. S1 A,B), and there was no evidence for β2-AR signaling by cAMP inhibition (supplementary Fig. S1 C, (25)), as demonstrated here in a human fibroblast line (supplementary Fig. S1 D). We conclude that 4T1 cells do not express functional β1-, β2- or ß-AR and therefore NE cannot directly affect 4T1 function. We next tested if elevated synaptic NE altered 4T1 tumor pathogenesis in vivo.
Figure 1. 4T1 Cells Do Not Express Functional AR.

NE does not alter 4T1 cell proliferation (A) or VEGF production (B). 4T1 cells were incubated with NE at the concentrations indicated. Results are expressed as mean ± SD of triplicate wells from a representative experiment of 2 experimental repetitions. Statistical Analyses: (A) no main effects of NE, time, or NE × time interaction; (B) no main effects of NE or NE × time interaction, main effect of time, p <0.0001; (C) ß-AR expression as measured by specific 125I-CYP ligand binding of 4T1 (stars) and the ß-AR-expressing line MB-231 (diamonds). (D) ß-AR agonist isoproterenol (ISO) induced cAMP response in MB-231 compared to 4T1. (E, F) 4T1 incubated with the α1-AR agonist phenylephrine (PE). Kruskal-Wallis test, no significant effects of PE. (G, H) 4T1 incubated with the α2-AR agonist DEX. (G) Kruskal-Wallis test, effect of DEX (p=0.03, indicated by asterisk), with no significant differences versus 0 drug by Dunn's multiple comparisons test; (H) Kruskal-Wallis test, DEX treatment, p = 0.053 with no differences versus 0 drug by Dunn's multiple comparisons test.
DMI, a NE Reuptake Inhibitor, Increases 4T1 Tumor Growth, but Not Metastasis
DMI inhibits NE reuptake through the NE transporter and thereby increases synaptic NE (23, 24). To assess alterations in synaptic NE in the periphery, NE and its metabolite NMN were measured in the densely-innervated spleen. NE concentration primarily represents NE synthesized and stored intraneuronally, but NMN is produced by an extraneuronal enzyme (catechol-O-methyltransferase), and reflects NE released and metabolized in the synapse (26). In mice implanted subcutaneously with 21-day continuous release pellets containing DMI (10 mg) or placebo, DMI increased splenic NE 2-fold and NMN 4-fold relative to placebo in association with reduced spleen mass 3 days after pellet implantation (supplementary Fig. S2 A–C). The increased NMN is evidence of effective NE uptake blockade, and elevated NMN (but not NE) was detected in the spleen up to 7 days after DMI implantation (data not shown). In comparison to daily IP injection of DMI, subcutaneous pellets elicited greater magnitude and longer lasting elevation in splenic NE and NMN (data not shown).
To assess tumor growth, mice were implanted with pellets containing DMI or placebo 2 days prior to 4T1 injection, a treatment regimen similar to the chronic pharmacological ß-AR activation that elicited increased tumor growth/metastasis in ß-AR-expressing tumor models (7–9). Using pellets containing 5, 7.5, or 10 mg DMI in pilot studies (data not shown), we determined the 10 mg dose increased tumor growth most effectively. DMI treatment (10 mg) increased tumor volume (mm3) (Fig. 2A; see figure legends for statistical analyses) and growth rate (volume normalized) (Fig. 2B), in association with significantly increased tumor weight by day 14 post-4T1 injection (Fig. 2C). Despite the increase in tumor growth, metastasis to the lungs was not altered in DMI-treated mice (Fig. 2D,E). DMI treatment significantly reduced tumor VEGF, a key proangiogenic cytokine (Fig. 2F), and transiently decreased tumor IL-6, a proinflammatory cytokine with proangiogenic activity (Fig. 2G); however, DMI treatment did not alter CD31+ blood vessel density (supplementary Fig. S3). Tumor NE was not altered by DMI treatment (Fig. 2H). A transient increase in tumor NMN was detected at day 12 post-4T1 injection (Fig. 2I).
Figure 2. DMI Treatment Increased Tumor Growth but not Metastasis.

Mice were implanted with 10 mg DMI or placebo continuous release pellets 2 days before 4T1 inoculation. Tumor growth expressed as volume (A) or normalized (B) and as tumor weight (C). Lung metastasis (D) were measured 14 days post-4T1 injection. (E) Representative H&E-stained lung with metastatic lesion indicated by arrow. 4X objective lens; scale bar = 200 μm. (A–D) Results represent one of two experimental replications at each time point. For (H) and (I) results from two experimental repetitions were normalized relative to the respective placebo controls. Results are expressed as mean ± SEM, n=6–7 mice per group for day 7 and 12, n=9–10 per group day 14 post-4T1 injection. Statistical analyses: (A) main effect of DMI treatment, p = 0.047; treatment × time interaction, p <0.0001; main effect of time, p <0.0001; (B) main effect of DMI treatment, p = 0.0005; treatment × time interaction, p=0.0001, main effect of time, p<0.0001; (C) Tumor weight: main effect of DMI, p = 0.02; DMI × time interaction, p = 0.04, main effect of time, p <0.0001; (D) Lung metastasis: Student's t-test, p = 0.6; (F) VEGF: DMI treatment, p = 0.0006, no interaction or effect of time; (G) IL-6: main effect of DMI treatment, p=0.004, no DMI × time interaction, main effect of time, p = 0.0001; (H) tumor NMN: DMI × time interaction, p = 0.02). Asterisks indicate significant differences versus corresponding placebo control group by Holm-Sidak's multiple comparisons test (p<0.05).
α2-AR Activation Increases Breast Tumor Growth and Metastasis
To determine if selective activation of AR can increase tumor growth, mice were injected daily with 5 mg/kg ISO (nonselective β-AR agonist), 10 mg/kg PE (α1-AR) or 10 and 25 μg/kg DEX (α2-AR) beginning two days prior to 4T1 injection and continuing until sacrifice. Neither ISO nor PE treatment altered normalized tumor growth, tumor weight or lung metastases (Fig. 3A–D). Tumor VEGF and IL-6 did not differ between PE or ISO treatment and saline controls at sacrifice (Fig. 3E,F). Daily treatment with the highly selective α2-AR agonist DEX (10 and 25 μg/kg) increased the rate of tumor growth and the number of metastasis in the lung compared to saline controls (Fig. 3 G,H). Immunohistochemistry using anti-Ki67 to detect proliferating cells revealed an increase in proliferating cells in the 10 μg/kg DEX group compared to saline and 25 μg/kg groups (Fig. 3I). DEX treatment did not alter tumor VEGF (Fig. 3J) or IL-6 (Fig. 3K) at sacrifice.
Figure 3. 4T1 Tumor Growth and Metastasis in Mice Treated with ISO, PE, or DEX.
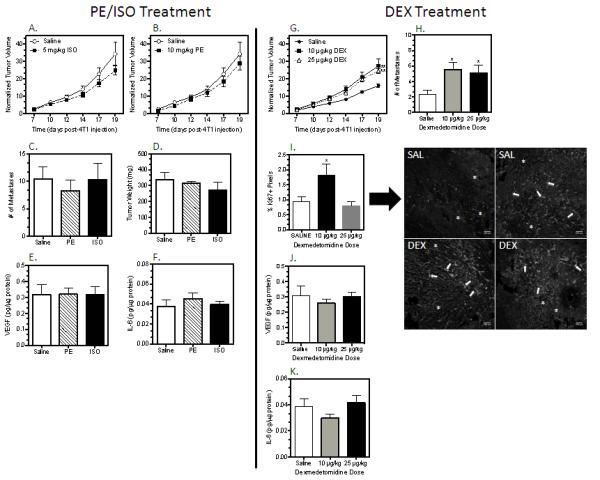
Treatment was initiated 2 days prior to 4T1 injection and continued daily until sacrifice on day 19 post-4T1 injection. ISO and PE treatment were part of the same experiment and shared a saline control group, but for ease of comparison, the normalized tumor growth for ISO and PE are graphed separately in (A) and (B). (A–F) PE and ISO treatment, n = 6 per group. (G–K) DEX treatment, n=9 per group. (I) Representative images of Ki67+ proliferating cells in 2 tumors each from saline and DEX-treated (10 μg/kg) mice; 10X objective lens; scale bar = 200 μm. Asterisks and arrows indicate two morphologies apparent with Ki67 staining in 4T1 tumors. All results are expressed as mean ± SEM. Statistical analyses: (A) ISO, normalized tumor volume: no main effect of treatment (p = 0.14) or interaction by time (p = 0.22), main effect of time (p<0.0001); (B) PE, normalized tumor volume: no treatment (p = 0.4) or interaction (p = 0.4), main effect of time (p<0.0001); (C–F) PE or ISO versus saline, student's t-test, p>0.05. (G) DEX, normalized tumor volume, main effect of treatment, p = 0.009; interaction, p<0.0001; time, p<0.0001; ** Simple effects analysis of main effect, p<0.0001 versus saline; (H) Metastasis, p= 0.03; * Holm-Sidak analysis, p<0.05 versus saline; (I) Ki67 analysis: Kruskal-Wallis, p = 0.04; (J) VEGF, Kruskal-Wallis, p = 0.6; (K) IL-6, Kruskal-Wallis, p= 0.3.
Potential Cytokine/Chemokine Mechanisms Underlying DMI- and DEX-induced Tumor Pathogenesis
To further probe the mechanisms underlying differences in DMI versus DEX-induced tumor progression, additional tumor cytokines and chemokines were measured by multiplex analysis. In DMI-treated mice, the proinflammatory cytokine TNF-α was non-significantly increased (Fig. 4A, Mann-Whitney, p = 0.07). A similar trend was detected in mice treated with 10 μg/kg DEX (Fig. 4B; ANOVA, p = 0.052) but not in PE- or ISO-treated mice (data not shown). TNF-α added directly to 4T1 cells did not alter proliferation in vitro (supplementary Fig. S4), indicating that elevated TNF-α cannot directly increase 4T1 tumor growth. Furthermore, neither DMI nor DEX treatment altered the proinflammatory cytokine IL-1ß, the T cell-associated cytokines IL-2 and IFN-γ, or the anti-inflammatory cytokine IL-10 (data not shown). However, several tumor chemokines that promote tumor metastasis and regulate macrophage activity including RANTES (CCL-5), M-CSF (CSF-1), and MIP-2 (CCL-2) were decreased by DMI treatment (Fig. 4A), but not altered by DEX treatment (Fig. 4B). Neither DMI nor DEX treatment significantly altered the density of F4/80+ tumor macrophages (supplementary Fig. S5).
Figure 4. Multiplex Analysis of Tumor Chemokines and Cytokines in mice treated with (A) DMI or (B) DEX.

DMI elicited reductions in chemokines that were not observed with DEX-treatment. Results are expressed as mean ± SEM, n=7–8 mice per group. In (A) Student's t-test or non-parametric Mann-Whitney (M-W) p-values are indicated for each chemokine/cytokine. In (B), p-values represent analysis by one-way ANOVA. * indicates significant differences versus corresponding control group (p<0.05).
DMI- and DEX-induced Tumor Growth is Associated with Altered SHG-Producing Tumor Collagen
Structural alterations in fibrillar collagen, uniquely visible via SHG imaging, are associated with tumor cell proliferation and motility (18, 27). Our laboratory has demonstrated that stromal TNF-α knock-out, or depletion of macrophages, reduced tumor growth and metastasis and was associated with alterations in SHG (28). These findings, combined with the association between DMI- and DEX-induced tumor growth and trends toward increased tumor TNF-α, led us to explore a matrix-based mechanism underlying the increased tumor growth.
We analyzed collagen in 4T1 tumors from DMI-, DEX-, and ISO-treated mice using two methods: standard immunohistochemical analysis and SHG imaging. Figure 5A shows two representative images from a 4T1 tumor with SHG-producing collagen (in blue) and collagen type I detected by immunohistochemistry (in green) in the same section. Image analysis revealed that in 4T1 tumors from DMI-treated mice, the SHG-emitting pixel intensity was increased (Fig. 5B) without a change in the density of SHG-emitting collagen as determined by the number of SHG pixels above a common threshold (Fig. 5C). No change in total collagen was detected by anti-collagen I immunohistochemistry (Fig. 5D). On the other hand, DEX treatment did not alter the intensity of SHG pixels above threshold (Fig. 5E), but it increased the number of SHG pixels above threshold (Fig. 5F) with no change in total collagen (Fig. 5G). The ß-agonist ISO produced no change in SHG intensity (Fig. 5H) and a non-significant increase in SHG pixel number (Fig. 5I, p = 0.07). By immunohistochemistry, ISO also produced a non-significant reduction in total collagen pixel intensity (Fig. 5J, p = 0.15). These alterations in SHG indicate changes in tumor collagen microstructure with DMI, DEX, and ISO treatment, and each treatment uniquely correlates with augmentation of primary tumor growth (DMI), tumor growth and metastasis (DEX), or no alteration (ISO) (summarized in Table I).
Figure 5. Tumor Collagen Structure is Differentially Altered by DMI, DEX, and ISO Treatment.

Tumor slices were stained for collagen by standard immunohistochemical techniques and imaged to detect immunofluorescent and SHG emission by multiphoton microscopy. Image analysis was conducted with Image J as described in materials and methods. (A) Two representative pseudo-colored images of SHG (blue) versus collagen type I (green) from a 4T1 tumor. Scale bars = 100 μm. (B, E, H) SHG pixel intensity above theshold; (C, F, I) Percentage of SHG pixels above threshold; (D, G, J) Anti-collagen immunohistochemical analysis. Results shown are mean ± SEM, n= 8–9 mice per group for both DMI and DEX experiments; n=6 per groups for ISO experiment. Asterisk indicates significant differences based on student's t-test, p<0.05 versus placebo or saline by student's t-test; M-W = Mann-Whitney non-parametric U-test.
TABLE 1.
Summary of DMI, DEX, and ISO-induced Tumor Matrix Alterations
| Treatment (AR-selectivity) | Tumor Growth | Metastasis | SHG+ Content (Intensity) | SHG+ Fibers (% Pixels) | Total Collagen (IF) |
|---|---|---|---|---|---|
| DMI (mixed AR) | Increased | No Change | Increased | No Change | No Change |
| DEX (α2) | Increased | Increased | No Change | Increased | No Change |
| ISO (ß-AR) | No Change | No Change | No Change | No Change | Decreased |
DISCUSSION
AR activation promotes tumor growth or metastasis in several animal models of cancer in which the tumor cells express functional AR (7, 8, 29). We demonstrate here that the mammary adenocarcinoma cell line 4T1 lacks α-AR and β-AR expression and signaling capacity and is unable to directly respond to NE. To our knowledge, no studies have investigated the in vivo impact of sympathetic activation and NE stimulation on tumor pathogenesis when the tumor cells cannot directly respond to NE. Doing so removes the influence of tumor ARs and thus allows the investigation of AR stimulation of AR-expressing host stromal cells, effects that may be masked when tumor cells express functional AR. Under these conditions, we demonstrated that inhibition of NE reuptake to elevate synaptic NE promotes 4T1 tumor growth, and α2-AR activation can drive tumor growth and metastasis. The distinct alterations in SHG emission from tumor collagen accompanying elevated NE and AR stimulation suggests that SNS activation may modify the tumor extracellular matrix to regulate pathogenesis. Together, these results reveal novel pathways by which SNS activation can drive tumor growth and metastasis despite the inability of the tumor cells themselves to respond to NE.
A Role for α2-AR and Host Stromal Cells in Tumor Growth and Metastasis
The finding that DMI treatment elevated NE and increased 4T1 tumor growth is consistent with other reports demonstrating augmentation of tumor growth and/or metastasis associated with sympathetic innervation and ß-AR-expressing tumor or stromal cells (6–8). However, our results differ in several important ways from these reports. We found no evidence that increased tumor growth was associated with ß-AR activation or with increased angiogenesis or pro-angiogenic cytokines. Furthermore, in this AR-negative tumor model, ß-AR activation with ISO did not increase lung metastasis or elevate M-CSF (also known as CSF-1; data not shown), as reported by Sloan and colleagues. We contend a ß-AR-induced reduction in CSF-1 or other stromal-derived cytokines/chemokines may be obscured if tumor cytokine production (such as CSF-1) is increased by ß-AR activation. In this scenario, whether or not the tumor cells can respond to ß-AR stimulation may dictate directionally opposite tumor outcomes.
Our results are consistent with a small number of reports of increased proliferation by α2-AR-expressing breast tumor cell in vitro and increased tumor growth in vivo (13, 29, 30), but we have been unable to detect functional α2-AR in several breast cancer cell lines (data not shown). In fact, DEX at supra micromolar concentrations may act on imidazoline receptors (31) to reduce 4T1 cell proliferation and increase VEGF production in vitro (Fig. 1G, H). This concentration of DEX, orders of magnitude above the Ki for α2-AR (1.08 nM; (32)), is unlikely to be achieved in vivo at the doses used here. Instead, we propose that DEX activation of host stromal α2-AR increased tumor growth and metastasis. Intriguingly, in human breast cancer, the α2A-AR gene was one of 26 tumor stroma genes that together predicted poor outcome (33). One question raised by our results is why DMI treatment – and increased synaptic NE – did not activate α2-AR to affect metastatic outcome along with increased tumor growth. One possibility is that NE stimulation of ß-AR or α1-AR pathways may oppose α2-AR signaling in the tumor or elsewhere in the periphery. This is supported by the observation that while DEX ligation of α2-AR did not affect VEGF, IL-6, RANTES and other pro-metastatic cytokines, DMI-induced elevation of synaptic NE reduced them, presumably via ARs other than α2, thus providing an anti-metastatic counter to the pro-metastatic effects of α2-AR stimulation by elevated NE. One way to test this possibility is to selectively block AR in DMI-treated mice, but we found the combination of DMI and ß-blocker treatment was associated with a high level of mortality; we therefore tested direct stimulation of ß-AR and α1-AR. While we did not detect significant alterations in 4T1 tumor growth and metastasis with ISO or PE treatment, in ISO-treated mice, a trend towards reduced tumor growth (Fig. 3A) and chemokine production was noted (data not shown), and we are further exploring ß-AR activation in this tumor model.
We have yet to identify the stromal targets of NE and α2-AR stimulation or their location. DMI only transiently increased synaptic NE in the tumor, as indicated by the NE metabolite NMN. It should be noted that at no time point post-DMI treatment was splenic or tumor NE or NMN content reduced, indicative of sympathetic nerve depletion due to chronic elevation of NE. Splenic NE and NMN were dramatically increased early after DMI implantation, an effect that subsided but was still apparent as the tumor developed (data not shown). The DMI-induced increase in splenic NE points to the potential targeting of AR-expressing cells in extra-tumoral organs, such as spleen and bone marrow, that play a role in 4T1 pathogenesis (34). Similarly, DEX treatment may target α2-expressing cells within the tumor and the lung to promote metastasis. Furthermore, we cannot rule out these drugs acting at the level of the central nervous system. For example, the DEX-induced increase in tumor Ki67+ proliferating cells (Fig. 3I) and TNF-α (Fig. 4B) at 10 μg/kg, but not 25 μg/kg, may indicate distinct mechanisms underlying DEX treatment involving the mild sedation (central nervous system effects) observed with 25 μg/kg DEX. Nonetheless, our results demonstrate that the elevated tumor growth associated with DEX and DMI treatment is driven by changes apparent within the tumor, including the extracellular matrix.
A Novel Mechanism for SNS Regulation of Tumor Progression: Collagen Microstructure and SHG Imaging
Tumor stromal cells, including macrophages and fibroblasts, regulate tumor collagen structure. The detected SHG signal from a collagen fiber is sensitive to the amount of collagen (15), as well as the diameter of the fibrils that form fibers (35, 36), their spacing (36), and the order versus disorder in fibril packing (37). Here, we define a change in one or more of the latter three parameters (fibril diameter, fibril spacing, and order) as a change in collagen fiber “microstructure”. Hence, the signal produced by SHG differs from immunofluorescent detection of collagen, which is sensitive to epitope concentration and reports primarily the amount of collagen in a given region of interest. The two readouts (SHG and immunofluorescence (IF)) from a given collagen fiber can be compared to gain insight into the extent of changes in fibril microstructure (primarily alters SHG) versus changes in collagen content (alters both SHG and IF) (see Burke et al. (28), Diop-Frimpong et al. (38), and Ingman et al. (39)).
As revealed by image analysis, tumor SHG-emitting collagen was increased by both DMI and DEX treatment in subtly different ways. In DMI-treated mice, tumor SHG pixel intensity above threshold increased without an increase in the percentage of pixels above threshold, representing a change in SHG+ fiber microstructure (Fig. 5B,C). On the other hand, increased SHG emission from tumors from DEX-treated mice was due to an increase in the percentage of pixels above threshold without an increase in the intensity of those pixels above threshold (Fig. 5E,F), suggesting an increase in SHG+ fiber content relative to control tumors. Neither of these types of increased SHG was associated with altered total collagen as measured by IF (Fig. 5D,G), indicative of an alteration in the structure of the tumor collagen and not collagen deposition. Interestingly, ISO elicited a trend towards decreased total collagen as measured by IF (Fig. 5J), and yielded no change in tumor growth or metastasis despite the trend toward increased SHG+ fiber content (Fig. 5I). Based on the evidence that microstructural changes in tumor collagen, as detected by SHG, may drive tumor cell proliferation, local invasion, and metastasis (21, 40, 41), we contend that the treatment-dependent changes in SHG-emitting collagen shown here reflect a stromal-based mechanism by which AR activation may promote tumor progression. Studies are underway to understand the AR mechanisms that alter SHG+ collagen microstructure and to demonstrate that such changes lead to DEX- or DMI-induced tumor progression. These results illustrate the potential power of using SHG imaging in the 4T1 model to distinguish overlapping and opposing effects of increased NE with sympathetic activation consistent with our proposal that NE elicits effects via mixed AR signaling that can oppose each other.
Clinical Implications
An important aspect of this work is that DMI and DEX are used clinically. A retrospective study examining the clinical use of antidepressants and breast cancer development found an association between DMI and increased breast cancer risk (42), consistent with the pro-tumor growth effect shown here. DEX is employed as a sedative to treat cancer pain, adding urgency to delve further into the mechanisms underlying chronic DEX treatment and increased tumor growth and metastasis (43, 44). Finally, our results with DMI and elevated synaptic NE imply a balance between pro-metastatic effects of α2-AR and anti-metastatic ß-AR with increased NE release. If true, caution should be applied in the clinical adjuvant use of ß-blockers, as proposed by others (3, 45).
In summary, our results strongly implicate α2-AR activation as a promoter of tumor pathogenesis in the absence of direct sympathetic input to the tumor cells. The results suggest a unique, matrix-based mechanism whereby NE can facilitate breast tumor growth through regulation of the tumor extracellular matrix, specifically collagen microstructure. Further investigation into this mechanism is critical in part because of the possibility of using SHG imaging to detect SNS-induced alterations in the tumor matrix as a marker of a more aggressive tumor phenotype. Our results suggest that NE can elicit directionally opposing effects within the tumor that must be carefully investigated to understand the impact of stress-induced SNS activation in a disease as molecularly heterogeneous as breast cancer.
Supplementary Material
Acknowledgements
We thank Khawarl Liverpool, Daniel Byun, Tracy Bubel, Giuseppe Arcuri, Taylor Wolfgang, and Petr Stastka for their excellent technical assistance.
Financial Support
Mercedes J Szpunar: Department of Defense Predoctoral Training Award (W81XWH-10-1-0058); Medical Scientist Training Program (NIH T32 GM07356); National Center for Research Resources (TL1 RR024135)
Kathleen A. Burke: Department of Defense Era of Hope Scholar Research Award (W81XWH-09-1-0405) to EBB
Ryan P. Dawes: NIH Training Grant in Neuroscience
Edward B. Brown: Pew Scholar in the Biomedical Sciences Award; Department of Defense Era of Hope Scholar Research Award (W81XWH-09-1-0405); National Institutes of Health Director's New Innovator Award (1 DP2 OD006501-01)
Kelley S. Madden: Department of Defense IDEA Award (W81XWH-10-01-008), National Institutes of Health (1 R21 CA152777-01)
Footnotes
Disclosure of Potential Conflicts of Interest: The authors declare no potential conflicts of interest.
REFERENCES
- 1.Reiche EM, Nunes SO, Morimoto HK. Stress, depression, the immune system, and cancer. Lancet Oncol. 2004;5:617–25. doi: 10.1016/S1470-2045(04)01597-9. [DOI] [PubMed] [Google Scholar]
- 2.Armaiz-Pena GN, Lutgendorf SK, Cole SW, Sood AK. Neuroendocrine modulation of cancer progression. Brain Behav Immun. 2009;23:10–5. doi: 10.1016/j.bbi.2008.06.007. [DOI] [PMC free article] [PubMed] [Google Scholar]
- 3.Cole SW, Sood AK. Molecular pathways: beta-adrenergic signaling in cancer. Clin Cancer Res. 2012;18:1201–6. doi: 10.1158/1078-0432.CCR-11-0641. [DOI] [PMC free article] [PubMed] [Google Scholar]
- 4.Antoni MH, Lutgendorf SK, Cole SW, Dhabhar FS, Sephton SE, McDonald PG, et al. The influence of bio-behavioural factors on tumour biology: pathways and mechanisms. Nat Rev Cancer. 2006;6:240–8. doi: 10.1038/nrc1820. [DOI] [PMC free article] [PubMed] [Google Scholar]
- 5.Lutgendorf SK, Sood AK. Biobehavioral factors and cancer progression: physiological pathways and mechanisms. Psychosom Med. 2011;73:724–30. doi: 10.1097/PSY.0b013e318235be76. [DOI] [PMC free article] [PubMed] [Google Scholar]
- 6.Magnon C, Hall SJ, Lin J, Xue X, Gerber L, Freedland SJ, et al. Autonomic nerve development contributes to prostate cancer progression. Science. 2013;341:1236361. doi: 10.1126/science.1236361. [DOI] [PubMed] [Google Scholar]
- 7.Thaker PH, Han LY, Kamat AA, Arevalo JM, Takahashi R, Lu C, et al. Chronic stress promotes tumor growth and angiogenesis in a mouse model of ovarian carcinoma. Nat Med. 2006;12:939–44. doi: 10.1038/nm1447. [DOI] [PubMed] [Google Scholar]
- 8.Sloan EK, Priceman SJ, Cox BF, Yu S, Pimentel MA, Tangkanangnukul V, et al. The sympathetic nervous system induces a metastatic switch in primary breast cancer. Cancer Res. 2010;70:7042–52. doi: 10.1158/0008-5472.CAN-10-0522. [DOI] [PMC free article] [PubMed] [Google Scholar]
- 9.Campbell JP, Karolak MR, Ma Y, Perrien DS, Masood-Campbell SK, Penner NL, et al. Stimulation of host bone marrow stromal cells by sympathetic nerves promotes breast cancer bone metastasis in mice. PLoS Biol. 2012;10:e1001363. doi: 10.1371/journal.pbio.1001363. [DOI] [PMC free article] [PubMed] [Google Scholar]
- 10.Powe DG, Voss MJ, Habashy HO, Zanker KS, Green AR, Ellis IO, et al. Alpha- and beta-adrenergic receptor (AR) protein expression is associated with poor clinical outcome in breast cancer: an immunohistochemical study. Breast Cancer Res Treat. 2011;130:457–63. doi: 10.1007/s10549-011-1371-z. [DOI] [PubMed] [Google Scholar]
- 11.Madden KS, Szpunar MJ, Brown EB. beta-Adrenergic receptors (beta-AR) regulate VEGF and IL-6 production by divergent pathways in high beta-AR-expressing breast cancer cell lines. Breast Cancer Res Treat. 2011;130:747–58. doi: 10.1007/s10549-011-1348-y. [DOI] [PMC free article] [PubMed] [Google Scholar]
- 12.Vandewalle B, Revillion F, Lefebvre J. Functional beta-adrenergic receptors in breast cancer cells. J Cancer Res Clin Oncol. 1990;116:303–6. doi: 10.1007/BF01612908. [DOI] [PubMed] [Google Scholar]
- 13.Bruzzone A, Pinero CP, Rojas P, Romanato M, Gass H, Lanari C, et al. alpha(2)-Adrenoceptors enhance cell proliferation and mammary tumor growth acting through both the stroma and the tumor cells. Curr Cancer Drug Targets. 2011;11:763–74. doi: 10.2174/156800911796191051. [DOI] [PubMed] [Google Scholar]
- 14.Nance DM, Sanders VM. Autonomic innervation and regulation of the immune system (1987–2007) Brain Behav Immun. 2007;21:736–45. doi: 10.1016/j.bbi.2007.03.008. [DOI] [PMC free article] [PubMed] [Google Scholar]
- 15.Moreaux L, Sandre O, Charpak S, Blanchard-Desce M, Mertz J. Coherent scattering in multi-harmonic light microscopy. Biophys J. 2001;80:1568–74. doi: 10.1016/S0006-3495(01)76129-2. [DOI] [PMC free article] [PubMed] [Google Scholar]
- 16.Sidani M, Wyckoff J, Xue C, Segall JE, Condeelis J. Probing the microenvironment of mammary tumors using multiphoton microscopy. J Mammary Gland Biol Neoplasia. 2006;11:151–63. doi: 10.1007/s10911-006-9021-5. [DOI] [PubMed] [Google Scholar]
- 17.Wang W, Wyckoff JB, Frohlich VC, Oleynikov Y, Huttelmaier S, Zavadil J, et al. Single cell behavior in metastatic primary mammary tumors correlated with gene expression patterns revealed by molecular profiling. Cancer Res. 2002;62:6278–88. [PubMed] [Google Scholar]
- 18.Condeelis J, Segall JE. Intravital imaging of cell movement in tumours. Nat Rev Cancer. 2003;3:921–30. doi: 10.1038/nrc1231. [DOI] [PubMed] [Google Scholar]
- 19.Burke K, Tang P, Brown E. Second harmonic generation reveals matrix alterations during breast tumor progression. J Biomed Opt. 2013;18:31106. doi: 10.1117/1.JBO.18.3.031106. [DOI] [PMC free article] [PubMed] [Google Scholar]
- 20.Kakkad SM, Solaiyappan M, Argani P, Sukumar S, Jacobs LK, Leibfritz D, et al. Collagen I fiber density increases in lymph node positive breast cancers: pilot study. J Biomed Opt. 2012;17:116017. doi: 10.1117/1.JBO.17.11.116017. [DOI] [PMC free article] [PubMed] [Google Scholar]
- 21.Conklin MW, Eickhoff JC, Riching KM, Pehlke CA, Eliceiri KW, Provenzano PP, et al. Aligned collagen is a prognostic signature for survival in human breast carcinoma. Am J Pathol. 2011;178:1221–32. doi: 10.1016/j.ajpath.2010.11.076. [DOI] [PMC free article] [PubMed] [Google Scholar]
- 22.Aslakson CJ, Miller FR. Selective events in the metastatic process defined by analysis of the sequential dissemination of subpopulations of a mouse mammary tumor. Cancer Res. 1992;52:1399–405. [PubMed] [Google Scholar]
- 23.Schildkraut JJ, Dodge GA, Logue MA. Effects of tricyclic antidepressants on the uptake and mabolism of intracisternally administered norepinephrine-H3 in rat brain. J Psychiatr Res. 1969;7:29–34. doi: 10.1016/0022-3956(69)90009-0. [DOI] [PubMed] [Google Scholar]
- 24.Glowinski J, Axelrod J. Inhibition of uptake of tritiated-noradrenaline in the intact rat brain by imipramine and structurally related compounds. Nature. 1964;204:1318–9. doi: 10.1038/2041318a0. [DOI] [PubMed] [Google Scholar]
- 25.Marjamaki A, Ala-Uotila S, Luomala K, Perala M, Jansson C, Jalkanen M, et al. Stable expression of recombinant human alpha 2-adrenoceptor subtypes in two mammalian cell lines: characterization with [3H]rauwolscine binding, inhibition of adenylate cyclase and RNase protection assay. Biochim Biophys Acta. 1992;1134:169–77. doi: 10.1016/0167-4889(92)90041-9. [DOI] [PubMed] [Google Scholar]
- 26.Eisenhofer G, Kopin IJ, Goldstein DS. Catecholamine metabolism: a contemporary view with implications for physiology and medicine. Pharmacol Rev. 2004;56:331–49. doi: 10.1124/pr.56.3.1. [DOI] [PubMed] [Google Scholar]
- 27.Egeblad M, Rasch MG, Weaver VM. Dynamic interplay between the collagen scaffold and tumor evolution. Curr Opin Cell Biol. 2010;22:697–706. doi: 10.1016/j.ceb.2010.08.015. [DOI] [PMC free article] [PubMed] [Google Scholar]
- 28.Burke RM, Madden KS, Perry SW, Zettel ML, Brown EB. Tumor-associated macrophages and stromal TNF-alpha regulate collagen structure in breast tumor models as visualize by second harmonic generation. J Biomed Optics. 2013 doi: 10.1117/1.JBO.18.8.086003. in press. [DOI] [PMC free article] [PubMed] [Google Scholar]
- 29.Bruzzone A, Pinero CP, Castillo LF, Sarappa MG, Rojas P, Lanari C, et al. Alpha2-adrenoceptor action on cell proliferation and mammary tumour growth in mice. Br J Pharmacol. 2008;155:494–504. doi: 10.1038/bjp.2008.278. [DOI] [PMC free article] [PubMed] [Google Scholar]
- 30.Vazquez SM, Mladovan AG, Perez C, Bruzzone A, Baldi A, Luthy IA. Human breast cell lines exhibit functional alpha2-adrenoceptors. Cancer Chemother Pharmacol. 2006;58:50–61. doi: 10.1007/s00280-005-0130-4. [DOI] [PubMed] [Google Scholar]
- 31.Khan ZP, Ferguson CN, Jones RM. Alpha-2 and imidazoline receptor agonists. Their pharmacology and therapeutic role. Anaesthesia. 1999;54:146–65. doi: 10.1046/j.1365-2044.1999.00659.x. [DOI] [PubMed] [Google Scholar]
- 32.Piletz JE, Zhu H, Chikkala DN. Comparison of ligand binding affinities at human I1-imidazoline binding sites and the high affinity state of alpha-2 adrenoceptor subtypes. J Pharmacol Exp Ther. 1996;279:694–702. [PubMed] [Google Scholar]
- 33.Finak G, Bertos N, Pepin F, Sadekova S, Souleimanova M, Zhao H, et al. Stromal gene expression predicts clinical outcome in breast cancer. Nat Med. 2008;14:518–27. doi: 10.1038/nm1764. [DOI] [PubMed] [Google Scholar]
- 34.DuPre SA, Hunter KW., Jr. Murine mammary carcinoma 4T1 induces a leukemoid reaction with splenomegaly: association with tumor-derived growth factors. Exp Mol Pathol. 2007;82:12–24. doi: 10.1016/j.yexmp.2006.06.007. [DOI] [PubMed] [Google Scholar]
- 35.Han X, Burke RM, Zettel ML, Tang P, Brown EB. Second harmonic properties of tumor collagen: determining the structural relationship between reactive stroma and healthy stroma. Opt Express. 2008;16:1846–59. doi: 10.1364/oe.16.001846. [DOI] [PubMed] [Google Scholar]
- 36.Williams RM, Zipfel WR, Webb WW. Interpreting second-harmonic generation images of collagen I fibrils. Biophys J. 2005;88:1377–86. doi: 10.1529/biophysj.104.047308. [DOI] [PMC free article] [PubMed] [Google Scholar]
- 37.Lacomb R, Nadiarnykh O, Townsend SS, Campagnola PJ. Phase Matching considerations in Second Harmonic Generation from tissues: Effects on emission directionality, conversion efficiency and observed morphology. Opt Commun. 2008;281:1823–32. doi: 10.1016/j.optcom.2007.10.040. [DOI] [PMC free article] [PubMed] [Google Scholar]
- 38.Diop-Frimpong B, Chauhan VP, Krane S, Boucher Y, Jain RK. Losartan inhibits collagen I synthesis and improves the distribution and efficacy of nanotherapeutics in tumors. Proc Natl Acad Sci U S A. 2011;108:2909–14. doi: 10.1073/pnas.1018892108. [DOI] [PMC free article] [PubMed] [Google Scholar]
- 39.Ingman WV, Wyckoff J, Gouon-Evans V, Condeelis J, Pollard JW. Macrophages promote collagen fibrillogenesis around terminal end buds of the developing mammary gland. Dev Dyn. 2006;235:3222–9. doi: 10.1002/dvdy.20972. [DOI] [PubMed] [Google Scholar]
- 40.Provenzano PP, Eliceiri KW, Campbell JM, Inman DR, White JG, Keely PJ. Collagen reorganization at the tumor-stromal interface facilitates local invasion. BMC Med. 2006;4:38. doi: 10.1186/1741-7015-4-38. [DOI] [PMC free article] [PubMed] [Google Scholar]
- 41.Provenzano PP, Inman DR, Eliceiri KW, Knittel JG, Yan L, Rueden CT, et al. Collagen density promotes mammary tumor initiation and progression. BMC Med. 2008;6:11. doi: 10.1186/1741-7015-6-11. [DOI] [PMC free article] [PubMed] [Google Scholar]
- 42.Sharpe CR, Collet JP, Belzile E, Hanley JA, Boivin JF. The effects of tricyclic antidepressants on breast cancer risk. Br J Cancer. 2002;86:92–7. doi: 10.1038/sj.bjc.6600013. [DOI] [PMC free article] [PubMed] [Google Scholar]
- 43.Roberts SB, Wozencraft CP, Coyne PJ, Smith TJ. Dexmedetomidine as an adjuvant analgesic for intractable cancer pain. J Palliat Med. 2011;14:371–3. doi: 10.1089/jpm.2010.0235. [DOI] [PubMed] [Google Scholar]
- 44.Ugur F, Gulcu N, Boyaci A. Intrathecal infusion therapy with dexmedetomidine-supplemented morphine in cancer pain. Acta Anaesthesiol Scand. 2007;51:388. doi: 10.1111/j.1399-6576.2006.01202.x. [DOI] [PubMed] [Google Scholar]
- 45.Powe DG, Entschladen F. Targeted therapies: Using beta-blockers to inhibit breast cancer progression. Nat Rev Clin Oncol. 2011;8:511–2. doi: 10.1038/nrclinonc.2011.123. [DOI] [PubMed] [Google Scholar]
Associated Data
This section collects any data citations, data availability statements, or supplementary materials included in this article.