

Graphical abstract
Highlights
► Treatment failure in toxoplasmosis implies the possibility of drug resistance. ► In vitro resistance to sulfadiazine detected in three strains of Toxoplasma gondii. ► Comparison of sensitive and sulfadiazine resistant strains by DIGE. ► Thirty one proteins differentially expressed between sensitive and resistant strains.
Abbreviations: EF1-α, elongation factor 1 alpha; eIF-5A, translation initiation factor 5A; ENO2, enolase 2; GRA2, dense granule protein 2; GRA7, dense granule protein 7; G3PDH, glyceraldehyde-3-phosphate dehydrogenase; Hsp70, heat shock protein 70; Hsp90, heat shock protein 90; MIC1, microneme protein 1; MIC2, microneme protein 2; PP2C, protein phosphatase 2C; ROP2, rhoptry protein 2; ROP9, rhoptry protein 9; small Hsp20, small heat shock protein 20; TgCDPK1, Toxoplasma gondii calcium-dependent protein kinase 1
Keywords: Toxoplasma gondii, Drug resistance, Sulfadiazine, DIGE
Abstract
Treatment options for toxoplasmosis in humans are generally limited to the use of sulfonamide and/or pyrimethamine-based compounds. However, there is increasing evidence for clinical therapy failures in patients suggesting the existence of drug resistance in these classes of drug. In vitro resistance to sulfadiazine has been detected in three strains of Toxoplasma gondii isolated from clinical cases. In order to begin to understand the mechanisms of resistance, we undertook a difference-gel electrophoresis (DIGE) approach combined with mass spectrometry to identify proteins that are differentially expressed in sulfadiazine-resistance strains of the parasite. Naturally resistant strains TgA 103001 (Type I), TgH 32006 (Type II) and TgH 32045 (Type II variant) were compared to sensitive strains RH (Type I) and ME-49 (Type II) using DIGE and the modulated proteins analyzed using LC–MS/MS. In total, 68 differentially expressed protein spots were analyzed by mass spectrometer and 31 unique proteins, including four hypothetical proteins, were identified. Among the differentially expressed proteins, 44% were over-expressed in resistant strains and 56% were over-expressed in sensitive strains. The virulence-associated rhoptry protein, ROP2A, was found in greater abundance in both naturally resistant Type II strains TgH 32006 and TgH 32045 compared to the sensitive strain ME-49. Enolase 2 and IMC1 were found to be in greater abundance in sensitive strains RH and ME-49, and MIC2 was found to be more abundant in the sensitive strain ME-49. Proteins regulation of ROP2, MIC2, ENO2, IMC1 and GRA7 were confirmed by Western blot analysis. In addition, gene expression patterns of ROP2, MIC2, ENO2 and IMC1 were analyzed with qRT-PCR. This study provides the first proteomics insights into sulfadiazine resistance in T. gondii resistant strains isolated from clinical cases.
1. Introduction
Toxoplasma gondii, the causative agent of toxoplasmosis, is an obligate intracellular protozoan parasite that infects more than one-third of the world’s human population. The population structure of T. gondii consists of three main clonal lineages (Types I, II and III) correlated with virulence expression in mice. Recently, a study reveal a biphasic pattern consisting of regions in the Northern Hemisphere where a few, highly clonal and abundant lineages predominate; elsewhere, and especially in portions of South America are characterized by a diverse assemblage of less common genotypes that show greater evidence of recombination (Su et al., 2012).
Most infections are asymptomatic in humans, but T. gondii can cause severe clinical diseases such as encephalitis or systemic infection in immuno-compromised patients, particularly individuals with HIV infection and in cases of congenital toxoplasmosis (Weiss and Dubey, 2009). This disease can be fatal if untreated in immuno-compromised patients and current therapeutic options for the treatment of toxoplasmosis are limited to combinations of sulfonamides and pyrimethamine. In congenital infection, treatment with this combination could improve prognosis of illness (McLeod et al., 2006). These drugs have a synergistic action on T. gondii folate synthesis by inhibiting two major enzymes: dihydropteroate synthase (DHPS) and dihydrofolate reductase (DHFR) which are essential for parasite survival and replication. Nevertheless several treatment failures have been reported for the treatment of toxoplasmic encephalitis, chorioretinitis, and congenital toxoplasmosis (Dannemann et al., 1992; Katlama et al., 1996; Torres et al., 1997; Baatz et al., 2006; Petersen, 2007). Several pharmacological parameters may contribute to these failures: malabsorption, drug intolerance, compliance or tissue diffusion. However, given the target of drugs used in the treatment of toxoplasmosis, the existence of factors of resistance or lower susceptibility depending on the parasite strain may be suspected.
Recently, Meneceur et al. (2008) evaluated the sulfadiazine susceptibilities of 17 T. gondii strains in vitro by calculating IC50 according to a method developed by Derouin and Chastang (1988). At the present time only three strains (TgA 103001 previously described as B1 (Type I strain), TgH 32006 previously described as RMS-1995-ABE (Type II strain) and TgH 32045 previously described as RMS-2001-MAU (Type II variant strain)) are resistant to sulfadiazine, as defined by an IC50 value for sulfadiazine >50 mg/l on MRC5 cells in comparison with the other strains studied which had IC50 ranging from 3 to 18.8 mg/l. No apparent correlation with strain genotype or to mutations in known drug target genes were found for these three strains (Meneceur et al., 2008). Thus, the mechanism of resistance to sulfadiazine in T. gondii remains unclear.
The use of proteomic techniques offers an excellent platform to investigate aspects of numerous biological processes, like acquired drug resistance. Thus, proteomics approaches have been demonstrated as a very powerful tool in investigating drug resistance mechanisms in several parasites, such as Trypanosoma cruzi (Andrade et al., 2008) and Leishmania spp. (Kumar et al., 2010). In the T. cruzi study, two-dimensional gel electrophoresis (2-DE) was used to analyze the differentially expressed proteins of T. cruzi with selected in vivo and in vitro resistance to benznidazole and their susceptible clones: the identification of 56 proteins among which 27 novel proteins were identified as over-expressed in the resistant phenotype, have provided valuable information for the investigation of the resistance mechanisms in T. cruzi (Andrade et al., 2008). By using 2-DE, Kumar et al. (2010) compared the proteome profile of membrane-enriched, as well as cytosolic proteins of resistant and sensitive Indian Leishmania donovani: 20 differentially expressed proteins were identified, including ABC transporters and Hsp83 already known to be implicated in the resistance mechanisms of L. donovani (Vergnes et al., 2007; Castanys-Munoz et al., 2008). Moreover, several proteomics studies have been performed on T. gondii, for example Xia et al. (2008) characterized the proteome of T. gondii tachyzoites and identified nearly one-third of the entire proteome. Nelson et al. (2008) employed a quantitative proteomic approach to investigate the modulation of host cells by T. gondii invasion; they provided evidence for global reprogramming of cell metabolism and demonstrated the intimate relationship between pathogen and host. However, none of the proteomic studies have investigated the resistance mechanisms of T. gondii to sulfadiazine.
The present study aimed to investigate differentially expressed proteins in natural sulfadiazine resistant and sensitive strains of T. gondii by using difference-gel electrophoresis (DIGE). Proteins regulation of several proteins identified in DIGE were confirmed by Western blotting. In addition, qRT-PCR was performed on some proteins identified as differentially regulated to complement results obtained from the proteomic analyses. The identification of proteins that are associated with sulfadiazine resistance will improve our understanding of the resistance mechanisms and enhance the development of new treatments of toxoplasmosis.
2. Materials and methods
2.1. Toxoplasma gondii strains
Seven strains of T. gondii tachyzoites were used in this study: RH and ENT (Type I, sensitive strain), TgA 103001 (Type I, resistant strain), ME-49 and PRU (Type II, sensitive strain), TgH 32006 (Type II, resistant strain) and TgH 32045 (defined as Type II variant, resistant strain). Indeed, this strain was phylogenetically included in the Type II cluster because of its Type II genetic background, as described by Ajzenberg et al. (2004). All strains studied were provided by the French Biological Resource Center Toxoplasma (BRC Toxoplasma, France) and are previously described (Meneceur et al., 2008). All BRC Toxoplasma strains were genotyped by using a multiplex PCR designed for multiloci strains typing with 15 microsatellites markers (Ajzenberg et al., 2010).
2.2. Cell culture
T. gondii tachyzoites were maintained on African green monkey kidney (Vero) cell monolayers (ATCC, CCL-81) at 37 °C in a 5% CO2 humidified incubator. Cells and parasites were grown in Iscove’s Modified Dulbecco’s Medium (Invitrogen) supplemented with 2% (v/v) fetal calf serum (Biowest), 1% (v/v) l-glutamine (GIBCO), and antibiotics (100 IU/mL penicillin and 0.1 mg/mL streptomycin) (GIBCO). The parasites were routinely checked for Mycoplasma spp. contamination and found to be negative using a Mycoplasma spp. real-time PCR (Ishikawa et al., 2006). Parasite growth rates varied depending on strain genotypes (Meneceur et al., 2008); host cells were infected at different parasite to cell ratio to synchronize parasite culture and to obtain extracellular parasites in 4 days for all strains studied (multiplicity of infection used in the study was (parasite:cell): 1:1 for the Type I strains, 4:1 for the Type II strains and 6:1 for the Type II variant strain). After 24 h, cells and parasites were washed once in PBS 1× (pH 7.4) to eliminate extracellular parasites. Then the intracellular multiplication of tachyzoites was observed (8–32 tachyzoites per rosace) until the fourth day post-infection when tachyzoites were harvested from culture and the Toxoplasma stage preparation was verified by qRT-PCR by using tachyzoites markers and bradyzoites markers (Supplemental data 1). Parasites used in this study were cultivated from passages 3–9 on Vero cells. For 2D-DIGE analysis, four samples of parasites came from the same cell culture passage. For qRT-PCR analysis, we used six samples: one sample came from the same passage as in 2D-DIGE and the five other samples came from additional passages. Then, parasites were separated from host cells by filtration through 3 μm polycarbonate filters (Whatman International). Tachyzoites were washed twice with PBS (pH 7.4) with centrifugation at 1500g for 20 min at 4 °C. For protein analysis, parasites were then counted, pelleted and stored at −80 °C in batches of at least of 2 × 10⁸ parasites. For each strain studied, four biological replicates were used: parasites derived from four separate flasks of the same strain. For gene expression analysis, parasites were counted and total RNA was extracted as described in Section 2.10.
2.3. Preparation of tachyzoites
Frozen tachyzoite pellets were solubilized in lysis buffer (8 M urea, 4% (w/v) CHAPS, 40 mM Tris base) containing DNase/RNase and protease inhibitors (Roche); and subjected to three rapid (2 min) cycles of freezing in liquid nitrogen/defrosting at 30 °C with vigorous vortexing. Samples were centrifuged at 13,000g for 30 min at 4 °C. Samples were then precipitated with the 2D-Clean up Kit (GE Healthcare), resuspended in 50 μL of sample buffer (8 M urea, 2% (w/v) CHAPS) and the concentration was determined using Protein assay kit (BioRad). Protein samples were minimally labeled with CyDye according to the manufacturer’s protocols (GE Healthcare). Briefly, 50 μg of sample was labeled with 400 pmol of Cy3 or Cy5 fluorochromes dissolved in DMF for 30 min at 4 °C in the dark. Labeling reactions were quenched by the addition of 10 mM lysine for 10 min at 4 °C in the dark. Four different aliquots of sensitive strains and four different aliquots of resistant strains were compared for each experiment. An internal standard was prepared by pooling equal amounts of protein from each biological sample in the experiment. This was labeled with Cy2 dye and then was included in all the gels.
2.4. DIGE
The DIGE workflow consisted in four analyzed gels, each containing one aliquot of sensitive and one aliquot of resistant strains, and one preparative gel used to pick the interest spots. A total of 150 μg of protein per gel containing the internal standard (Cy2-labeled), sensitive strain tachyzoites (Cy3-labeled for gels 1 and 2, Cy5-labeled for gels 3 and 4) and resistant strain tachyzoites (Cy5-labeled for gels 1 and 2, Cy3-labeled for gels 3 and 4) were mixed together and separated on the four 2D-gels. One gel including 300 μg of standard protein sample was used as preparative gel. The 24 cm nonlinear, pH 3–10, IPG strips (GE Healthcare) were rehydrated with 0.45 mL rehydration buffer (8 M urea, 2% (w/v) CHAPS w/v, 18 mM DTT and 2% (v/v) IPG buffer, pH 3–10) containing the 150 μg of protein. IEF was performed with an IPGphor II unit (GE Healthcare) up to a total of 65 kVh according to manufacturer’s instructions. Before the second dimension, strips were equilibrated twice in 10 mL equilibration buffer (6 M urea, 30% (v/v) glycerol, 2% (v/v) SDS, 75 mM Tris–HCl, pH 8.8), first for 15 min adding 1% (w/v) DTT and secondly for 15 min by adding 2.5% (w/v) iodoacetamide. Strips were sealed with 0.5% (w/v) agarose to 12.5% (v/v) polyacrylamide gels and proteins were separated in 1× running buffer (25 mM Tris-base, 192 mM Glycine, 0.2% (w/v) SDS) in the bottom chamber and 2× running buffer in the top chamber at 5 W/gel for 0.5 h and 17 W/gel thereafter in an Ettan Dalt Six unit (GE Healthcare).
2.5. Sypro Ruby staining
Total proteins on the preparative gel were visualized by staining with Sypro Ruby protein gel stain (Molecular Probes). The gel was fixed in 40% (v/v) methanol, 10% (v/v) acetic acid overnight at then stained in Sypro Ruby. Before scanning, the gel was washed for 1 h in 10% (v/v) methanol and 7% (v/v) acetic acid and rinsed twice in distilled water for 5 min.
2.6. Image analysis and statistics
Proteins were visualized using Ettan DIGE Imager 1.0 (GE Healthcare) with CyDye filters. For the Cy2, Cy3 and Cy5 fluorochromes, the excitation wavelengths were respectively 480/30, 540/25 and 633/30 nm and emission wavelengths were 530/40, 595/25 and 680/30 nm. All gels were scanned at 100 μm resolution. Image analysis was carried out with DeCyder 2D software version 6.5 (GE Healthcare). The DIA (differential in-gel analysis module) was used to co-detect, normalize with the internal standard from each 2D-gels and differentially quantitate the protein spots in the image. The matching of the different maps from each gel and the statistical analysis of protein variation between samples (resistant/sensitive) was performed by the BVA (Biological Variation Analysis Module) (Alban et al., 2003; Marouga et al., 2005). Protein spots which appeared in at least 9 out of 12 images with greater than 1.3-fold changes (p ⩽ 0.05, Student’s t-test) were considered as differentially expressed between strains.
2.7. In-gel tryptic digestion
Protein spots of interest were excised from the gel and gel plugs were incubated twice at 37 °C for 10 min in 50 mM ammonium bicarbonate/50% acetonitrile. Gel plugs were then dehydrated with 100% (v/v) acetonitrile at 37 °C for 15 min and rehydrated with 10 μL of 10 ng/μL sequencing grade trypsin in 25 mM ammonium bicarbonate at 37 °C for 1 h. Then, 25 mM ammonium bicarbonate was added to cover the gel pieces, which were left at 37 °C overnight. The reaction was stopped with 2 μL of 2.6 M formic acid and the samples were stored at −20 °C (Xia et al., 2008).
2.8. MS analysis (LC–MS/MS)
Mass spectrometry analyses were performed using an LTQ ion-trap mass spectrometer (Thermo Electron) coupled on-line to a Dionex Ultimate 3000 (Dionex) HPLC system equipped with a nano pepMap100 C18 reversed phase column (75 μm; 3 μm, 100 Å). Water and solvents were all HPLC grade. The column was equilibrated in 97.9% (v/v) water/2% (v/v) acetonitrile/0.1% (v/v) formic acid (FA) at a flow rate of 300 nL/min. Sample injections of 15 μL of tryptic peptides were loaded onto a C18 TRAP, desalted and washed for 3 min at a flow rate of 25 μL/min prior to being loaded onto a nano pepMap100 C18 column at 300 nL/min. The peptides were eluted at a flow rate of 300 nL/min with a linear gradient of 0–50% (v/v) acetonitrile/0.1% (v/v) FA over 30 min, followed by 80% (v/v) acetonitrile/0.1% (v/v) FA for 5 min. The column was then equilibrated in 97.9% water/2% acetonitrile/0.1% (v/v) FA for 5 min (total run time per sample was 50 min). Ionized peptides were analyzed in the mass spectrometer (0–106 m/z, global and Msx) using the “triple play” mode, consisting initially of a survey (MS) spectrum from which the three most abundant ions were determined (threshold = 200–500 TIC). Collision energy was set at 35% for 30 min. The charge state of each ion was then assigned from the C13 isotope envelope “zoom scan” and finally subjected to a third MS/MS scan. The LTQ was tuned using a 500 fmol/μL solution of glufibrinopeptide (m/z 785.5, [M = 2H]2+) and calibrated according to the manufacturer’s instructions. The resulting MS/MS spectra (data files) were merged into an mgf file, which was submitted to Mascot searching. Mascot searching was carried out on a local Mascot server against gene annotations from ToxoDB version 7.2 (http://toxodb.org/toxo/). MS/MS ion search was used to search the data output from the LTQ. Database search parameters included: fixed carbamidomethyl modification of cysteine residues; variable oxidation of methionine; a peptide tolerance of ±1.5 Da; MS/MS tolerance ±0.8 Da; +1, +2, +3 peptide charge state; and a single missed trypsin cleavage. Instrument was set as ESI-TRAP.
2.9. GO analysis
GO descriptions of the proteins identified were retrieved from ToxoDB 7.2. The remaining proteins were mapped onto UniProt DB using GI numbers to obtain GO descriptions.
2.10. Western blot analysis
Proteins of T. gondii tachyzoites were extracted with RIPA buffer. Proteins (10 μg) were separated on 12.5% SDS–PAGE, and transferred to nitrocellulose membrane. The membranes were blocked overnight at 4 °C, incubated 1 h with the primary antibody against specific proteins diluted at 1/5000 for ENO2 and IMC1 (gift from Dr. S. Tomavo), 1/2000 for GRA7 (Abbott), 1/1000 for ROP2 and MIC2 (gift from Dr. J.F. Dubremetz) and for SAG-1 (GII9, Argene Biosoft). Peroxydase-conjugated anti-rabbit or anti-mouse secondary antibodies were used (Biorad, 1/3000). SAG-1 was used as positive control in all strains used. All analysis were performed in triplicate, values are expressed as mean ± SD.
2.11. RNA extraction and qRT-PCR analysis
The Toxoplasma stage preparation was controlled through the stage-specific markers sag1, bag1 and eno1 by qRT-PCR (Supplemental data 1). These genes were chosen as bradyzoite markers (bag1 (Bohne et al., 1995) and eno1 (Holmes et al., 2010)) and tachyzoite markers (sag1 (Burg et al., 1988)). Total RNAs of each strain were extracted using the RNeasy® Mini Kit (Qiagen) according to the manufacturer’s instructions. One microgram of total RNA was reverse transcribed to cDNA using the iScript Transcription Supermix (Bio-Rad, USA) according to the manufacturer’s instructions. The qRT-PCR was performed using the IQ™ SYBER® Supermix kit (Bio-Rad) with an iCycler™ iQ real-time PCR Detection system (Bio-Rad). PCR primers (Invitrogen™ life technologies, France) were designed using ProbeFinder Version: 2.45 (Roche Applied Science) to specifically amplify sequences of rop2: 5′-TCA CGC TTC AGC TCA TAA GG-3′ (forward) and 5′-GAA AAT CGG CAT GCA CAA G-3′ (reverse); mic2: 5′-GGG GTA TGT GCT GTT GAC G-3′ (forward) and 5′-GTG GCA TTT CCG CAA GAC-3′ (reverse); eno2: 5′-GCG ACC AGA AGG GTA TTG AC-3′ (forward) and 5′-AGC CCC ACT CGT TCT TAG TTC-3′ (reverse); imc1: 5′-GAA CGC TTG CTC AAG GAG A-3′ (forward) and 5′-TTG AAG ACC TGC TCC ACC TT-3′ (reverse); and toxoplasma β-tubulin: 5′-TCT TCC GCC CTG ACA ACT TC-3′ (forward) and 5′-CCG CAC CCT CAG TGT AGT GA-3′ (reverse). The PCR profile was 3.5 min at 95 °C, 40× (15 s at 95 °C, 1 min at 60 °C) and 1 min at 80 °C.
2.12. Statistical analysis
The mRNA levels of rop2, mic2, eno2 and imc1 genes were normalized to housekeeping toxoplasma β-tubulin gene using the 2−ΔCt method. All real time qRT-PCR experiments were performed in duplicate; values are expressed as a median ± interquartile spaces (IQs) of Ct values, and analyzed using a non-parametric exact Wilcoxon–Mann–Whitney test (StatXact software, CytelSudio7). The statistically significant differences level was defined as ∗p < 0.05 and ∗∗p < 0.01.
3. Results
3.1. Identification of differentially expressed proteins
For this study, we used a 2D-DIGE approach to identify proteins associated in natural resistance mechanisms to sulfadiazine (Supplemental data 2). Protein abundance was compared between sulfadiazine sensitive and resistant strains from T. gondii with same genotype: RH versus TgA 103001 (Type I), ME-49 versus TgH 32006 (Type II) and ME-49 versus TgH 32045 (Type II variant). Protein spots which appeared with at least a 1.3-fold change (p ⩽ 0.05) between resistant and sensitive strains were used for analysis. Fourteen protein spots were identified in the Type I strain: only one of them, identified as a hypothetical protein, increased in the resistant strain TgA 103001 and 13 increased in the sensitive RH strain (Table 1). Eighteen protein spots were in different abundance in Type II strains: 17 of them were over-expressed in the resistant strain TgH 32006 and one in the sensitive strain ME-49 (Table 2). Fifteen protein spots were identified in the Type II variant strain: five of them over-expressed in TgH 32045 and 10 were over-expressed in the sensitive ME-49 strain (Table 3). However, some proteins were detected in more than one gel spot, most likely representing isoenzymes, proteins with post-translational modification or protein degradation. When the redundancy was removed, 13 unique protein identifications were acquired from the 14 spots identified from the genotype I strains (RH and TgA 103001); 10 unique protein identifications acquired from the 18 spots identified from the Type II strains (ME-49 and TgH 32006); and 12 unique protein identifications acquired from the 15 spots identified from the Type II variant strain (ME-49 and TgH 32045). In total, 31 proteins, including four hypothetical proteins, were identified from the three experiments, 44% were over-expressed in resistant strains and 56% were over-expressed in sensitive strains. Interestingly, GRA7 was identified in two gel spots and showed contradictory expression changes in these gel spots: one appearing more abundant in TgH 32045 and the other one in ME-49.
Table 1.
Identification by LC–MS/MS of T. gondii differentially expressed proteins from Type I strains: resistant strain (TgA 103001) versus sensitive strain (RH).
| Spot No. | Accession No.a | Protein name | MW/pIb | Scorec | Sequence coverage | Identified peptidesd | Average ratiose |
|---|---|---|---|---|---|---|---|
| Carbohydrate metabolism | |||||||
| 1921 | TGME49_056760 | Pyruvate kinase | 58120/6.36 | 632 | 16 | 17 | −1.74 |
| 2859 | TGME49_032350 | Lactate dehydrogenase | 36095/6.29 | 99 | 3 | 2 | −1.91 |
| 2060 | TGME49_068850 | Enolase 2 | 52765/6.84 | 266 | 10 | 6 | −1.68 |
| 2051 | TGME49_068850 | Enolase 2 | 52765/6.84 | 293 | 7 | 5 | −2.27 |
| Protein folding | |||||||
| 1484 | TGME49_073760 | Heat shock protein 70, putative | 73291/4.82 | 366 | 10 | 11 | −1.41 |
| Host cell interaction | |||||||
| 3076 | TGME49_043730 | p36 protein, ROP9 | 37986/8.37 | 380 | 13 | 11 | −1.31 |
| Others/unknown functions | |||||||
| 1967 | TGME49 061950 | ATP synthase beta chain, putative | 60107/6.86 | 382 | 6 | 6 | −1.74 |
| 1860 | TGME49_101440 | CAM kinase, CDPK family, TgCDPK1 | 65893/6.39 | 253 | 4 | 4 | −2.55 |
| 1244 | TGME49_043960 | Ras-GTPase-activating protein binding protein, putative | 84372/9.43 | 122 | 2 | 4 | −1.78 |
| 1781 | TGME49_033110 | Inosine-5’-monophosphate dehydrogenase, putative | 59409/7.07 | 323 | 15 | 12 | −1.51 |
| 1614 | TGME49 031630 | Membrane skeletal protein IMC1, putative | 50596/5.85 | 87 | 1 | 2 | −1.81 |
| 1494 | TGME49_016970 | Hypothetical protein, conserved | 69027/5.39 | 434 | 13 | 13 | −1.3 |
| 2240 | TGME49_009600 | Hypothetical protein | 50398/4.92 | 155 | 6 | 4 | −1.77 |
| 2214 | TGME49_013030 | Hypothetical protein | 35249/4.31 | 161 | 8 | 4 | 1.37 |
Gene identification in ToxoDB.
Theoretical molecular weight and pI.
MASCOT score.
Number of identified peptides.
Average volume ratio of the spots (resistant versus sensitive) with p < 0.05, Student’s t-test.
Table 2.
Identification by LC–MS/MS of T. gondii differentially expressed proteins from Type II strains: resistant strain (TgH 32006) versus sensitive strain (ME-49).
| Spot No. | Accession No.a | Protein name | MW/pIb | Scorec | Sequence coverage (%) | Identified peptidesd | Average ratiose |
|---|---|---|---|---|---|---|---|
| Carbohydrate metabolism | |||||||
| 1630 | TGME49_089690 | Glyceraldehyde-3-phosphate dehydrogenase | 36629/7.25 | 87 | 13 | 3 | 3.86 |
| 1523 | TGME49_089690 | Glyceraldehyde-3-phosphate dehydrogenase | 36629/7.25 | 181 | 13 | 3 | 1.59 |
| Host cell interaction | |||||||
| 1609 | TGME49 015780 | Rhoptry kinase family protein ROP2A | 66748/6.91 | 75 | 4 | 3 | 2.12 |
| 698 | TGME49_001780 | Microneme protein 2 | 77584/4.41 | 74 | 4 | 4 | −1.62 |
| 2148 | TGME49_027620 | 28 kDa antigen (GRA2) | 19805/10 | 64 | 18 | 11 | 1.82 |
| 2056 | TGME49_014080 | Toxofilin | 26789/10.13 | 481 | 23 | 16 | 1.43 |
| 2077 | TGME49_014080 | Toxofilin | 26789/10.13 | 167 | 12 | 4 | 1.37 |
| 1645 | TGME49_070320 | Protein Phosphatase 2C, putative | 58675/4.72 | 122 | 2 | 2 | 1.46 |
| Translation | |||||||
| 2533 | TGME49 051810 | Translation initiation factor eIF-5A, putative | 17468/5.03 | 113 | 13 | 3 | 1.49 |
| 1043 | TGME49_086420 | Elongation factor 1 alpha, putative | 49006/9.39 | 628 | 26 | 12 | 1.75 |
| 1354 | TGME49_086420 | Elongation factor 1 alpha, putative | 49006/9.39 | 249 | 12 | 6 | 2.59 |
| 1069 | TGME49_086420 | Elongation factor 1 alpha, putative | 49006/9.39 | 191 | 7 | 3 | 1.63 |
| 1362 | TGME49_086420 | Elongation factor 1 alpha, putative | 49006/9.39 | 67 | 7 | 3 | 2.29 |
| 1448 | TGME49_086420 | Elongation factor 1 alpha, putative | 49006/9.39 | 311 | 13 | 3 | 1.47 |
| 1272 | TGME49_086420 | Elongation factor 1 alpha, putative | 49006/9.39 | 107 | 10 | 5 | 1.98 |
| 1593 | TGME49_086420 | Elongation factor 1 alpha, putative | 49006/9.39 | 111 | 13 | 7 | 1.55 |
| 1848 | TGME49_062620 | Gbp1p protein, putative | 31761/9.29 | 202 | 9 | 6 | 1.45 |
| 1505 | TGME49_110640 | Uridine phosphorylase, putative | 33043/7.12 | 83 | 6 | 2 | 1.58 |
Gene identification in ToxoDB.
Theoretical molecular weight and pI.
MASCOT score.
Number of identified peptides.
Average volume ratio of the spots (resistant versus sensitive) with p < 0.05, Student’s t-test.
Table 3.
Identification by LC–MS/MS of T. gondii differentially expressed proteins from Type II variant resistant strain (TgH 32045) versus Type II sensitive strain (ME-49).
| Spot No. | Accession No.a | Protein name | MW/pIb | Scorec | Sequence coverage (%) | Identified peptidesd | Average ratiose |
|---|---|---|---|---|---|---|---|
| Carbohydrate metabolism | |||||||
| 793 | TGME49 068850 | Enolase 2 | 52765/6.84 | 95 | 4 | 3 | −1.44 |
| Host cell interaction | |||||||
| 1684 | TGME49 003310 | Dense granule protein 7 | 25919/5.06 | 88 | 4 | 2 | −1.42 |
| 2138 | TGME49 003310 | Dense granule protein 7 | 25919/5.06 | 78 | 11 | 4 | 1.59 |
| 634 | TGME49_091890 | Microneme protein 1 | 48629/4.94 | 53 | 7 | 2 | −2.22 |
| 721 | TGME49 091890 | Microneme protein 1 | 48629/4.94 | 69 | 9 | 5 | −1.42 |
| 622 | TGME49 091890 | Microneme protein 1 | 48629/4.94 | 159 | 9 | 7 | −1.49 |
| 560 | TGME49_001780 | Microneme protein 2 | 77584/4.41 | 81 | 2 | 2 | −2.03 |
| 1760 | TGVEG 030040 | Rhoptry kinase family protein ROP2A | 66748/6.91 | 68 | 2 | 2 | 1.51 |
| 832 | TGME49_033480 SRS29C (=SRS2, p35) | 39120/7.3 | 72 | 3 | 6 | −2.36 | |
| Protein folding | |||||||
| 2200 | TGME49_032940 | Small heat shock protein 20, putative | 21035/5.36 | 88 | 14 | 5 | 1.31 |
| 839 | TGME49 044560 | Heat shock protein 90, putative | 96824/4.7 | 65 | 6 | 4 | −2.96 |
| Others/unknown functions | |||||||
| 1318 | TGME49 031630 | Membrane skeletal protein IMC1, putative | 50172/5.85 | 302 | 5 | 6 | −2.04 |
| 2330 | TGME49 014790 | Mitochondrial glycoprotein domain containing protein | 31444/4.39 | 52 | 3 | 2 | 1.42 |
| 2366 | TGME49_077240 | Nucleoside triphosphatase I | 69157/6.21 | 151 | 10 | 9 | 2.23 |
| 2317 | TGME49_058870 | Hypothetical protein | 61948/4.65 | 125 | 3 | 2 | −1.32 |
Gene identification in ToxoDB.
Theoretical molecular weight and pI.
MASCOT score.
Number of identified peptides.
Average volume ratio of the spots (resistant versus sensitive) with p < 0.05, Student’s t-test.
3.2. Gene ontology analysis of the identified proteins
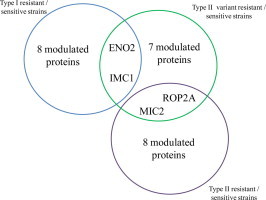
The 27 identified proteins (excluding hypothetical proteins) were annotated by GO analysis. Modulated proteins were classified into five functional groups (Fig. 1) such as carbohydrate metabolism (four proteins: pyruvate kinase, lactate dehydrogenase, ENO2 and G3PDH), host cell interaction (nine proteins: ROP9, ROP2A, MIC1, MIC2, GRA2, GRA7, Toxofilin, PP2C and SRS29C), translation (two proteins: eIF-5A and EF1-α), protein folding (three proteins: small Hsp20, Hsp70 and Hsp90) and nine proteins as the group others/unknown functions. None of the proteins identified were found in all three of the experiments but four proteins were common to two of the strain comparisons. For example, ENO2 and IMC1 are under-expressed in the resistant strains TgA 103001 (Type I) and TgH 32045 (Type II variant) in comparison to the sensitive strains RH and ME-49. MIC2 is under-expressed in the Type II resistant strains, TgH 32006 and TgH 32045, in comparison to the sensitive strain ME-49 while ROP2A is over-expressed in TgH 32006 and TgH 32045 than in ME-49.
Fig. 1.
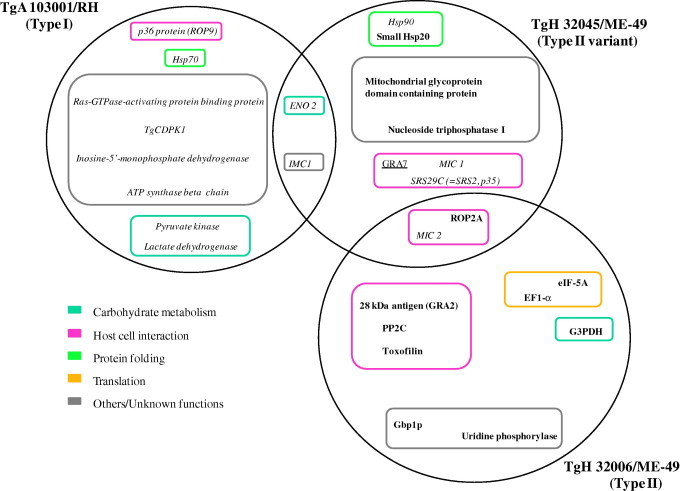
View of protein expression sets identified as differentially regulated in three comparative strains comparison (without hypothetical proteins). Modulated proteins are shown for each resistant isolate compared to either RH or ME-49 sensitive parasites. Protein function is indicated by colored boxes. Intersections show protein changes identified which were common to each resistant isolate. Proteins over-expressed in resistant strains (TgA 103001, TgH 32045 and TgH 32006) are written in bold. Proteins under-expressed in resistant strains are written in italics. Proteins identified in multiple gel spots and showing contradictory expression changes in different gel spots are underlined.
3.3. Confirmation of protein regulation by Western blotting
We confirmed by Western blotting proteins regulation of several proteins identified in DIGE: ENO2, IMC1, ROP2, MIC2 and GRA7 in the different strains studied. We also analyzed these proteins regulation in two others sensitive strains of genotype I (ENT) and genotype II (PRU) (Fig. 2). As shown in DIGE, ENO2 and IMC1 were up-regulated in the two sensitive strains RH and ME-49 but also in the two others sensitive strains ENT and PRU in comparison to the three resistant strains. ROP2 was shown over-expressed in the two genotype II resistant strains TgH 32006 and TgH 32045 in DIGE experiments. We observed, in Western blot, the same results as DIGE for the active form of ROP2 for TgH 32006 only. The precursor form showed a down-regulation. However the mass spectrometry is not able to determine the precursor or the active form of the protein identified. For MIC2 we observed the same results as DIGE for the active form of the protein. Results obtained with TgH 32045 are questionable. In fact, TgH 32045 is a strain which presents genetic recombination and deletion for some genes, e.g. gra7 (GenBank Accession No. DQ465955). So we can hypothesize that antibodies used cannot recognize the protein epitope. GRA7 protein showed an up-regulation in the Type II sensitive strains in comparison to the Type II resistant strains. The two sensitive strains of same genotype have shown the same protein regulation for the protein studied.
Fig. 2.
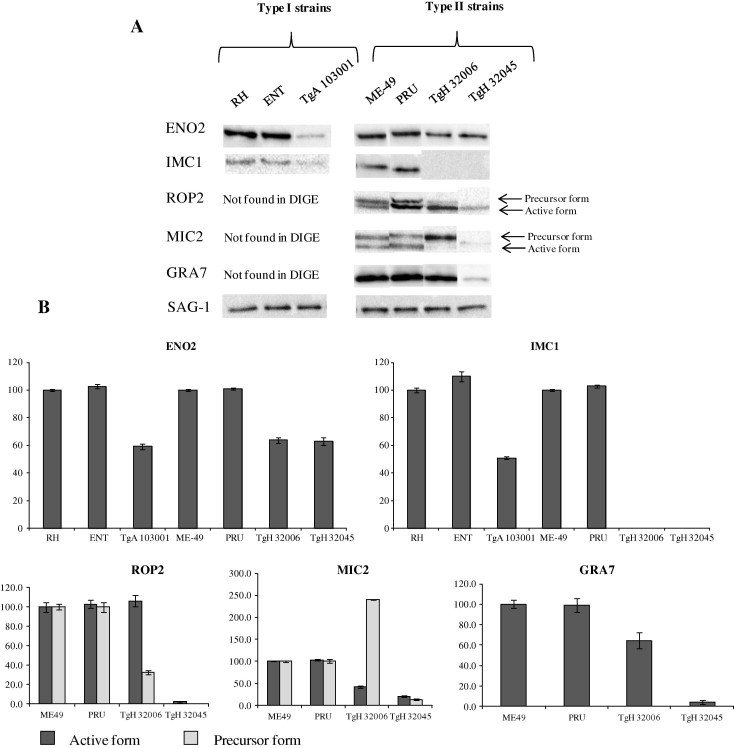
Analysis by Western blot of ENO2, IMC1, ROP2, MIC2 and GRA7 modulation in T. gondii sulfadiazine sensitive (RH and ENT (Type I), ME-49 and PRU (Type II)) and resistant strains (TgA103001 (Type I), TgH 32006(Type II) and TgH 32045(Type II variant)) (A) and corresponding densitometry analysis (B). SAG-1 was used as positive control in all strains used. All Western blot analysis were performed in triplicate, values are expressed as mean ± SD.
3.4. Confirmation of differentially expressed proteins at the mRNA level
In order to verify the Toxoplasma stage preparation, gene expression levels of sag1 (tachyzoites markers) bag1 and eno1 (bradyzoites markers) were analyzed by qRT-PCR. Our results showed that only sag1 gene expression was highly expressed for all strains studied (Supplemental data 1), this confirms the presence of only tachyzoites in our samples. Then, to confirm the differential expression of proteins common to two of the strain comparisons, gene expression levels of rop2, mic2, eno2 and imc1 were determined by qRT-PCR (Fig. 3). For the Type II strains, the results showed that the transcription levels of rop2 (significant at p < 0.01) (Fig. 3A) and eno2 (significant at p < 0.05) (Fig. 3C) were consistent with the protein levels identified by DIGE. For the Type I strains, ROP2 and MIC2 proteins were not identified as differentially expressed by DIGE but their gene expression levels were significantly (p < 0.01) more abundant in the resistant strain TgA 103301 (Fig. 3A and B); eno2 gene showed different expression patterns between the transcription and protein expression levels (Fig. 3C): ENO2 protein was more expressed in the sensitive strain RH while eno2 expression level is significantly reduced in the RH strain (p < 0.01). No modulation of imc1 gene expression was observed between sensitive and resistant strain whichever the genotype (Fig. 3D).
Fig. 3.
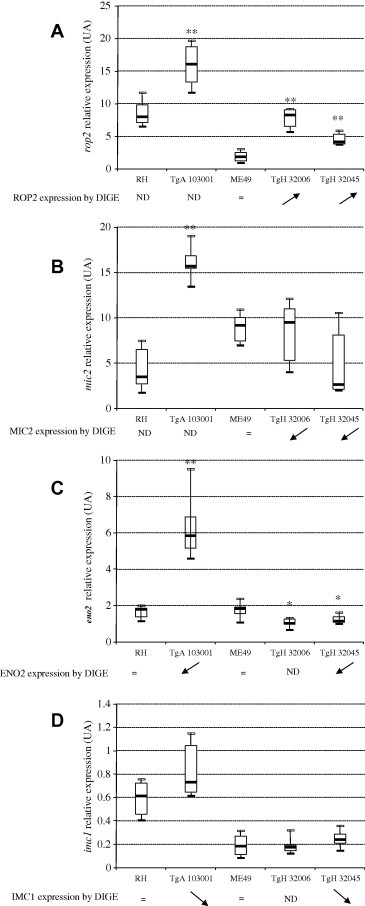
Relative expression of rop2, mic2, eno2 and imc1 genes by real-time qRT-PCR analysis. The mRNA levels of rop2, mic2, eno2 and imc1 genes were normalized to housekeeping toxoplasma β-tubulin gene. Results are representative of six independent experiments and presented as median ± interquartile space (IQs) of relative variation of Ct values between RH/TgA 103001strains, ME-49/TgH 32006 strains and ME-49/TgH32045 strains. ∗p < 0.05 and ∗∗p < 0.01 represent significant difference between strains (non-parametric exact Wilcoxon–Mann–Whitney test). ND: not determined.
4. Discussion
There is increasing evidence for the emergence of strains of T. gondii that are resistant to treatment with sulfonamide and/or pyrimethamine-based compounds. In collaboration with Meneceur et al. (2008), we have recently isolated three strains of T. gondii resistant to sulfadiazine. As there is no apparent correlation with strain genotype or to mutations in drug target genes, in this study we used a proteomics approach to investigate the basis of drug resistance in these resistant strains.
We identified 31 unique proteins, including four hypothetical proteins, differentially expressed between resistant and sensitive strains to sulfadiazine. Some of the proteins which exhibited modulation between resistant and sensitive parasites were associated with carbohydrate metabolism (G3PDH, ENO2, lactate dehydrogenase and pyruvate kinase). These four proteins are involved in the glycolysis mechanism that plays important roles in stage conversion in Toxoplasma (Tomavo, 2001) and in the closely related protozoan parasite Neospora caninum (Marugán-Hernández et al., 2010). Here, the purity of Toxoplasma stage preparation was controlled through the stage-specific markers SAG1, BAG1 and ENO1 (Supplemental data 1). Moreover, several proteins identified in this study were previously found as markers of the tachyzoite stage: p36 protein (ROP9) (Reichmann et al., 2002) and ENO2 (Tomavo, 2001) exclusively expressed in tachyzoites.
Among the differentially expressed proteins, a notable contribution of ENO2 has been reported in methotrexate resistance, an antifolate drug used in the treatment of cancer and autoimmune diseases (Selga et al., 2008). Kumar et al. (2010), in Leishmanaia donovani, have shown the over expression of ENO2 in antimony derived resistant strains (sodium antimony gluconate, an anti-leishmanial drug). In this study, we found that ENO2 was over-expressed in the two sensitive strains which could show a difference in pathways of the drug resistance mechanisms between these parasites. It has been proposed that differential expression of enolase in protozoan parasites may serve as a strategy for these parasites to adapt to different environmental conditions (Kibe et al., 2005).
In the present work, three heat shock proteins were identified to be differentially expressed in resistant and sensitive strains: small Hsp20, Hsp70 and Hsp90. HSPs are a family of proteins induced in many disease processes. In protozoan systems, a link between HSP and development and intracellular survival has been established (Shonhai, 2010). Hsp70 and Hsp90 were found more expressed in the sensitive strains; this could be explained by the higher necessity of the sensitive strains to facilitate the protein folding.
Moreover, we identified many proteins with differential expression which were associated with host cell interaction. In T. gondii, MIC proteins, including MIC1 and MIC2 identified in this study, are implicated in cellular processes including gliding motility, active cell invasion and migration (Carruthers and Tomley, 2008). Toxofilin is an actin binding protein which is associated with PP2C and secreted into host cells during invasion (Jan et al., 2007), although the main role of toxofilin remains unclear (Lodoen et al., 2010). T. gondii dense granule proteins participate in the modification of the parasitophorous vacuole (PV), which provides an unusual and highly specialized environment for parasite growth and development (Smith, 1995). Previous studies have shown that GRA2, a dense granule protein of T. gondii plays a role in protein trafficking to the dense granules, secretion into the vacuole, association with vacuolar membranes, induction of the membranous nanotubular network formation and organization of the parasites within the vacuole (Travier et al., 2008) and in this study the abundance of 28 kDa antigen (GRA2) was higher in the resistant strain TgH 32006 compared to the sensitive strain. Another dense granule protein, GRA7, was identified from two separate gel spots with fluctuating expression in the comparison between TgH 32045 and ME-49. This would suggest that post-translational modification or processing generated the modulation observed. This modulation of GRA7 alongside an increase in NTPase I within the TgH 32045 strain is interesting as both of these proteins are known to play a role in the virulence of T. gondii tachyzoites (Nischik et al., 2001; Choi et al., 2010). Our results indicated that SRS29C protein (=SRS2, p35), a SAG-1 Related Sequence member, was over-expressed in the sensitive strain ME-49. SRS2 protein was also found to be highly abundant in the ME-49 strain in comparison to the highly virulent strain RH but the correlation with virulence is unknown (Manger et al., 1998).
In toxoplasmosis treatment, sulfonamides inhibit parasite replication by interfering in folate synthesis and also in purine biosynthesis. Indeed, folic acid is an important cofactor in purine biosynthesises. IMP dehydrogenase (IMPDH) is an enzyme which catalyzes the NAD-dependent conversion of IMP to XMP in the de novo purine nucleotide synthetic pathway. IMPDH was shown to be increased significantly in cancer cells and therefore considered to be a sensitive target for cancer chemotherapy (Franchetti and Grifantini, 1999), but also for T. gondii (Sullivan et al., 2005), and C. parvum (Sharling et al., 2010).
In this study we used a 2-DE approach to analyze proteome changes. However, visualization of membrane proteins in 2-DE gels is poor which limits our observation of proteins such as ABC transporters, or hydrophobic proteins like the ROP2-8 family (Ajioka and Soldati, 2007) due to their poor solubility (Rabilloud et al., 2010). Moreover, the solubilization protocol used in this study was not adapted for membrane proteins which require a carefully balanced hydrophilic and lipophilic environment (Rabilloud, 2009).
Nevertheless, clear differential protein expression was observed in resistant strains and by comparing results between themselves, several protein changes were common to more than one isolate. ROP2A and MIC2 were found to be modulated in both TgH 32006/ME-49 and TgH 32045/ME-49; ENO2 and IMC1 were found regulated in both TgA 103001/RH and TgH 32045/ME-49. The comparison of the protein expression with gene expression reveals some interesting discrepancies. Gene expression levels of rop2 and eno2 were consistent with their protein expression (results of DIGE) for Type II strain. No modulation of imc1 gene expression was observed between sensitive and resistant strain whichever the genotype. On the other hand, gene expression of eno2 was contradictory with protein expression in Type I strains, this may be due to post-translational modifications or protein degradation. Moreover eno2 and mic2 expression levels were increased in the resistant Type I strain but not in the two resistant Type II strains, indicating that resistant mechanisms could be different among the strain genotype. In order to examine the intimate and complex relationship between transcription and translation, Wastling et al. (2009) reviewed advances in proteomic and transcriptomic in the Apicomplexa and many discrepancies between these types of data were highlighted. Indeed, numerous studies showed the presence of proteomic evidence and little or no mRNA expression evidence (detected by ESTs or microarrays) in the same analysis and vice versa. It is known that certain types of proteins may be under-represented in proteomic analysis due to their physicochemical composition, low levels of expression or high rates of turn-over and degradation.
One important point, of this study, is the possibility of variation in proteins levels due to strain to strain variation between parasites. Indeed in this study we compared proteomes of sensitive and resistant T. gondii strains from same genotype in order to identify sulfadiazine resistance mechanisms, and we found several proteins regulated in different abundance. However, no comparison by DIGE was presented here between two sulfadiazine sensitive strains of same genotype. Nevertheless, we confirmed by Western blotting proteins regulation of several interesting proteins identified in DIGE (ENO2, IMC1, ROP2, MIC2 and GRA7) in the different strains studied. We also analyzed these proteins regulation in two others sensitive strains of genotype I (ENT) and genotype II (PRU), and we found the same results as in DIGE. However, we cannot exclude that differentially expressed proteins identified in our study may be due to strain to strain variation and not only to sulfadiazine resistance. Further proteomic studies using strains of T. gondii where sulfadiazine resistance has been induced by in vitro methods are also warranted.
In conclusion, we have identified 31 proteins which are differentially modulated between sulfadiazine resistant and sensitive strains of T. gondii according to their genotype. These proteins were predicted to be involved in several different mechanisms such as carbohydrate metabolism, host cell interaction and protein translation. Although none of them allow us to identify directly resistance mechanisms to sulfadiazine at this stage, several of these proteins represent encouraging potential targets to be followed-up.
Acknowledgments
We thank Dr. S. Tomavo (University Lille, France) for his helpful discussion and providing ENO2 and IMC1 antibodies, and we thank Dr. J.F. Dubremetz (University Montpellier, France) for providing MIC2 and ROP2 antibodies. This research was funded by a grant from Region Champagne-Ardenne and Roche Laboratory, which was awarded to C. Doliwa for completion of a doctorate degree. We thank the BRC Toxoplasma for providing strains of this work and the Proteomics and Functional Genomics Group, University of Liverpool, for their contribution to proteomic instrumentation support.
Footnotes
This is an open-access article distributed under the terms of the Creative Commons Attribution-NonCommercial-ShareAlike License, which permits non-commercial use, distribution, and reproduction in any medium, provided the original author and source are credited.
Appendix A. Supplementary data
The file contains supplemental data 1 and 2.
References
- Ajioka J.W., Soldati D. Horizon Biosciences; Norfolk: 2007. Toxoplasma Molecular and Cellular Biology. [Google Scholar]
- Ajzenberg D., Bañuls A.L., Su C., Dumètre A., Demar M., Carme B., Dardé M.L. Genetic diversity, clonality and sexuality in Toxoplasma gondii. Int. J. Parasitol. 2004;34(10):1185–1196. doi: 10.1016/j.ijpara.2004.06.007. [DOI] [PubMed] [Google Scholar]
- Ajzenberg D., Collinet F., Mercier A., Vignoles P., Dardé M.L. Genotyping of Toxoplasma gondii isolates with 15 microsatellite markers in a single multiplex PCR assay. J. Clin. Microbiol. 2010;48(12):4641–4645. doi: 10.1128/JCM.01152-10. [DOI] [PMC free article] [PubMed] [Google Scholar]
- Alban A., David S.O., Bjorkesten L., Andersson C., Sloge E., Lewis S., Currie I. A novel experimental design for comparative two-dimensional gel analysis: two-dimensional difference gel electrophoresis incorporating a pooled internal standard. Proteomics. 2003;3:36–44. doi: 10.1002/pmic.200390006. [DOI] [PubMed] [Google Scholar]
- Andrade H.M., Murta S.M., Chapeaurouge A., Perales J., Nirdé P., Romanha A.J. Proteomic analysis of Trypanosoma cruzi resistance to Benznidazole. J. Proteome Res. 2008;7(6):2357–2367. doi: 10.1021/pr700659m. [DOI] [PubMed] [Google Scholar]
- Baatz H., Mirshahi A., Puchta J., Gumbel H., Hattenbach L.O. Reactivation of Toxoplasma retinochoroiditis under atovaquone therapy in an immunocompetent patient. Ocul. Immunol. Inflamm. 2006;14:185–187. doi: 10.1080/09273940600659740. [DOI] [PubMed] [Google Scholar]
- Bohne W., Gross U., Ferguson D.J., Heesemann J. Cloning and characterization of a bradyzoite-specifically expressed gene (hsp30/bag1) of Toxoplasma gondii, related to genes encoding small heat-shock proteins of plants. Mol. Microbiol. 1995;16(6):1221–1230. doi: 10.1111/j.1365-2958.1995.tb02344.x. [DOI] [PubMed] [Google Scholar]
- Burg J.L., Perelman D., Kasper L.H., Ware P.L., Boothroyd J.C. Molecular analysis of the gene encoding the major surface antigen of Toxoplasma gondii. J. Immunol. 1988;141(10):3584–3591. [PubMed] [Google Scholar]
- Carruthers V.B., Tomley F.M. Microneme proteins in apicomplexans. Subcell. Biochem. 2008;47:33–45. doi: 10.1007/978-0-387-78267-6_2. [DOI] [PMC free article] [PubMed] [Google Scholar]
- Castanys-Munoz E., Perez-Victoria J.M., Gamarro F., Castanys S. Characterization of an ABCG-like transporter from the protozoan parasite Leishmania with a role in drug resistance and transbilayer lipid movement. Antimicrob. Agents Chemother. 2008;52(10):3573–3579. doi: 10.1128/AAC.00587-08. [DOI] [PMC free article] [PubMed] [Google Scholar]
- Choi S.H., Kim T.Y., Park S.G., Cha G.H. Proteomic analysis of Toxoplasma gondii KI-1 tachyzoites. Korean J. Parasitol. 2010;48(3):195–201. doi: 10.3347/kjp.2010.48.3.195. [DOI] [PMC free article] [PubMed] [Google Scholar]
- Dannemann B., McCutchan J.A., Israelski D., Antoniskis D., Leport C., Luft B., Nussbaum J., Clumeck N., Morlat P., Chiu J., Vilde J.L., Orellana M., Feigal D., Bartok A., Heseltine P., Leedom J., Remington J. Treatment of toxoplasmic encephalitis in patients with AIDS. A randomized trial comparing pyrimethamine plus clindamycin to pyrimethamine plus sulfadiazine. Ann. Intern. Med. 1992;116(1):33–43. doi: 10.7326/0003-4819-116-1-33. [DOI] [PubMed] [Google Scholar]
- Derouin F., Chastang C. Enzyme immunoassay to assess effect of antimicrobial agents on Toxoplasma gondii in tissue culture. Antimicrob. Agents Chemother. 1988;32(3):303–307. doi: 10.1128/aac.32.3.303. [DOI] [PMC free article] [PubMed] [Google Scholar]
- Franchetti P., Grifantini M. Nucleoside and non-nucleoside IMP dehydrogenase inhibitors as antitumor and antiviral agents. Curr. Med. Chem. 1999;6(7):599–614. [PubMed] [Google Scholar]
- Holmes M., Liwak U., Pricop I., Wang X., Tomavo S., Ananvoranich S. Silencing of tachyzoite enolase 2 alters nuclear targeting of bradyzoite enolase 1 in Toxoplasma gondii. Microbes Infect. 2010;12(1):19–27. doi: 10.1016/j.micinf.2009.09.010. [DOI] [PubMed] [Google Scholar]
- Ishikawa Y., Kozakai T., Morita H., Saida K., Oka S., Masuo Y. Rapid detection of mycoplasma contamination in cell cultures using SYBR green-based real-time polymerase chain reaction. In Vitro Cell. Dev. Biol. Anim. 2006;42(3–4):63–69. doi: 10.1290/0505035.1. [DOI] [PubMed] [Google Scholar]
- Jan G., Delorme V., David V., Revenu C., Rebollo A., Cayla X., Tardieux I. The toxofilin-actin-PP2C complex of Toxoplasma: identification of interacting domains. Biochem. J. 2007;401(3):711–719. doi: 10.1042/BJ20061324. [DOI] [PMC free article] [PubMed] [Google Scholar]
- Katlama C., Mouthon B., Gourdon D., Lapierre D., Rousseau F. Atovaquone as long-term suppressive therapy for toxoplasmic encephalitis in patients with AIDS and multiple drug intolerance. AIDS. 1996;10(10):1107–1112. [PubMed] [Google Scholar]
- Kibe M.K., Coppin A., Dendouga N., Oria G., Meurice E., Mortuaire M., Madec E., Tomavo S. Transcriptional regulation of two stage-specifically expressed genes in the protozoan parasite Toxoplasma gondii. Nucleic Acids Res. 2005;33(5):1722–1736. doi: 10.1093/nar/gki314. [DOI] [PMC free article] [PubMed] [Google Scholar]
- Kumar A., Sisodia B., Misra P., Sundar S., Shasany A.K., Dube A. Proteome mapping of overexpressed membrane-enriched and cytosolic proteins in sodium antimony gluconate (SAG) resistant clinical isolate of Leishmania donovani. Br. J. Clin. Pharmacol. 2010;70(4):609–617. doi: 10.1111/j.1365-2125.2010.03716.x. [DOI] [PMC free article] [PubMed] [Google Scholar]
- Lodoen M.B., Gerke C., Boothroyd J.C. A highly sensitive FRET-based approach reveals secretion of the actin-binding protein toxofilin during Toxoplasma gondii infection. Cell. Microbiol. 2010;12(1):55–66. doi: 10.1111/j.1462-5822.2009.01378.x. [DOI] [PMC free article] [PubMed] [Google Scholar]
- Manger I.D., Hehl A.B., Boothroyd J.C. The surface of Toxoplasma tachyzoites is dominated by a family of glycosylphosphatidylinositol-anchored antigens related to SAG1. Infect. Immun. 1998;66(5):2237–2244. doi: 10.1128/iai.66.5.2237-2244.1998. [DOI] [PMC free article] [PubMed] [Google Scholar]
- Marouga R., David S., Hawkins E. The development of the DIGE system: 2D fluorescence difference gel analysis technology. Anal. Bioanal. Chem. 2005;382(3):669–678. doi: 10.1007/s00216-005-3126-3. [DOI] [PubMed] [Google Scholar]
- Marugán-Hernández V., Alvarez-García G., Risco-Castillo V., Regidor-Cerrillo J., Ortega-Mora L.M. Identification of Neospora caninum proteins regulated during the differentiation process from tachyzoite to bradyzoite stage by DIGE. Proteomics. 2010;10(9):1740–1750. doi: 10.1002/pmic.200900664. [DOI] [PubMed] [Google Scholar]
- McLeod R., Boyer K., Karrison T., Kasza K., Swisher C., Roizen N., Jalbrzikowski J., Remington J., Heydemann P., Noble A.G., Mets M., Holfels E., Withers S., Latkany P., Meier P., Toxoplasmosis Study Group Outcome of treatment for congenital toxoplasmosis, 1981–2004: the National Collaborative Chicago-Based, Congenital Toxoplasmosis Study. Clin. Infect. Dis. 2006;42(10):1383–1394. doi: 10.1086/501360. [DOI] [PubMed] [Google Scholar]
- Meneceur P., Bouldouyre M.A., Aubert D., Villena I., Menotti J., Sauvage V., Garin J.F., Derouin F. In vitro susceptibility of various genotypic strains of Toxoplasma gondii to pyrimethamine, sulfadiazine, and atovaquone. Antimicrob. Agents Chemother. 2008;52(4):1269–1277. doi: 10.1128/AAC.01203-07. [DOI] [PMC free article] [PubMed] [Google Scholar]
- Nelson M.M., Jones A.R., Carmen J.C., Sinai A.P., Burchmore R., Wastling J.M. Modulation of the host cell proteome by the intracellular apicomplexan parasite Toxoplasma gondii. Infect. Immun. 2008;76(2):828–844. doi: 10.1128/IAI.01115-07. [DOI] [PMC free article] [PubMed] [Google Scholar]
- Nischik N., Schade B., Dytnerska K., Długońska H., Reichmann G., Fischer H.G. Attenuation of mouse-virulent Toxoplasma gondii parasites is associated with a decrease in interleukin-12-inducing tachyzoite activity and reduced expression of actin, catalase and excretory proteins. Microbes Infect. 2001;3(9):689–699. doi: 10.1016/s1286-4579(01)01425-3. [DOI] [PubMed] [Google Scholar]
- Petersen E. Prevention and treatment of congenital toxoplasmosis. Expert Rev. Anti Infect. Ther. 2007;5(2):285–293. doi: 10.1586/14787210.5.2.285. [DOI] [PubMed] [Google Scholar]
- Rabilloud T. Membrane proteins and proteomics: love is possible, but so difficult. Electrophoresis. 2009;1:S174–S180. doi: 10.1002/elps.200900050. [DOI] [PubMed] [Google Scholar]
- Rabilloud T., Chevallet M., Luche S., Lelong C. Two-dimensional gel electrophoresis in proteomics: past, present and future. J. Proteomics. 2010;73(11):2064–2077. doi: 10.1016/j.jprot.2010.05.016. [DOI] [PubMed] [Google Scholar]
- Reichmann G., Długońska H., Fischer H.G. Characterization of TgROP9 (p36), a novel rhoptry protein of Toxoplasma gondii tachyzoites identified by T cell clone. Mol. Biochem. Parasitol. 2002;119(1):43–54. doi: 10.1016/s0166-6851(01)00397-8. [DOI] [PubMed] [Google Scholar]
- Selga E., Morales C., Noé V., Peinado M.A., Ciudad C.J. Role of Caveolin 1, E-Cadherin, Enolase 2 and PKCalpha on resistance to methotrexate in human HT29 colon cancer cells. BMC Med. Genomics. 2008;1:35. doi: 10.1186/1755-8794-1-35. [DOI] [PMC free article] [PubMed] [Google Scholar]
- Sharling L., Liu X., Gollapalli D.R., Maurya S.K., Hedstrom L., Striepen B. A screening pipeline for antiparasitic agents targeting Cryptosporidium inosine monophosphate dehydrogenase. PLoS Negl. Trop. Dis. 2010;4(8):e794. doi: 10.1371/journal.pntd.0000794. [DOI] [PMC free article] [PubMed] [Google Scholar]
- Shonhai A. Plasmodial heat shock proteins: targets for chemotherapy. FEMS Immunol. Med. Microbiol. 2010;58(1):61–74. doi: 10.1111/j.1574-695X.2009.00639.x. [DOI] [PubMed] [Google Scholar]
- Smith J.E. A ubiquitous intracellular parasite: the cellular biology of Toxoplasma gondii. Int. J. Parasitol. 1995;25(11):1301–1309. doi: 10.1016/0020-7519(95)00067-c. [DOI] [PubMed] [Google Scholar]
- Su C., Khan A., Zhou P., Majumdar D., Ajzenberg D., Dardé M.L., Zhu X.Q., Ajioka J.W., Rosenthal B.M., Dubey J.P., Sibley L.D. Globally diverse Toxoplasma gondii isolates comprise six major clades originating from a small number of distinct ancestral lineages. Proc. Natl. Acad. Sci. USA. 2012;109(15):5844–5849. doi: 10.1073/pnas.1203190109. [DOI] [PMC free article] [PubMed] [Google Scholar]
- Sullivan W.J., Dixon S.E., Li C., Striepen B., Queener S.F. IMP dehydrogenase from the protozoan parasite Toxoplasma gondii. Antimicrob. Agents Chemother. 2005;49(6):2172–2179. doi: 10.1128/AAC.49.6.2172-2179.2005. [DOI] [PMC free article] [PubMed] [Google Scholar]
- Tomavo S. The differential expression of multiple isoenzyme forms during stage conversion of Toxoplasma gondii: an adaptive developmental strategy. Int. J. Parasitol. 2001;31(10):1023–1031. doi: 10.1016/s0020-7519(01)00193-x. [DOI] [PubMed] [Google Scholar]
- Torres R.A., Weinberg W., Stansell J., Leoung G., Kovacs J., Rogers M., Scott J. Atovaquone for salvage treatment and suppression of toxoplasmic encephalitis in patients with AIDS. Clin. Infect. Dis. 1997;24(3):422–429. doi: 10.1093/clinids/24.3.422. [DOI] [PubMed] [Google Scholar]
- Travier L., Mondragon R., Dubremetz J.F., Musset K., Mondragon M., Gonzalez S., Cesbron-Delauw M.F., Mercier C. Functional domains of the Toxoplasma GRA2 protein in the formation of the membranous nanotubular network of the parasitophorous vacuole. Int. J. Parasitol. 2008;38(7):757–773. doi: 10.1016/j.ijpara.2007.10.010. [DOI] [PubMed] [Google Scholar]
- Vergnes B., Gourbal B., Girard I., Sundar S., Drummelsmith J., Ouellette M. A proteomics screen implicates HSP83 and a small kinetoplastid calpain-related protein in drug resistance in Leishmania donovani clinical field isolates by modulating drug-induced programmed cell death. Mol. Cell. Proteomics. 2007;6:88–101. doi: 10.1074/mcp.M600319-MCP200. [DOI] [PubMed] [Google Scholar]
- Wastling J.M., Xia D., Sohal A., Chaussepied M., Pain A., Langsley G. Proteomes and transcriptomes of the apicomplexa – where’s the message? Int. J. Parasitol. 2009;39(2):135–143. doi: 10.1016/j.ijpara.2008.10.003. [DOI] [PubMed] [Google Scholar]
- Weiss L.M., Dubey J.P. Toxoplasmosis: a history of clinical observations. Int. J. Parasitol. 2009;39(8):895–901. doi: 10.1016/j.ijpara.2009.02.004. [DOI] [PMC free article] [PubMed] [Google Scholar]
- Xia D., Sanderson S.J., Jones A.R., Prieto J.H., Yates J.R., Bromley E., Tomley F.M., Lal K., Sinden R.E., Brunk B.P., Roos D.S., Wastling J.M. The proteome of Toxoplasma gondii: integration with the genome provides novel insights into gene expression and annotation. Genome Biol. 2008;9(7):R116. doi: 10.1186/gb-2008-9-7-r116. [DOI] [PMC free article] [PubMed] [Google Scholar]
Associated Data
This section collects any data citations, data availability statements, or supplementary materials included in this article.
Supplementary Materials
The file contains supplemental data 1 and 2.