

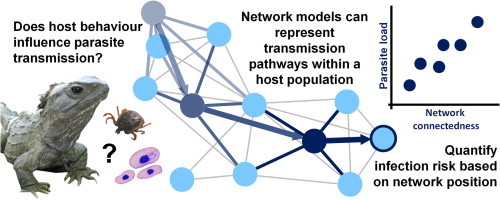
Graphical abstract
Keywords: Animal behaviour, Ecology, Social network, Conservation, Sociality, Male-bias parasite burdens, Parasite transmission
Highlights
-
•
Animal behaviour can generate heterogeneities in parasite transmission.
-
•
Network models represent these heterogeneities as links (edges) among hosts (nodes).
-
•
Variety of lifecycles and transmission methods can be represented using networks.
-
•
Framework for exploring a range of ecological questions about parasite transmission.
-
•
Challenges remain in their application to wildlife parasitology.
Abstract
Social network analysis has recently emerged as a popular tool for understanding disease transmission in host populations. Although social networks have most extensively been applied to modelling the transmission of diseases through human populations, more recently the method has been applied to wildlife populations. The majority of examples from wildlife involve modelling the transmission of contagious microbes (mainly viruses and bacteria), normally in context of understanding wildlife disease epidemics. However, a growing number of studies have used networks to explore the ecology of parasite transmission in wildlife populations for a range of endemic parasites representing a diversity of life cycles and transmission methods. This review addresses the application of network models in representing the transmission of parasites with more complex life cycles, and illustrates the way in which this approach can be used to answer ecological questions about the transmission of parasites in wildlife populations.
1. Introduction
Social network models have recently emerged as a promising new tool for understanding the transmission of parasites through host populations. They provide a framework for representing an integral part of the transmission process; the ‘contact’ between hosts that may allow the transmission of parasites. Traditional epidemiological models assumed this contact was random, with each individual having equal opportunity of becoming infected (Anderson and May, 1979). However, structure is inherent in most animal populations, where the behaviour and movement patterns of animals is dictated by their social affiliations, and the availability and distribution of resources (Börger et al., 2008). The structured nature of animal behaviour can generate heterogeneities in the transmission of parasites (Altizer et al., 2003), and theoretical models have shown that incorporating these heterogeneities into epidemiological models improves the accuracy of disease spread predictions for heterogeneous host populations (Bansal et al., 2007). While this source of heterogeneity in parasite transmission is becoming more widely acknowledged (Paull et al., 2012), it remains relatively neglected in epidemiological models.
Social networks provide a framework for visualising a population as a series of individuals (represented by nodes) connected together by “edges”, which, in an epidemiological context, represent pathways for parasite transmission (Fig. 1). Thus, they capture the structural complexity of a population on an individual level, while allowing insights into how these individual-level processes operate at the population level. Theoretical work has shown that incorporating network structure into epidemiological models alters the epidemic dynamics compared with “mean field” models that assume individuals interact randomly (Eames and Keeling, 2002). Similarly, theoretical models show that composition of the connections within the network will influence the rate and shape of the epidemic curve (Keeling and Eames, 2005). Although the majority of network epidemiology has focussed on human and livestock systems (Meyers et al., 2005; Green et al., 2006; Kao et al., 2007), more recently networks have been applied to understanding the transmission of wildlife parasites.
Fig. 1.
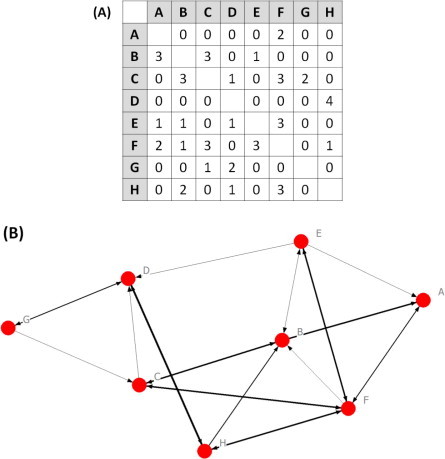
What is a network? A network in its most elementary form is an adjacency matrix, where row and column labels represent the individuals in the network, and the remaining cells represent the pair-wise associations among individuals in the network (panel A). These associations can be weighted, as below (panel A), where stronger relationships are assigned a higher value (for example, the duration or frequency of contact). They can also be directed, to reflect the direction of the association; in this instance, the direction of possible parasite transmission. In this case, rows represent donor nodes, and columns represent recipient nodes (e.g., in panel A: from node C (donor) to node D (recipient), there is a score of 1). The matrix can be visualised as a network diagram (panel B), consisting of nodes, which represent the epidemiological unit of interest (usually individuals) connected together by a series of edges representing the measure of association (the potential for parasite transmission). In context of understanding the ecology of parasite transmission, edges represent a ‘contact’ between two hosts that provides an opportunity for parasite transfer. The weighting of edges represents the likelihood of parasite transmission (e.g., the frequency or intensity of contact among hosts). The definition of a contact will depend on the type of parasite considered, and how it is passed from one host to another.
The application of networks to the epidemiology of wildlife parasites is a growing field of research. However, it has been mainly limited to modelling the transmission of emerging infectious diseases in wildlife populations (Craft et al., 2011; Hamede et al., 2012; Maher et al., 2012; Rushmore et al., 2013). Thus, the majority of network studies involve modelling the transmission of microparasites (viruses, bacteria and protozoans), with (normally) contagious methods of transmission (reviewed by Craft and Caillaud, 2011). This focus is because microparasites are usually responsible for significant disease epidemics (Dobson and Foufopoulos, 2001); for example, Ebola virus epidemics in central African wildlife (Leroy et al., 2004), and a canine distemper virus (CDV) epidemic in Serengeti lions (Roelke-Parker et al., 1996) and, therefore are often of greater epidemiological interest. These models have provided significant insights into the structure of contacts within wildlife populations (Naug, 2008; Hamede et al., 2009; Rushmore et al., 2013), and predictive modelling of disease through networks have suggested this structure should impact the transmission of real (Cross et al., 2004; Porphyre et al., 2008; Drewe et al., 2011), and hypothetical microbes (Guirmaraes et al., 2007; Fortuna et al., 2009). These studies have formed the foundation of our understanding of the influence of network structure on disease transmission (Craft and Caillaud, 2011; Dube et al., 2011; Tompkins et al., 2011). However, they represent a minority in terms of the breadth of transmission methods and life cycles of endemic parasites in host communities.
A smaller, but growing, number of studies have adopted a more ecological focus, using networks to understand the ecology of parasite transmission in wildlife populations. These studies explore the transmission of a range of parasites (both micro- and macro-parasites), representing a diversity of life cycles and transmission methods (Table 1). The study of these parasites can be more complex, particularly for those parasites that have more complex life cycles (involving more than one host) and methods of transmission that must be considered when modelling the transmission process. In addition, tracing the transmission of endemic parasites is more difficult, since a clear epidemic pattern of spread is usually not evident; instead, the use of prevalence and intensity profiles within populations is needed to infer information about the transmission process. Thus, the use of networks in understanding the ecology of parasite transmission in wildlife populations is markedly different to its applications in other areas of disease modelling. The aim of this review is to introduce wildlife parasitologists to the network approach and its potential for understanding the transmission of wildlife parasites. I will review how networks have been used to answer ecological questions about parasite transmission in wildlife populations, and highlight challenges and directions for future research. While the focus of this review is on parasites in a biological sense (eukaryotes: protozoans, helminthes and arthropods), we use examples from studies of bacteria and viruses to illustrate the potential of networks for offering insights into the ecology of parasite transmission.
Table 1.
Summary of published research using empirically derived networks to understand the ecology of parasite transmission. Contact type is the type of contact used to derive the social networks. Only studies focussing on eukaryotic parasites (protozoans, helminthes and arthropods) are reported.
| Transmission method | Parasite/s | Host/s | Contact type | Ecological context | Authors |
|---|---|---|---|---|---|
| Physical contact | Trematode (Gyrodactylus turnbulli) | Guppy (Poecilia reticulata) | Physical contact | Sociality | Croft et al. (2011a,b) |
| Physical contact | Slug mite (Riccardoella limacum) | Land snail (Arianta arbustorum) | Physical contact | Epidemiology | Schupbach and Baur (2010) |
| Physical contact | Lice (Lemurpediculus verruculosus) | Mouse lemurs (Microcebus rufus) | Physical contact | Sociality | Zohdy et al. (2012) |
| Faecal-oral | Trypanosome (Crithidia bombi) | Bumble bee (Bombus impatiens) | Physical contact | Sociality | Otterstatter and Thomson (2007) |
| Faecal-oral | Nematodes (Oesophagostomum aculeatum, Strongyloides fuelleborni & Trichuris trichiura) | Japanese macaques (Macaca fuscata yakui) | Grooming | Sociality | MacIntosh et al. (2012) |
| Faecal-oral | Nematode (Heligmosomoides polygyrus) | Yellow-necked mouse (Apodemus flavicollis) | Spatial overlap/proximity | Sex-biased transmission | Perkins et al. (2008) |
| Faecal-oral | Nematode (Pharyngodon wandillahensis) | Pygmy bluetongue lizards (Tiliqua adelaidensis) | Spatial proximity of refuges | Epidemiology | Fenner et al. (2011) |
| Free-living infectious stages | Ticks (Amblyomma limbatum) | ||||
| Free-living infectious stages | Ticks (Amblyomma sphenodonti) | Tuatara (Sphenodon punctatus) | Extent of home range overlap | Sociality | Godfrey et al. (2010) |
| Trombiculid mites (Neotrombicula sphenodonti) | |||||
| Free-living infectious stages | Tick (Amblyomma limbatum) | Sleepy lizard (Tiliqua rugosa) | Asynchronous use of common refuges | Epidemiology | Leu et al. (2010) |
| Free-living infectious stages | Tick (Amblyomma vikirri) | Gidgee skink (Egernia stokesii) | Asynchronous use of common refuges | Sociality | Godfrey et al. (2009) |
| Vector-borne | Blood parasites (Hemolivia, Hepatozoon & Plasmodium spp.) |
2. Representing the transmission process with networks
The transmission of a parasite from one host to another is a complex process, but is dependent on two main mechanisms; the contact between a susceptible host and a source of infection (either an infectious host/vector, or free-living infectious stages), and the hosts’ immune reaction to the new infection. The use of networks in epidemiology involves describing the first step in this process, the epidemiologically relevant contacts among hosts in a population. Networks are particularly useful for describing the transmission of parasites that depend on host behaviour to some extent (which involves most parasites, except for those that are mobile, or have mobile vectors). Fig. 1 describes the elements of a network, and how they are used to represent the pathways for parasite transmission.
Networks have predominantly been used to model the transmission of contagious parasites that require direct physical contact for transmission. Edges in contact networks usually represent whether any contact has occurred (using binary networks), or the duration or frequency of contact (using weighted networks) between hosts. Although this type of network has been most extensively applied to contagious microparasites (e.g., viruses and bacteria), numerous macroparasites also have a direct, contagious method of transmission. These parasites have been modelled extensively using a network approach (Table 1).
Many parasites have more complex life cycles, involving either a vector, intermediate host, or free-living infectious stages residing in the off-host environment. Yet these are often neglected by the network approach. For some parasites, such as mobile parasites, or parasites with mobile vectors, transmission may be less dependent on host behaviour and contact patterns, as the mobility of the vector or intermediate host overcomes the spatial constraints of transmission (Cote and Poulin, 1995; Godfrey et al., 2006). In this case, an individual-based network approach may be less relevant to the transmission process. However, many parasites rely in some way on the behaviour of the host to enable transmission. For example, for parasites that reside in host refuges, such as fleas or nidicolous ticks, transmission between hosts may be facilitated by asynchronous refuge sharing. In this case, a network can be developed by generating edges between individuals that shared the same refuge within an epidemiologically relevant period of time. For example, Leu et al. (2010) developed a network to represent the transmission of ticks through a population of lizards (Tiliqua rugosa) by connecting lizards that used the same refuge within a period of time that the refuge was estimated to remain ‘infectious’ (moulting time of the tick + survival time). Lizards that were more connected in these networks had higher tick loads, indicating that individuals that shared refuges with more neighbouring individuals were more likely to attain more ticks (Leu et al., 2010). Other studies have used a similar approach to understanding the transmission of refuge-dependent parasites (Fortuna et al., 2009; Godfrey et al., 2009).
However, many parasites lack a spatially distinct (or fixed) point of transmission, and are more broadly distributed throughout the off-host environment, such as non-nidicolous ticks, the larval stages of nematodes, or, eggs or oocysts shed into the off-host environment. The deposition and subsequent encounter of these infectious stages by hosts will depend on how an individual uses its environment. In many cases, animals structure their space use preferentially, either to overlap with mates or family members (Wolf and Trillmich, 2008), or alternatively, avoid competitive interactions with individuals of the same sex (Madison, 1980). This heterogeneity in space use may influence the transmission of parasites, and can be modelled using a network approach by weighting edges in the network according to the proximity between hosts, or overlap in home range area. For example, Perkins et al. (2008) and Grear et al. (2009) modelled the transmission of helminths within wild rodent populations by considering mice that were caught in the same or adjacent traps within a trapping session, as connected in the social network. Other studies have used the extent of home range overlap among dyads (Godfrey et al., 2010), or the spatial proximity of individuals (Fenner et al., 2011) to model the transmission of these parasites using networks.
The transmission of parasites with more complex life cycles (i.e., those parasites that have one or more intermediate hosts) is more difficult to model using a network approach, since the addition of intermediate hosts into the transmission cycle will dilute the effect of host behaviour on parasite transmission, particularly if the intermediate host involved is relatively mobile (Poulin, 1999). The interspecific transmission (from one intermediate host to the next) of these kinds of parasites have been extensively modelled using food web models, which consider trophic relationships among different host species as pathways for parasite transmission (Johnson et al., 2010). The use of food webs and network models to model interspecific parasite transmission, and the role of parasites in modulating energy flow through food webs has been reviewed extensively elsewhere (Lafferty et al., 2008; Poulin, 2010; Sukhdeo, 2010).
Thus, networks provide a flexible framework for modelling the transmission pathways of a broad range of parasites, with a variety of transmission methods. The key criterion for a network approach to be applicable to quantifying transmission pathways is the dependence of the parasite on the hosts’ behaviour for transmission. Where parasite transmission is spatially constrained, and contacts between hosts and sources of infection (whether they be other hosts, or environmental reservoirs) can be quantified, networks can be used to represent these heterogeneities in transmission.
2.1. Network analysis
One of the advantages of the network approach is that it provides a framework for analysis at three main levels; individual, dyadic (pair-wise associations), and the population (network) level (Fig. 2). Thus, networks can capture the structural complexity of a population on an individual level, while allowing insights into how these individual level processes operate at the population level. They also provide a framework for the epidemiological modelling of diseases through populations (Newman, 2002; Keeling and Eames, 2005), and provide a versatile tool for exploring heterogeneity in parasite transmission.
Fig. 2.
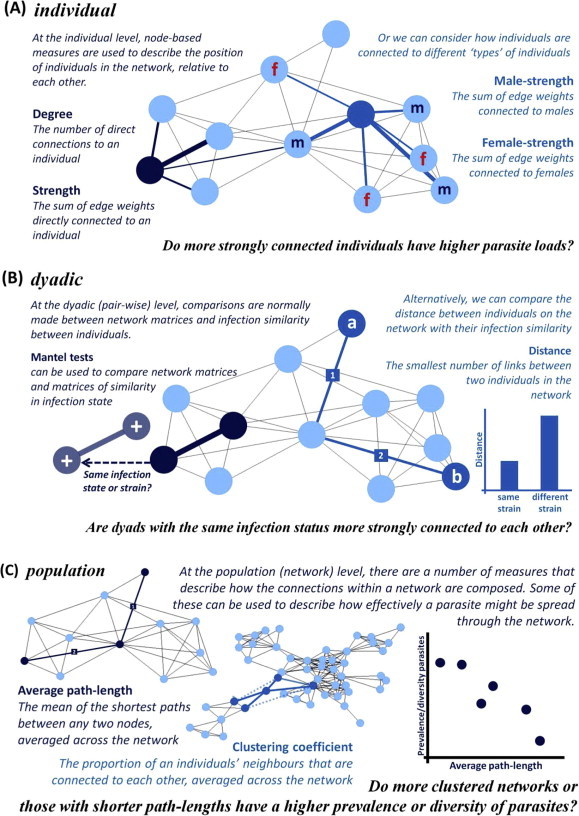
How do we use networks to understand the ecology of parasite transmission? Networks allow us to describe how the behaviour of individuals collectively affects the transmission of parasites within wildlife populations. They provide a flexible framework that enables analysis at three different levels; individual (panel A), dyadic (pair-wise associations) (panel B) and the network (population) level (panel C). Within each level of analysis, there are different metrics and analytical approaches that can be used to explore the ecology of parasite transmission.
2.1.1. Individual
On an individual level, node-based metrics can be derived that describe the position of individuals in the network. A number of standard metrics relevant to disease transmission, which consider the connectivity of individual nodes in the network, and their relative importance in the flow of an entity (in this case, parasites) through a network, have been reviewed elsewhere (Bell et al., 1999; Riolo et al., 2001; Christley et al., 2005). Traditionally, network metrics relevant to parasite transmission have focused on quantifying the connectivity (normally ‘degree’ and ‘strength’) of individuals in a network (Fig. 2). A growing number of studies have evaluated the appropriateness of these measures, and derived new measures to describe the importance of individuals in the transmission of diseases through networks (e.g., epidemic ranking) (Liu et al., 2011; Sikic et al., 2011; Konschake et al., 2013; Piraveenan et al., 2013). Similarly, while centrality-based measures are often considered in their own right, how individuals are connected to a particular ‘type’ of host (e.g., males/females, dominant/subordinate) may be of greater ecological interest (e.g., Fenner et al. (2011), Fig. 2). Comparisons between these measures and parasite infection patterns may provide insights into how the position of an individual in a network influences its exposure to parasites.
2.1.2. Dyadic
Networks allow us to examine pair-wise relationships among individuals, and how they relate to parasite infection patterns. Networks can be used to test for assortment of infection patterns within the network (e.g., are infected individuals more likely to be connected to one another, than expected by chance?) using assortment indices, such as Newman’s assortivity coefficient (Newman, 2003). Alternatively, Mantel tests, which test for correlations between two sets of matrices (Mantel, 1967) can be used to test hypotheses about infection sharing among individuals. For example, Bull et al. (2012) found a strong correlation between a social network of lizards, and a matrix of Salmonella strain sharing, but did not find a relationship between a geographic distance matrix and Salmonella strain sharing. Thus, social interactions between lizards, not spatial proximity, predicted whether a pair of lizards shared a common strain of Salmonella (Bull et al., 2012). Similarly, the ‘network distance’ between any two individuals in a network can be calculated based on the shortest number (for binary networks, (Burt, 1976)) and weighting (for weighted networks (Opsahl et al., 2010)) of links between individuals that are not directly adjacent on the network. Thus, relationships between parasite sharing or strain similarity can be compared against their ‘network distance’ to test whether the proximity of individuals on the network predicts their likelihood of sharing an infection (Fig. 2). More advanced methods of comparing matrices are becoming available, allowing comparisons of multiple matrices, and controlling for variables, such as space use (Hirsch et al., 2013), using Multiple Regression Quadratic Assignment Procedure (MR-QAP) analyses (Dekker et al., 2007).
2.1.3. Population
A number of measures can be derived to describe how connections within a network are composed (Fig. 2). Importantly, of relevance to parasite transmission is the ability of these measures to describe how the structure of the network facilitates the spread (or flow) of an entity (i.e., an infection) through a network. These include more traditional measures, such as clustering coefficient (the extent to which an individual’s neighbours are connected to one another (Watts, 1999)) or average path-length (the smallest number of edges between any two individuals in a network (Burt, 1976)); or newer measures, such as ‘small-worldness’ (Humphries and Gurney, 2008). On their own, these measures are fairly limited; serving a purely descriptive purpose. However, they can provide some powerful insights when used in comparative analyses of replicated networks. For example, Croft et al. (2011a) found guppy social networks that were experimentally infected with a gyrodactylid ectoparasite had a lower clustering coefficient than guppy networks that were not infected. This suggests some behavioural mechanism that reduces the extent of contact between hosts when infection is present, to minimise transmission (Croft et al., 2011a). Alternatively, comparisons between parasite prevalence or diversity with network-based metrics across separate, independent networks can provide insights into how the structure of networks affects the level of parasitism within a population (e.g., Griffin and Nunn (2012), Fig. 2). Thus, when considering replicated social networks, network-based metrics can provide a useful means of quantifying different aspects of the structure of a network, and understanding how the composition of connections within a network affect parasite transmission on a population level.
3. Ecological questions that networks can answer
The main advantage of a network approach to understanding the ecology of parasite transmission is that it allows us to understand how host behaviour generates potential heterogeneities in the transmission of parasites. Yet, their application to answering ecological questions about parasite transmission is still in its infancy. A few key ecological questions that have applied the network approach are outlined below.
3.1. Factors driving parasite transmission in wildlife populations
A central question for many wildlife parasitologists and ecologists is: what are the factors that drive the transmission of parasites in wildlife populations? A network approach can be integrated into testing hypotheses about the factors influencing parasite transmission in wildlife populations by considering animal behaviour as a potential driver of transmission, either on its own, or in combination with other factors. Traditionally, when studies have considered animal behaviour as a factor influencing parasite transmission, metrics such as home range size (Vitone et al., 2004; Bordes et al., 2009), or social group size (Ezenwa, 2004; Burger et al., 2012) were used to represent behavioural variation among individuals. An advantage of using network metrics is that they allow the quantification of the epidemiological consequences of animal behaviour. That is, rather than considering group size or home range in isolation, a network approach allows us to consider how both the behaviour of an individual, and the behaviour of neighbouring individuals, cumulatively affects individual infection risk.
Simple empirical comparisons between the position of individuals in a network with their parasite burden or infection state have provided insights into the role of animal behaviour in influencing parasite transmission (Godfrey et al., 2009, 2010; Leu et al., 2010; MacIntosh et al., 2012). Normally, measures of how well connected individuals are in the network (such as degree or strength, Fig. 2) are used as measures of infection risk (e.g., Leu et al., 2010). If the network is representative of parasite transmission, then positive relationships between these measures and parasite infection patterns are expected. For example, Godfrey et al. (2010) found tick loads, but not mite loads, of tuatara were positively associated with the strength of individuals in a network based on home range overlap. Instead, mite loads were more strongly associated with home range size of individuals, reflecting the fact that the mites are free-living for most of their life cycle (Godfrey et al., 2010). Thus, comparisons between infection patterns and network indices can test hypotheses about the role of host behaviour in influencing infection patterns.
Networks have been applied in a further extension of this idea; testing alternate hypotheses about the factors influencing infection patterns in wildlife populations. Although many studies set out to test a single hypothesis, increasingly it is the case that alternative hypotheses are proposed to explain observed ecological phenomena (Johnson and Omland, 2004). In the context of using networks to understand parasite transmission, alternative network models, or node-based measures, can be derived to test alternative hypotheses about the factors driving parasite transmission. For example, Fenner et al. (2011) derived node-based measures to describe the connectedness of lizards in the network to (a) resident individuals and (b) disperser individuals. Lizards more strongly connected to dispersers (having a higher ‘disperser-strength’) were more likely to be infected by nematode worms, while there was no relationship between connections to residents, or lizards overall and nematode infection patterns (Fenner et al., 2011). Through comparing these alternative hypotheses, the authors deduce that dispersers may play an important role in the transmission of this parasite, probably through faecal-oral transmission of the parasites from the inspection (tongue flicking) of unfamiliar scats by resident lizards (Fenner et al., 2011). Alternatively, the type of behaviour involved in transmission can be compared. For example, Drewe (2010) developed separate networks composed of grooming interactions and aggressive interactions among meerkats to evaluate the importance of different behaviours in Mycobaterium bovis transmission among individuals. Drewe (2010) found that groomers had a higher infection risk than groomees, while receivers of aggressive encounters had a higher infection risk than initiators of aggression. Thus, the use of alternative networks can be used to gain insights into the importance of different types of behaviours in parasite transmission.
Importantly, the idea of testing alternative hypotheses should also be combined with testing biologically meaningful null hypotheses about other potential drivers behind the patterns observed. For example, Godfrey et al. (2009) found a positive relationship between parasite diversity in lizards and their ‘degree’ in networks composed from patterns of refuge sharing. An alternative explanation of this relationship might be that lizards with a higher degree inherently use more refuges, and it may be the number of refuges used that increases the likelihood of picking up more parasites, rather than the position of individuals in the network. However they found no relationship between parasite diversity and the number of refuges used by lizards (Godfrey et al., 2009). This observation provided further support for their conclusions that the network itself may influence the transmission of parasites. Consideration of alternative biological processes that could confound, or explain infection processes should be considered in parallel with network parameters, particularly for observational studies where causality is more difficult to infer. This problem of causality and inference in observational studies is discussed further in Section 4.3.
3.2. Social structure and parasite transmission
Understanding the evolution of complex sociality involves understanding the costs and benefits of social living (Alexander, 1974). One hypothesised cost to the evolution of group living is increased costs of parasitism, whereby higher contact rates and local density of hosts should enhance the transmission of parasites (Moller et al., 1993). An assumption underlying this theory is that parasite transmission rates increase with group size, thus parasites should act as a constraint to group size (Loehle, 1995). A number of studies have found positive relationships between the degree of sociality and parasite diversity (Poulin, 1991a; Poiani, 1992; Cote and Poulin, 1995), however this relationship is not ubiquitous (Poulin, 1991b; Arnold and Anja, 1993; Bordes et al., 2007), and can depend on the host and parasite biology (see Patterson and Ruckstuhl (2013) for a review). Understanding the relationship between parasitism and sociality requires an understanding of how parasite transmission is influenced by social organisation.
Group size is generally used as a metric of sociality in empirical comparisons with parasite infection rates to test the costs of parasites to the evolution of sociality (Arnold and Anja, 1993; Hillegass et al., 2008; Burger et al., 2012). However, group size alone does not necessarily reflect transmission rates. For example, meta-analyses of primate sociality revealed no relationship between group size and parasite richness (Nunn et al., 2003). However, using a network approach Griffin and Nunn (2012) found that the modularity (the extent of sub-grouping within a network) of primate networks increased with group size, and at the same time, high parasite richness was associated with lower network modularity. Thus, larger primate groups may offset the costs of parasites through substructures present within groups (Griffin and Nunn, 2012). Similarly, Godfrey et al. (2006) found no relationship between group size and parasite infection in social groups of lizards, but using a network approach, found a positive relationship between network connectivity and parasite richness (Godfrey et al., 2009). Therefore, networks provide a framework for assessing the costs of parasites to sociality by quantifying the direct epidemiological consequences of group living.
Networks may also be used to explore how the costs of parasites to sociality are offset through changes in behaviour. Individuals may alternate sleeping or roosting sites to reduce contact with infectious sites (Hausfater and Meade, 1982; Reckardt and Kerth, 2007), or avoid infected individuals within social groups (Behringer and Butler, 2010), however the consequences of these parasite-induced behavioural shifts for social organisation are poorly understood. To what extent do parasites alter the social organisation of their hosts? Croft et al. (2011a) experimentally tested this idea by introducing infected hosts into guppy social groups, and measuring the change in the social network. The introduction of an infected fish significantly reduced the clustering coefficient of networks, compared with if an uninfected fish was introduced (Croft et al., 2011a). It appears that guppies alter their social associations to reduce parasite transmission within social groups (Croft et al., 2011a). Thus, networks offer a new approach for exploring how parasites influence the evolution of social organisation, through their ability to quantify the epidemiological consequences of social organisation on an individual level.
3.3. Male-biased parasite transmission
Male-bias in parasite burdens is a common ecological phenomenon which has been of long-held interest to ecologists and parasitologists (Zuk and McKean, 1996; Poulin, 1996b; Moore and Wilson, 2002; Krasnov et al., 2012). Yet, the mechanisms driving sex-bias in parasite loads remain unclear. One of the central hypotheses explaining this phenomenon is that higher levels of testosterone in males have an immunosuppressive effect, making them more susceptible to infection than females (Folstad and Karter, 1992; Wedekind and Jakobsen, 1998; Hoby et al., 2006). Overlaid upon this, males may also be more infectious (by favouring parasite development) than females (Poulin, 1996a), leading males to play a more predominate role in parasite transmission through host populations (Skorping and Jensen, 2004). Although numerous studies have found support for these hypotheses, others have suggested that the immunological differences between males and females are not always substantial enough to explain the marked differences in parasitism (Krasnov et al., 2005; Grear et al., 2012).
An alternative hypothesis is that behavioural differences between males and females may generate sex differences in parasite transmission. Males often have larger home ranges, and interact with conspecifics more frequently (through seeking matings, and intraspecific competition), than females (Jacobs et al., 1990; Bond and Wolff, 1999; Perry and Garland, 2002); these behavioural differences may generate inequalities in parasite transmission between males and females. Networks offer an ideal framework to evaluate the role of behaviour in generating sex differences in parasitism, because they allow the epidemiological consequences of behaviour to be quantified. Empirical comparisons between the connectedness of males and females can provide insights into whether males are at a greater behavioural risk of becoming infected. For example, male tuatara were more strongly connected in networks derived from home range overlap than female tuatara, and individuals that were more strongly connected to males in the network had higher tick loads (Godfrey et al., 2010). These observations suggest that behavioural differences between the sexes can generate heterogeneities in parasite transmission, and parasite loads.
Perkins et al. (2008) modelled helminth transmission through social networks of wild rodents, and compared model predictions with observed levels of prevalence among males and females. With transmission equal between sexes, the contact network alone did not match the observed levels of prevalence; instead, model predictions most closely matched observed prevalence when males were ten times more infectious than females (Perkins et al., 2008). This study demonstrated that network structure alone could not explain transmission, implying a physiological mechanism behind male-biased transmission in this system. Alternatively, interactions between hormones and behaviour may together enhance the role of males in the transmission of parasites. Grear et al. (2009) found that experimentally increasing testosterone levels in male mice increased the transmission potential of the resultant contact networks, suggesting that both testosterone and behaviour may interact synergistically to enhance the role of males in the transmission of parasites. These studies illustrate the potential of a network approach in increasing our understanding of the role of sex differences in behaviour in influencing male-biased parasitism.
4. Challenges and limitations of a network approach
The network approach offers a quantitative framework for exploring a range of ecological questions about the transmission of parasites in wildlife populations. However, several challenges remain in their application to wildlife populations, which are outlined below.
4.1. Data intensive
One of the main limitations of applying a network approach is the data requirements for building detailed network models for wildlife populations. Detailed data on the contacts and movements of individuals in a population at a timescale relevant to the transmission process are required to develop representative network models. Improvements in animal tracking technology are allowing the collection of large sets of data on different aspects of animal behaviour, including contact patterns (using proximity loggers: Ryder et al. (2012)), the location and movement of individuals (using microGPS loggers: Tomkiewicz et al. (2010)), or the proximity of individuals to key locations such as refuges or foraging patches (using RFID loggers: Bonter and Bridge (2011)). However, these technologies can be cost-prohibitive (particularly when targeting statistically viable sample sizes), or impractical for certain species due to size constraints. They can also generate extremely large datasets that become computationally intensive (both in time and power) to derive network data from, particularly when large numbers of animals are tracked (see Krause et al. (in press) for a review). Algorithms usually need to be written to handle these large datasets, which requires some computer programming knowledge, although some software programs are available to handle certain data types (such as SOCPROG (Whitehead, 2009)).
An alternative to these data-intensive approaches is to use proxies of contact, such as spatial proximity (e.g., Fenner et al. (2011)), home range overlap (e.g., Godfrey et al. (2010)), or less frequent ‘snap-shots’ of associations (e.g., Godfrey et al. (2009)). These proxies can be used to develop network models if there is sufficient biological justification to base them upon. Another challenge is that fairly complete sampling of all members within a population or area is required, since network structure and derived node-based measures can be sensitive to missing or misclassified observations (James et al., 2009). Even the method of data collection can affect the derived network structure (Perkins et al., 2009). Thus, while a network approach may be feasible for some host–parasite systems, for many it may remain out of reach due to the practicalities of collecting relevant data for the development of network models.
4.2. Non-independence of data
Because measures derived from one individual in a network are dependent on other individuals in the network, node-based network metrics are ‘non-independent’ and therefore violate the assumption of independence required for most standard statistical analyses. The main method of overcoming this non-independence is to use randomisation procedures that shuffle either node labels or edges (James et al., 2009; Krause et al., 2009; Croft et al., 2011b). However most randomisation tests allow only simple comparisons between two groups (e.g., comparing the position of infected and uninfected individuals in a network) or correlations between two variables. Although more complex analyses are available (e.g., p∗ models: Robins et al. (2007)), they require advanced statistical knowledge to utilise them. More advanced network analysis techniques are becoming more accessible, such as Multiple Regression Quadratic Assignment Procedure (MRQAP) (Dekker et al., 2007), which enables the comparison of multiple matrices. Thus, the analysis of networks is a developing area, and remains a challenge for most biologists with a limited statistical background.
4.3. Inferring causality
Although networks derived from natural host-parasite populations provide valuable insights into the structure of epidemiologically relevant contacts in free-living populations, the causality of any observed relationships between network metrics and parasite infection patterns is difficult to ascertain. Because parasites can influence the behaviour of their hosts, correlations between network parameters and parasite infection levels can be interpreted in two ways: network position influences parasite load, or parasite load influences network position. Both explanations are inherently interesting, however determining the mechanism generating the pattern can be problematic. Experimental studies can allow us to differentiate between these alternative explanations, either by manipulating parasite loads and tracking transmission (e.g., Otterstatter and Thomson (2007)), or perturbing the network by removing key individuals (e.g., Flack et al. (2006)). This can be impractical for field-based studies of wildlife populations.
For situations where experimental approaches are impractical, model simulations of infections through networks may be used to compare observed infection patterns or dynamics with model predictions to distinguish between competing hypotheses (e.g., Craft et al. (2009)). Longitudinal studies may also provide insights into causality, by tracking the dynamics of individual infections through time in respect to their network position. For example, if highly connected individuals are more likely to become infected within a defined time step than less connected individuals, this may allow some measure of causality to be inferred. An alternative approach is to infer the spread of parasites through the host population by analysing the genetic structure of the parasite population (Archie et al., 2009), and compare this with the host social network (e.g., Bull et al. (2012)). Alternatively, parasite transmission may be tracked more directly. Zohdy et al. (2012) tracked parasite transmission by physically marking lice and tracking their movement through the host population. Thus, the problem of inferring causality from observed social networks can be approached in different ways to yield insights into the mechanisms driving the observed infection patterns.
5. Networks and wildlife parasitology – ways forward?
Despite several challenges remaining in the application of network models to understanding parasite transmission, for host-parasite systems in which it is practical to overcome these limitations, networks can offer a valuable tool for understanding the ecology of wildlife parasites. As technology improves, the host-parasite systems in which a network approach is applicable will continue to grow. However, despite the increasing number of host-parasite systems that network models have been applied to, this method is still in its infancy. Like any other model of an ecological system, network models are a vast simplification of what is inherently a more complex and dynamic process. Thus, there is scope for expanding and developing network models that capture more of this complexity, providing potentially new insights into the ecology of parasite transmission in wildlife populations.
5.1. Network dynamics
Most representations of network structure in wildlife populations are static. That is, they capture a snap shot of associations over a short period of time (Croft et al., 2004; Pike et al., 2008), or aggregate a set of observations over a longer period of time (Lusseau et al., 2003, 2006) as a single network representing behavioural associations within a host population. These static representations are what most network models, both empirical and theoretical, of parasite transmission in wildlife populations are based upon. However, parasite transmission is a dynamic process. While the dynamic aspects of the transmission process have been acknowledged in network models of human disease, particularly for sexually transmitted diseases (Kretzschmar and Morris, 1996; Eames and Keeling, 2002), they have yet to be incorporated in a similar way for wildlife populations. Dynamic network methods have recently emerged in the field of animal behavioural ecology, providing a framework for capturing the dynamics of associations across a fine temporal scale (Blonder and Dornhaus, 2011; Blonder et al., 2012), however these analytical methods are currently beyond the reach of most biologists. On a more fundamental level, insights into the temporal nature of transmission networks (and consequently parasite transmission) can be gained by sampling a network more than once, and in context of different seasons or ecological conditions. For example, Rushmore et al. (2013) found that chimpanzee networks varied significantly over time, with more connections at times when females were in oestrus. Incorporating these factors into network models is likely to yield significant insights into the dynamic nature of parasite transmission, and have important implications for how disease is modelled.
5.2. Network perturbations
Related to this, how animal social networks respond to ecological perturbations is poorly understood, particularly in context of parasite transmission. Variation in ecological conditions, such as seasonal or annual changes in resource availability, can alter animal behaviour and social interactions, flowing through to affect social network structure, and consequently parasite transmission. For example, Cross et al. (2004) found buffalo contact networks were more clustered in drier years, presumably around waterholes, which could increase the rate of disease spread in drought years. Similarly, understanding how networks respond to anthropogenic perturbations is poorly understood, but may reveal important insights into the factors driving parasite transmission. For example, the culling of badgers to control the spread of bovine tuberculosis unexpectedly increased the movement of badgers, which in turn, increased the prevalence of tuberculosis in cattle (Carter et al., 2007). Networks provide an ideal framework within which to test how perturbations impact the transmission of parasites in wildlife populations via changes in animal behaviour.
5.3. Incorporating complexity into network models
A final point is that network models are a simplification of what is inherently a much more complex process. As outlined earlier, networks only capture one aspect of the transmission process; that is, the contact between hosts (either direct, or indirect) that provides an opportunity for parasite transmission. However, other factors influence whether an infectious contact results in a new infection. Individual variation in infectiousness can generate significant heterogeneities in parasite transmission, impacting the spread of diseases through populations (Lloyd-Smith et al., 2005; Paull et al., 2012). Variation in infectiousness can be caused by a variety of factors, including co-infection (Cattadori et al., 2007) and immunosuppression (Hawley and Altizer, 2011), and may cause some nodes to be more infectious than others, independent of their contact levels within the network. Incorporating measures of infectiousness into network models would yield important insights into the impact of individual variation in infectiousness on the effective shape of networks. Similarly, the immune system mediates whether an infectious contact becomes a new infection in the recipient host. Thus, individual variation in immunocompetence may generate heterogeneities in how infections spread through networks (Hawley and Altizer, 2011). Considering infectiousness and immunocompetence in network models may provide insights into the importance of these factors in the transmission of parasites through wildlife populations. However, as with any model, the best model is the most parsimonious – the most simple representation that best explains the observed data (Johnson and Omland, 2004); thus adding more complexity may not always improve a model’s fit, and may make the results harder to interpret. Thus, deciding which variables to incorporate into network models should involve identifying those that are of most biological importance to the process being represented.
5.4. Final thoughts
Despite the fact that network models have been ‘popular’ for several years now, their application to understanding the ecology of parasite transmission is still in its infancy, particularly for empirically based studies. Despite the challenges outlined in this review, they offer great potential for improving our understanding of the influence of animal behaviour in generating heterogeneities in parasite transmission. With the impacts of parasites on wildlife populations becoming more widely recognised (Thompson et al., 2010; McCallum, 2012), and the importance of behaviour in driving transmission increasingly acknowledged (Wendland et al., 2010; Langwig et al., 2012), network models offer a means of understanding, and thus managing, the spread of wildlife parasites and diseases (Hamede et al., 2012; Maher et al., 2012). Their versatility, in terms of the range of parasites they can be used to represent, as well as their ability to capture different scales of the transmission process, means they can be adopted across a range of systems and ecological questions. While the currently limited application of this method reflects the relative infancy of this field of research, it also means that there are unexploited opportunities, which may enable novel insights into the transmission of parasites in wildlife populations. Several significant challenges remain in applying these models to wildlife, and this limits the advances we can make in this area of research. But for those systems where a network approach is applicable and feasible, networks offer a new framework for understanding how animal behaviour influences parasite transmission, and the potential of this method is only just beginning to be realised.
Acknowledgements
SSG was supported by an Australian Research Council – Discovery Early Career Researcher Award (DECRA) (DE120101470).
Footnotes
This is an open-access article distributed under the terms of the Creative Commons Attribution-NonCommercial-No Derivative Works License, which permits non-commercial use, distribution, and reproduction in any medium, provided the original author and source are credited.
References
- Alexander R.D. The evolution of social behavior. Annu. Rev. Ecol. Syst. 1974;5:325–383. [Google Scholar]
- Altizer S., Nunn C.L., Thrall P.H., Gittleman J.L., Antonovics J., Cunningham A.A., Dobson A.P., Ezenwa V.O., Jones K.E., Pedersen A.B., Poss M., Pulliam J.R.C. Social organization and parasite risk in mammals: integrating theory and empirical studies. Annu. Rev. Ecol. Evol. Syst. 2003;34:517–547. [Google Scholar]
- Anderson R.M., May R.M. Populations biology of infectious diseases: part I. Nature. 1979;280:361–367. doi: 10.1038/280361a0. [DOI] [PubMed] [Google Scholar]
- Archie E.A., Luikart G., Ezenwa V.O. Infecting epidemiology with genetics: a new frontier in disease ecology. Trends Ecol. Evol. 2009;24:21–30. doi: 10.1016/j.tree.2008.08.008. [DOI] [PubMed] [Google Scholar]
- Arnold W., Anja V.L. Ectoparasite loads decrease the fitness of alpine marmots (Marmota marmota) but are not a cost of sociality. Behav. Ecol. 1993;4:36–39. [Google Scholar]
- Bansal S., Grenfell B.T., Meyers L.A. When individual behaviour matters: homogeneous and network models in epidemiology. J. R. Soc. Interface. 2007;4:879–891. doi: 10.1098/rsif.2007.1100. [DOI] [PMC free article] [PubMed] [Google Scholar]
- Behringer D.C., Butler M.J., IV Disease avoidance influences shelter use and predation in Caribbean spiny lobster. Behav. Ecol. Sociobiol. 2010;64:747–755. [Google Scholar]
- Bell D.C., Atkinson J.S., Carlson J.W. Centrality measures for disease transmission networks. Soc. Netw. 1999;21:1–21. [Google Scholar]
- Blonder B., Dornhaus A. Time-ordered networks reveal limitations to information flow in ant colonies. PLoS ONE. 2011;6:e20298. doi: 10.1371/journal.pone.0020298. [DOI] [PMC free article] [PubMed] [Google Scholar]
- Blonder B., Wey T.W., Dornhaus A., James R., Sih A. Temporal dynamics and network analysis. Methods Ecol. Evol. 2012;3:958–972. [Google Scholar]
- Bond M.L., Wolff J.O. Does access to females or competition among males limit male home-range size in a promiscuous rodent? J. Mammal. 1999;80:1243–1250. [Google Scholar]
- Bonter D.N., Bridge E.S. Applications of radio frequency identification (RFID) in ornithological research: a review. J. Field Ornithol. 2011;82:1–10. [Google Scholar]
- Bordes F., Blumstein D.T., Morand S. Rodent sociality and parasite diversity. Biol. Lett. 2007;3:692–694. doi: 10.1098/rsbl.2007.0393. [DOI] [PMC free article] [PubMed] [Google Scholar]
- Bordes F., Morand S., Kelt D.A., Van Vuren D.H. Home range and parasite diversity in mammals. Am. Nat. 2009;173:467–474. doi: 10.1086/597227. [DOI] [PubMed] [Google Scholar]
- Börger L., Dalziel B.D., Fryxell J.M. Are there general mechanisms of animal home range behaviour? A review and prospects for future research. Ecol. Lett. 2008;11:637–650. doi: 10.1111/j.1461-0248.2008.01182.x. [DOI] [PubMed] [Google Scholar]
- Bull C.M., Godfrey S.S., Gordon D.M. Social networks and the spread of Salmonella in a sleepy lizard population. Mol. Ecol. 2012;21:4386–4392. doi: 10.1111/j.1365-294X.2012.05653.x. [DOI] [PubMed] [Google Scholar]
- Burger J.R., Chesh A.S., Munoz P., Fredes F., Ebensperger L.A., Hayes L.D. Sociality, exotic ectoparasites, and fitness in the plural breeding rodent Octodon degus. Behav. Ecol. Sociobiol. 2012;66:57–66. doi: 10.1007/s00265-011-1252-9. [DOI] [PMC free article] [PubMed] [Google Scholar]
- Burt R.S. Positions in networks. Soc. Forces. 1976;55:93–122. [Google Scholar]
- Carter S.P., Delahay R.J., Smith G.C., McDonald D.W., Riordan P., Etherington T.R., Pimley E.R., Walker N.J., Cheeseman C.L. Cull-induced social perturbation in Eurasian badgers Meles meles and the management of TB in cattle: an analysis of a critical problem in applied ecology. Proc. R. Soc. Lond. B Biol. Sci. 2007;274:2769–2777. doi: 10.1098/rspb.2007.0998. [DOI] [PMC free article] [PubMed] [Google Scholar]
- Cattadori I.M., Albert R., Boag B. Variation in host susceptibility and infectiousness generated by co-infection: the myxoma-Trichostrongylus retortaeformis case in wild rabbits. J. R. Soc. Interface. 2007;16:831–840. doi: 10.1098/rsif.2007.1075. [DOI] [PMC free article] [PubMed] [Google Scholar]
- Christley R.M., Pinchbeck G.L., Bowers R.G., Clancy D., French N.P., Bennett R., Turner J. Infection in social networks: using network analysis to identify high-risk individuals. Am. J. Epidemiol. 2005;162:1024–1031. doi: 10.1093/aje/kwi308. [DOI] [PubMed] [Google Scholar]
- Cote I.M., Poulin R. Parasitism and group size in social animals: a meta-analysis. Behav. Ecol. 1995;6:159–165. [Google Scholar]
- Craft M.E., Caillaud D. Network models: an underutilized tool in wildlife epidemiology? Interdiscip. Perspect. Infect. Dis. 2011;2011:676949. doi: 10.1155/2011/676949. [DOI] [PMC free article] [PubMed] [Google Scholar]
- Craft M.E., Volz E., Packer C., Meyers L.A. Distinguishing epidemic waves from disease spillover in a wildlife population. Proc. R. Soc. Lond. B Biol. Sci. 2009;276:1777–1785. doi: 10.1098/rspb.2008.1636. [DOI] [PMC free article] [PubMed] [Google Scholar]
- Craft M.E., Volz E., Packer C., Meyers L.A. Disease transmission in territorial populations: the small-world network of Serengeti lions. J. R. Soc. Interface. 2011;8:776–786. doi: 10.1098/rsif.2010.0511. [DOI] [PMC free article] [PubMed] [Google Scholar]
- Croft D.P., Krause J., James R. Social networks in the guppy (Poecilia reticulata) Proc. R. Soc. Lond. B Biol. Sci. 2004;271(Suppl.):S516–S519. doi: 10.1098/rsbl.2004.0206. [DOI] [PMC free article] [PubMed] [Google Scholar]
- Croft D.P., Edenbrow M., Darden S.K., Ramnarine I.W., Van Oosterhout C., Cable J. Effect of gyrodactylid ectoparasites on host behaviour and social network structure in guppies Poecilia reticulata. Behav. Ecol. Sociobiol. 2011;65:2219–2227. [Google Scholar]
- Croft D.P., Madden J.R., Franks D.W., James R. Hypothesis testing in animal social networks. Trends Ecol. Evol. 2011;26:502–507. doi: 10.1016/j.tree.2011.05.012. [DOI] [PubMed] [Google Scholar]
- Cross P.C., Lloyd-Smith J.O., Bowers J.A., Hay C.T., Hofmeyr M., Getz W.M. Intergrating association data and disease dynamics in a social ungulate: bovine tuberculosis in African buffalo in the Kruger National Park. Ann. Zool. Fenn. 2004;41:879–892. [Google Scholar]
- Dekker D., Krackhardt D., Snijders T.A.B. Sensitivity of MRQAP tests to collinearity and autocorrelation conditions. Psychometrika. 2007;72:563–581. doi: 10.1007/s11336-007-9016-1. [DOI] [PMC free article] [PubMed] [Google Scholar]
- Dobson A., Foufopoulos J. Emerging infectious pathogens of wildlife. Proc. R. Soc. Lond. B Biol. Sci. 2001;356:1001–1012. doi: 10.1098/rstb.2001.0900. [DOI] [PMC free article] [PubMed] [Google Scholar]
- Drewe J.A. Who infects whom? Social networks and tuberculosis transmission in wild meerkats. Proc. R. Soc. Lond. B Biol. Sci. 2010;277:633–642. doi: 10.1098/rspb.2009.1775. [DOI] [PMC free article] [PubMed] [Google Scholar]
- Drewe J.A., Eames K.T.D., Madden J.R., Pearce G.P. Integrating contact network structure into tuberculosis epidemiology in meerkats in South Africa: Implications for control. Prev. Vet. Med. 2011;101:113–120. doi: 10.1016/j.prevetmed.2011.05.006. [DOI] [PubMed] [Google Scholar]
- Dube C., Ribble C., Kelton D., McNab B. Introduction to network analysis and its implications for animal disease modelling. Rev. Sci. Tech. OIE. 2011;30:425–436. doi: 10.20506/rst.30.2.2043. [DOI] [PubMed] [Google Scholar]
- Eames K.T.D., Keeling M.J. Modeling dynamic and network heterogeneities in the spread of sexually transmitted diseases. Proc. Natl. Acad. Sci. U.S.A. 2002;99:13330–13335. doi: 10.1073/pnas.202244299. [DOI] [PMC free article] [PubMed] [Google Scholar]
- Ezenwa V.O. Host social behavior and parasitic infection: a multifactorial approach. Behav. Ecol. 2004;15:446–454. [Google Scholar]
- Fenner A.L., Godfrey S.S., Bull C.M. Using social networks to deduce whether residents or dispersers spread parasites in a lizard population. J. Anim. Ecol. 2011;80:835–843. doi: 10.1111/j.1365-2656.2011.01825.x. [DOI] [PubMed] [Google Scholar]
- Flack J.C., Girvan M., de Waal F.B.M., Krakauer D.C. Policing stabilizes construction of social niches in primates. Nature. 2006;439:426–429. doi: 10.1038/nature04326. [DOI] [PubMed] [Google Scholar]
- Folstad I., Karter A.J. Parasites, bright males, and the immunocompetence handicap. Am. Nat. 1992;139:603–622. [Google Scholar]
- Fortuna M.A., Popa-Lisseanu A.G., Ibanez C., Bascompte J. The roosting spatial network of a bird-predator bat. Ecology. 2009;90:934–944. doi: 10.1890/08-0174.1. [DOI] [PubMed] [Google Scholar]
- Godfrey S.S., Bull C.M., Murray K., Gardner M.G. Transmission mode and distribution of parasites among groups of the social lizard Egernia stokesii. Parasitol. Res. 2006;99:223–230. doi: 10.1007/s00436-005-0120-9. [DOI] [PubMed] [Google Scholar]
- Godfrey S.S., Bull C.M., James R., Murray K. Network structure and parasite transmission in a group living lizard, the gidgee skink, Egernia stokesii. Behav. Ecol. Sociobiol. 2009;63:1045–1056. [Google Scholar]
- Godfrey S.S., Moore J.A., Nelson N.J., Bull C.M. Social network structure and parasite infection patterns in a territorial reptile, the tuatara (Sphenodon punctatus) Int. J. Parasitol. 2010;40:1575–1585. doi: 10.1016/j.ijpara.2010.06.002. [DOI] [PubMed] [Google Scholar]
- Grear D.A., Perkins S.E., Hudson P.J. Does elevated testosterone result in increased exposure and transmission of parasites? Ecol. Lett. 2009;12:528–537. doi: 10.1111/j.1461-0248.2009.01306.x. [DOI] [PubMed] [Google Scholar]
- Grear D.A., Luong L.T., Hudson P.J. Sex-biased transmission of a complex life-cycle parasite: why males matter. Oikos. 2012;121:1446–1453. [Google Scholar]
- Green D.M., Kiss I.Z., Kao R.R. Modelling the initial spread of food-and-mouth disease through animal movements. Proc. R. Soc. Lond. B Biol. Sci. 2006;273:2729–2735. doi: 10.1098/rspb.2006.3648. [DOI] [PMC free article] [PubMed] [Google Scholar]
- Griffin R.H., Nunn C.L. Community structure and the spread of infectious disease in primate social networks. Evol. Ecol. 2012;26:779–800. [Google Scholar]
- Guirmaraes P.R., Jr, de Menezes M.A., Baird R.W., Lusseau D., Guirmaraes P., Dos Reis S.F. Vulnerability of a killer whale social network to disease outbreaks. Phys. Rev. E. 2007;76:042901. doi: 10.1103/PhysRevE.76.042901. [DOI] [PubMed] [Google Scholar]
- Hamede R.K., Bashford J., McCallum H., Jones M. Contact networks in a wild Tasmanian devil (Sarcophilus harrisii) population: using social network analysis to reveal seasonal variability in social behaviour and its implications for transmission of devil facial tumour disease. Ecol. Lett. 2009;12:1147–1157. doi: 10.1111/j.1461-0248.2009.01370.x. [DOI] [PubMed] [Google Scholar]
- Hamede R.K., Bashford J., Jones M., McCallum H. Simulating devil facial tumour disease outbreaks across empirically derived contact networks. J. Appl. Ecol. 2012;49:447–456. [Google Scholar]
- Hausfater G., Meade B.J. Alternation of sleeping groves by yellow baboons (Papio cynocephalus) as a strategy for parasite avoidance. Primates. 1982;23:287–297. [Google Scholar]
- Hawley D.M., Altizer S.M. Disease ecology meets ecological immunology: understanding the links between organismal immunity and infection dynamics in natural populations. Funct. Ecol. 2011;25:48–60. [Google Scholar]
- Hillegass M.A., Waterman J.M., Roth J.D. The influence of sex and sociality on parasite loads in an African ground squirrel. Behav. Ecol. 2008;19:1006–1011. [Google Scholar]
- Hirsch B.T., Prange S., Hauver S.A., Gehrt S.D. Genetic relatedness does not predict racoon social network structure. Anim. Behav. 2013;85:463–470. [Google Scholar]
- Hoby S., Schwarzenberger F., Doherr M.G., Robert N., Walzer C. Steroid hormone related male biased parasitism in chamois, Rupicapra rupicapra rupicapra. Vet. Parasitol. 2006;138:337–348. doi: 10.1016/j.vetpar.2006.01.028. [DOI] [PubMed] [Google Scholar]
- Humphries M.D., Gurney K. Network ‘small-world-ness’: a quantitative method for determining canconical network equivalence. PLoS ONE. 2008;3:e0002051. doi: 10.1371/journal.pone.0002051. [DOI] [PMC free article] [PubMed] [Google Scholar]
- Jacobs L.F., Gaulin S.J.C., Sherry D.F., Hoffman G.E. Evolution of spatial cognition: sex-specific patterns of spatial behavior predict hippocampal size. Proc. Natl. Acad. Sci. U.S.A. 1990;87:6349–6352. doi: 10.1073/pnas.87.16.6349. [DOI] [PMC free article] [PubMed] [Google Scholar]
- James R., Croft D.P., Krause J. Potential banana skins in animal social network analysis. Behav. Ecol. Sociobiol. 2009;63:989–997. [Google Scholar]
- Johnson J.B., Omland K.S. Model selection in ecology and evolution. Trends Ecol. Evol. 2004;19:101–108. doi: 10.1016/j.tree.2003.10.013. [DOI] [PubMed] [Google Scholar]
- Johnson P.T.J., Dobson A.P., Lafferty K.D., Marcogliese D.J., Memmott J., Orlofske S.A., Poulin R., Thieltges D.W. When parasites become prey: ecological and epidemiological significance of eating parasites. Trends Ecol. Evol. 2010;25:362–371. doi: 10.1016/j.tree.2010.01.005. [DOI] [PubMed] [Google Scholar]
- Kao R.R., Green D.M., Johnson J., Kiss I.Z. Disease dynamics over very different time-scales: food-and-mouth disease and scrapie on the network of livestock movements in the UK. J. R. Soc. Interface. 2007;4:907–916. doi: 10.1098/rsif.2007.1129. [DOI] [PMC free article] [PubMed] [Google Scholar]
- Keeling M.J., Eames K.T.D. Networks and epidemic models. J. R. Soc. Interface. 2005;2:295–307. doi: 10.1098/rsif.2005.0051. [DOI] [PMC free article] [PubMed] [Google Scholar]
- Konschake M., Lentz H.H.K., Conraths F.J., Hovel P., Selhorst T. On the robustness of in- and out-components in a temporal network. PLoS ONE. 2013;8:e55223. doi: 10.1371/journal.pone.0055223. [DOI] [PMC free article] [PubMed] [Google Scholar]
- Krasnov B.R., Morand S., Hawlena H., Khokhlova I.S., Shenbrot G.I. Sex-biased parasitism, seasonality and sexual size dimorphism in desert rodents. Oecologia. 2005;146:209–217. doi: 10.1007/s00442-005-0189-y. [DOI] [PubMed] [Google Scholar]
- Krasnov B.R., Bordes F., Khokhlova I.S., Morand S. Gender-biased parasitism in small mammals: patterns, mechanisms, consequences. Mammalia. 2012;76:1–13. [Google Scholar]
- Krause S., Mattner L., James R., Guttridge T., Corcoran M.J., Gruber S.H., Krause J. Social network analysis and valid Markov chain Monte Carlo tests of null models. Behav. Ecol. Sociobiol. 2009;63:1089–1096. [Google Scholar]
- Krause, J., Krause, S., Arlinghaus, R., Psorakis, I., Roberts, S., Rutz, C., 2013. Reality mining of animal social systems. Trends Ecol. Evol. (in press). http://dx.doi.org/10.1016/j.tree.2013.06.002. [DOI] [PubMed]
- Kretzschmar M., Morris M. Measures of concurrency in networks and the spread of infectious disease. Math. Biosci. 1996;133:165–195. doi: 10.1016/0025-5564(95)00093-3. [DOI] [PubMed] [Google Scholar]
- Lafferty K.D., Allesina S., Arim M., Briggs C.J., De Leo G., Dobson A.P., Dunne J.A., Johnson P.T.J., Kuris A.M., Marcogliese D.J., Martinez N.D., Memmott J., Marquet P.A., McLaughlin J.P., Mordecai E.A., Pascual M., Poulin R., Thieltges D.W. Parasites in food webs: the ultimate missing links. Ecol. Lett. 2008;11:533–546. doi: 10.1111/j.1461-0248.2008.01174.x. [DOI] [PMC free article] [PubMed] [Google Scholar]
- Langwig K.E., Frick W.F., Bried J.T., Hicks A.C., Kunz T.H., Kilpatrick A.M. Sociality, density-dependence and microclimates determine the persistence of populations suffering from a novel fungal disease, white-nose syndrome. Ecol. Lett. 2012;15:1050–1057. doi: 10.1111/j.1461-0248.2012.01829.x. [DOI] [PubMed] [Google Scholar]
- Leroy E.M., Rouquet P., Formenty P., Souquiere S., Kilbourne A., Froment J., Bermejo M., Smit S., Karesh W., Swanepoel R., Zaki S.R., Rollin P.E. Multiple Ebola virus transmission events and rapid decline of central African wildlife. Science. 2004;303:387–390. doi: 10.1126/science.1092528. [DOI] [PubMed] [Google Scholar]
- Leu S.T., Kappeler P.M., Bull C.M. Refuge sharing network predicts ectoparasite load in a lizard. Behav. Ecol. Sociobiol. 2010;64:1495–1503. doi: 10.1007/s00265-010-0964-6. [DOI] [PMC free article] [PubMed] [Google Scholar]
- Liu Y.-Y., Slotine J.-J., Barabasi A.-L. Controllability of complex networks. Nature. 2011;473:167–173. doi: 10.1038/nature10011. [DOI] [PubMed] [Google Scholar]
- Lloyd-Smith J.O., Schreiber S.J., Kopp P.E., Getz W.M. Superspreading and the effect of individual variation on disease emergence. Nature. 2005;438:355–359. doi: 10.1038/nature04153. [DOI] [PMC free article] [PubMed] [Google Scholar]
- Loehle C. Social barriers to pathogen transmission in wild animal populations. Ecology. 1995;76:326–335. [Google Scholar]
- Lusseau D., Schneider K., Boisseau O.J., Haase P., Slooten E., Dawson S.M. The bottlenose dolphin community of Doubtful Sound features a large proportion of long-lasting associations. Behav. Ecol. Sociobiol. 2003;54:396–405. [Google Scholar]
- Lusseau D., Wilson B., Hammond P.S., Grellier K., Durban J.W., Parsons K.M., Barton T.R., Thompson P.M. Quantifying the influence of sociality on population structure in bottlenose dolphins. J. Anim. Ecol. 2006;75:14–24. doi: 10.1111/j.1365-2656.2005.01013.x. [DOI] [PubMed] [Google Scholar]
- MacIntosh A.J.J., Jacobs A., Garcia C., Shimizu K., Mouri K., Huffman M.A., Hernandez A.D. Monkeys in the middle: parasite transmission through the social network of a wild primate. PLoS ONE. 2012;7:e51144. doi: 10.1371/journal.pone.0051144. [DOI] [PMC free article] [PubMed] [Google Scholar]
- Madison D.M. Space use and social structure in meadow voles, Microtus pennsylvanicus. Behav. Ecol. Sociobiol. 1980;7:65–71. [Google Scholar]
- Maher S.P., Kramer A.M., Pulliam J.T., Zokan M.A., Bowden S.E., Barton H.D., Magori K., Drake J.M. Spread of white-nose syndrome on a network regulated by geography and climate. Nat. Commun. 2012;3:1306. doi: 10.1038/ncomms2301. [DOI] [PubMed] [Google Scholar]
- Mantel N. The detection of disease clustering and a generalized regression approach. Cancer Res. 1967;27:209–220. [PubMed] [Google Scholar]
- McCallum H. Disease and the dynamics of extinction. Proc. R. Soc. Lond. B Biol. Sci. 2012;367:2828–2839. doi: 10.1098/rstb.2012.0224. [DOI] [PMC free article] [PubMed] [Google Scholar]
- Meyers L.A., Pourbohloul B., Newman M.E.J., Skowronski D.M., Brunham R.C. Network theory and SARS: predicting outbreak diversity. J. Theor. Biol. 2005;232:71–81. doi: 10.1016/j.jtbi.2004.07.026. [DOI] [PMC free article] [PubMed] [Google Scholar]
- Moller A.P., Dufva R., Allander K. Parasites and the evolution of host social behavior. Adv. Study Behav. 1993;22:65–102. [Google Scholar]
- Moore S.L., Wilson K. Parasites as a viability cost of sexual selection in natural populations of mammals. Science. 2002;297:2015–2018. doi: 10.1126/science.1074196. [DOI] [PubMed] [Google Scholar]
- Naug D. Structure of the social network and its influence on transmission dynamics in a honeybee colony. Behav. Ecol. Sociobiol. 2008;62:1719–1725. [Google Scholar]
- Newman M.E.J. Spread of epidemic disease on networks. Phys. Rev. E. 2002;66:016128. doi: 10.1103/PhysRevE.66.016128. [DOI] [PubMed] [Google Scholar]
- Newman M.E.J. Mixing patterns in networks. Phys. Rev. E. 2003;67:026126. doi: 10.1103/PhysRevE.67.026126. [DOI] [PubMed] [Google Scholar]
- Nunn C.L., Altizer S., Jones K.E., Sechrest W. Comparative tests of parasite species richness in primates. Am. Nat. 2003;162:597–614. doi: 10.1086/378721. [DOI] [PubMed] [Google Scholar]
- Opsahl T., Agneessens F., Skvoretz J. Node centrality in weighted networks: generalizing degree and shortest paths. Soc. Netw. 2010;32:245–251. [Google Scholar]
- Otterstatter M.C., Thomson J.D. Contact networks and transmission of an intestinal pathogen in bumble bee (Bombus impatiens) colonies. Oecologia. 2007;154:411–421. doi: 10.1007/s00442-007-0834-8. [DOI] [PubMed] [Google Scholar]
- Patterson J.E.H., Ruckstuhl K.E. Parasite infection and host group size: a meta-analytical review. Parasitology. 2013;140:803–813. doi: 10.1017/S0031182012002259. [DOI] [PMC free article] [PubMed] [Google Scholar]
- Paull S.H., Song S., McClure K.M., Sackett L.C., Kilpatrick A.M., Johnson P.T.J. From superspreaders to disease hotspots: linking transmission across hosts and space. Front. Ecol. Environ. 2012;10:75–82. doi: 10.1890/110111. [DOI] [PMC free article] [PubMed] [Google Scholar]
- Perkins S.E., Ferrari M.F., Hudson P.J. The effects of social structure and sex-biased transmission on macroparasite infection. Parasitology. 2008;135:1561–1569. doi: 10.1017/S0031182008000449. [DOI] [PubMed] [Google Scholar]
- Perkins S.E., Cagnacci F., Stradiotto A., Arnoldi D., Hudson P.J. Comparison of social networks derived from ecological data: implications for inferring infectious disease dynamics. J. Anim. Ecol. 2009;78:1015–1022. doi: 10.1111/j.1365-2656.2009.01557.x. [DOI] [PubMed] [Google Scholar]
- Perry G., Garland T., Jr. Lizard home ranges revisited: effects of sex, body size, diet, habitat, and phylogeny. Ecology. 2002;83:1870–1885. [Google Scholar]
- Pike T.W., Samanta M., Lindstrom J., Royle N.J. Behavioural phenotype affects social interactions in an animal network. Proc. R. Soc. Lond. B Biol. Sci. 2008;275:2515–2520. doi: 10.1098/rspb.2008.0744. [DOI] [PMC free article] [PubMed] [Google Scholar]
- Piraveenan M., Prokopenko M., Hossain L. Percolation centrality: quantifying graph-theoretic impact of nodes during percolation in networks. PLoS ONE. 2013;8 doi: 10.1371/journal.pone.0053095. [DOI] [PMC free article] [PubMed] [Google Scholar]
- Poiani A. Ectoparasitism as a possible cost of social life: a comparative analysis using Australian passerines (Passeriformes) Oecologia. 1992;92:429–441. doi: 10.1007/BF00317470. [DOI] [PubMed] [Google Scholar]
- Porphyre T., Stevenson M., Jackson R., McKenzie J. Influence of contact heterogeneity on TB reproduction ratio R0 in a free-living brushtail possum Trchosurus vulpecula population. Vet. Res. 2008;39:31. doi: 10.1051/vetres:2008007. [DOI] [PubMed] [Google Scholar]
- Poulin R. Group-living and infestation by ectoparasites in Passerines. Condor. 1991;93:418–423. [Google Scholar]
- Poulin R. Group-living and the richness of the parasite fauna in Canadian freshwater fishes. Oecologia. 1991;86:390–394. doi: 10.1007/BF00317606. [DOI] [PubMed] [Google Scholar]
- Poulin R. Helminth growth in vertebrate hosts: does host sex matter? Int. J. Parasitol. 1996;26:1311–1315. doi: 10.1016/s0020-7519(96)00108-7. [DOI] [PubMed] [Google Scholar]
- Poulin R. Sexual inequalities in helminth infections: a cost of being a male? Am. Nat. 1996;147:287–295. [Google Scholar]
- Poulin R. Parasitism and shoal size in juvenile sticklebacks: conflicting selection pressures from different ectoparasites? Ethology. 1999;105:959–968. [Google Scholar]
- Poulin R. Network analysis shining light on parasite ecology and diversity. Trends Parasitol. 2010;26:492–498. doi: 10.1016/j.pt.2010.05.008. [DOI] [PubMed] [Google Scholar]
- Reckardt K., Kerth G. Roost selection and roost switching of female Bechstein’s bats (Myotis bechsteinii) as a strategy of parasite avoidance. Oecologia. 2007;154:581–588. doi: 10.1007/s00442-007-0843-7. [DOI] [PubMed] [Google Scholar]
- Riolo C.S., Koopman J.S., Chick S.E. Methods and measures for the description of epidemiologic contact networks. J. Urban Health. 2001;78:446–457. doi: 10.1093/jurban/78.3.446. [DOI] [PMC free article] [PubMed] [Google Scholar]
- Robins G., Pattison P., Kalish Y., Lusher D. An introduction to exponential random graph (p∗) models for social networks. Soc. Netw. 2007;29:173–191. [Google Scholar]
- Roelke-Parker M.E., Munson L., Packer C., Kock R., Cleaveland S., Carpenter M., O’Brien S.J., Pospischil A., Hofmann-Lehmann R., Lutz H., Mwamengele G.L.M., Mgasa M.N., Machange G.A., Summers B.A., Appel M.J.G. A canine distemper virus epidemic in Serengeti lions (Panthera leo) Nature. 1996;379:441–445. doi: 10.1038/379441a0. [DOI] [PMC free article] [PubMed] [Google Scholar]
- Rushmore J., Caillaud D., Matamba L., Stumpf R.M., Borgatti S.P., Altizer S. Social network analysis of wild chimpanzees provides insights for predicting infectious disease risk. J. Anim. Ecol. doi. 2013 doi: 10.1111/1365-2656.12088. [DOI] [PubMed] [Google Scholar]
- Ryder T.B., Horton B.M., van den Tillaart M., Morales J.D.D., Moore I.T. Proximity data-loggers increase the quantity and quality of social network data. Biol. Lett. 2012;8:917–920. doi: 10.1098/rsbl.2012.0536. [DOI] [PMC free article] [PubMed] [Google Scholar]
- Schupbach H.U., Baur B. Contact-based transmission models in terrestrial gastropod populations infected with parasitic mites. Int. J. Parasitol. 2010;40:1045–1050. doi: 10.1016/j.ijpara.2010.02.012. [DOI] [PubMed] [Google Scholar]
- Sikic, M., Lancic, A., Antulov-Fantulin, N., Stefancic, H., 2011. Epidemic centrality and the underestimated epidemic impact on network peripheral nodes. arXiv 1110.2558 [physics.soc-ph].
- Skorping A., Jensen K.H. Disease dynamics: all caused by males? Trends Ecol. Evol. 2004;19:219–220. doi: 10.1016/j.tree.2004.02.006. [DOI] [PubMed] [Google Scholar]
- Sukhdeo M.V.K. Food webs for parasitologists: a review. J. Parasitol. 2010;96:273–284. doi: 10.1645/GE-2254.1. [DOI] [PubMed] [Google Scholar]
- Thompson R.C.A., Lymbery A.J., Smith A. Parasites, emerging disease and wildlife conservation. Int. J. Parasitol. 2010;40:1163–1170. doi: 10.1016/j.ijpara.2010.04.009. [DOI] [PubMed] [Google Scholar]
- Tomkiewicz S.M., Fuller M.R., Kie J.G., Bates K.K. Global positioning system and associated technologies in animal behaviour and ecological research. Proc. R. Soc. Lond. B Biol. Sci. 2010;365:2163–2176. doi: 10.1098/rstb.2010.0090. [DOI] [PMC free article] [PubMed] [Google Scholar]
- Tompkins D.M., Dunn A.M., Smith M.J., Telfer S. Wildlife diseases: from individuals to ecosystems. J. Anim. Ecol. 2011;80:19–38. doi: 10.1111/j.1365-2656.2010.01742.x. [DOI] [PubMed] [Google Scholar]
- Vitone N.D., Altizer S., Nunn C.L. Body size, diet and sociality influence hte species richness of parasitic worms in anthropoid primates. Evol. Ecol. Res. 2004;6:183–199. [Google Scholar]
- Watts D.J. Princeton University Press; Princeton, New Jersey, USA: 1999. Small Worlds. [Google Scholar]
- Wedekind C., Jakobsen P.J. Male-biased susceptibility to helminth infection: an experimental test with a copepod. Oikos. 1998;81:458–462. [Google Scholar]
- Wendland L.D., Wooding J., LeAnn W.C., Demcovitz D., Littell R., Berish J.D., Ozgul A., Oli M.K., Klein P.A., Christman M.C., Brown M.B. Social behavior drives the dynamics of respiratory disease in threatened tortoises. Ecology. 2010;91:1257–1262. doi: 10.1890/09-1414.1. [DOI] [PubMed] [Google Scholar]
- Whitehead H. SOCPROG programs: analysing animal social structures. Behav. Ecol. Sociobiol. 2009;63:765–778. [Google Scholar]
- Wolf J.B.W., Trillmich F. Kin in space: social viscosity in a spatially and genetically substructured network. Proc. R. Soc. Lond. B Biol. Sci. 2008;275:2063–2069. doi: 10.1098/rspb.2008.0356. [DOI] [PMC free article] [PubMed] [Google Scholar]
- Zohdy S., Kemp A.D., Durden L.A., Wright P.C., Jernvall J. Mapping the social network: tracking lice in a wild primate (Microcebus rufus) population to infer social contacts and vector potential. BMC Ecol. 2012;12:4. doi: 10.1186/1472-6785-12-4. [DOI] [PMC free article] [PubMed] [Google Scholar]
- Zuk M., McKean K.A. Sex differences in parasite infections: patterns and processes. Int. J. Parasitol. 1996;26:1009–1024. [PubMed] [Google Scholar]