Abstract
Reactive oxygen species (ROS) are known to be a key factor in the development of cancer, and many exogenous sources are supposed to be related to the formation of ROS. In this paper, a microfluidic chip was developed for studying the production of ROS in lung cancer cells under different chemical and physical stimuli. This chip has two unique features: (1) five relative concentrations of 0, 1/8, 1/2, 7/8, and 1 are achieved in the culture regions; (2) a shear stress gradient is produced inside each of the five culture areas. Lung cancer cells were seeded inside this biocompatible chip for investigating their response to different concentrations of H2O2, a chemical stimulus known to increase the production of ROS. Then the effect of shear stress, a physical stimulus, on lung cancer cells was examined, showing that the production of ROS was increased in response to a larger shear stress. Finally, two antioxidants, α-tocopherol and ferulic acid, were used to study their effects on reducing ROS. It was found that high-dose α-tocopherol was not able to effectively eliminate the ROS produced inside cells. This counter effect was not observed in cells cultured in a traditional chamber slide, where no shear stress was present. This result suggests that the current microfluidic chip provides an in vitro platform best mimicking the physiological condition where cells are under circulating conditions.
INTRODUCTION
Reactive oxygen species (ROS), including oxygen ions (such as O2−) and peroxides (such as H2O2), are known as an important indicator when cells are subject to environmental stresses (such as UV or heat exposure). ROS, mainly produced in the mitochondrion during oxidative phosphorylation,1 are natural byproducts of the normal metabolism of oxygen and have important roles in cell signaling and homeostasis.2, 3, 4 Normally, the amount of ROS is maintained at the basal and nontoxic level via the regulation of the antioxidant defense system of cells. Excess ROS, the so-called oxidative stress, can lead to cell damage and apoptosis5, 6, 7, 8 and is found to be related to the development of certain diseases such as Parkinson's disease,9, 10, 11, 12 Alzheimer's disease,13, 14, 15 atherosclerosis,16, 17, 18 and heart failure.19, 20, 21 Especially, it has long been suggested that ROS are critically involved in cancer cell functions.22 ROS were experimentally shown to regulate certain tumor-associated biomolecules, cellular processes, or cells, including p53 protein,23, 24, 25 epithelial-mesenchymal transition,26, 27, 28 epithelial-stromal metabolic coupling,29 angiogenesis,30 and cancer stem cells.31, 32, 33 Further understanding of the underlying mechanism of how ROS affect tumor growth and metastasis will definitely help in the development of ROS-mediated anticancer therapies. Some possible reasons for the excess production of ROS in cells include (1) short-term increase in ROS after exhaustive exercise,34, 35, 36, 37 (2) exogenous ROS sources such as UV, ionizing radiation, pollutants, environmental toxins, etc., and (3) diseases such as hypertension,38 cardiac disease, and diabetes.39, 40 Those exogenous ROS sources are commonly referred to as carcinogen.
Take lung cancer as an example, tobacco smoke is the main source of ROS in the lungs of smokers, in turn increasing the risk in the development of cancer. Cigarette smoke, consisting of more than 5000 chemicals, produces not only exogenous ROS via each puff but also endogenous ROS through the activation of phagocytes in the respiratory tract.41, 42 It was reported that these ROS regulate the expression level of Caveolin-1 (Cav-1), a protein playing a critical role in the migration and invasion of human lung carcinoma cells.43 Clinically, the increased Cav-1 expression level is associated with the enhanced metastatic ability of cancer cells and the poor survival rate of patients.44 However, even with excess ROS produced in their lungs, only a small percentage of smokers develop lung cancer.45 The well-established antioxidant defense system of lung cells may be a reason. Therefore, it is generally believed that antioxidant foods and supplements (such as vitamin A and E) can be useful in cancer prevention. In addition to smoke, surface tension (or shear stress) of cells was demonstrated to be involved in the production of ROS,46, 47 indirectly affecting the development of lung cancer. For example, extra surface tension due to insufficient pulmonary surfactants can cause injury to the delicate lung epithelial cells.48
In the past, many experiments have been conducted to investigate how increased ROS level is related to ROS-related diseases, and as a result, different antioxidants or ROS scavengers were studied and shown to reduce the production of ROS in cells.49, 50, 51, 52 However, most of these studies were done under a static condition such as culture dishes, which were different from the in vivo dynamic circulatory system. Also, in these studies, the shear stress applied on the cells was not precisely controlled. In order to systematically and quantitatively study how human lung cancer cells response to ROS stimuli, antioxidants, and fluidic shear stress, using ROS as the indicator, a microfluidic chip was designed to best mimic the physiological condition. This chip is biocompatible for seeding and culturing cells, as well as transparent for observation of cellular morphology and production of ROS. The shear stress inside the culture area can be controlled via channel dimensions and flow rates. The whole design mimicking the in vivo circulatory system was used to study the cellular responses, mainly in the production of ROS, of human lung cancer CL1-5 cells under conditions including (1) different concentrations of H2O2 stimuli, (2) different shear stresses, and (3) different concentrations of antioxidants.
MATERIALS AND METHODS
Chip design and fabrication
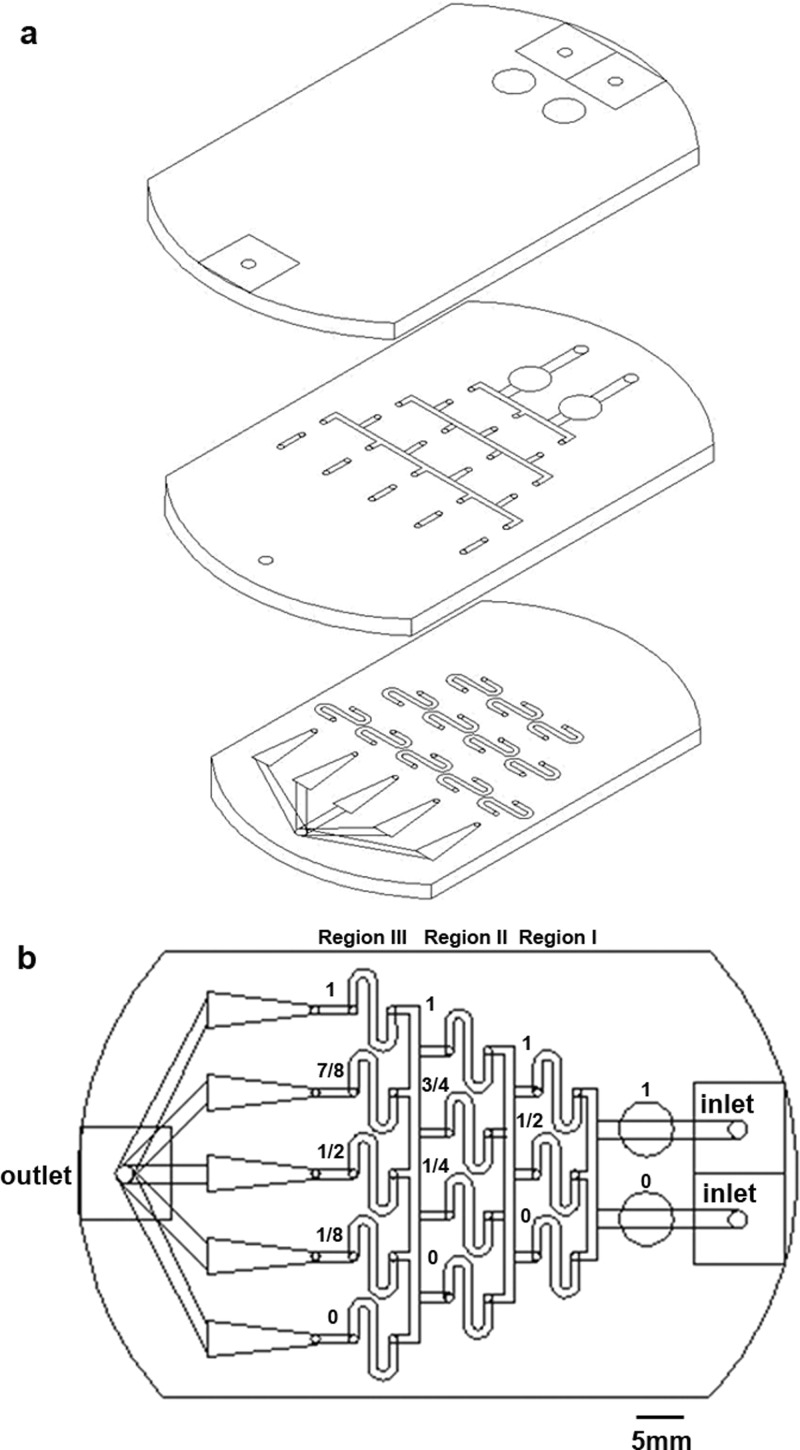
The design of the microfluidic chip is shown in Fig. 1. The pattern was drawn in AutoCAD (Autodesk) and then loaded into a CO2 laser scriber (M-300, Universal Laser Systems or ILS2, Laser Tools & Technics Corp.) to ablate desired patterns on PMMA substrates.53, 54, 55 Three layers (Fig. 1a, thickness = 1 mm) were bound together via double-sided tapes (8018, 3M) to form the integrated chip (Fig. 1b), which was then attached to a Petri dish (Nunc). The top layer had three small holes serving as medium inlet (two on the right) and outlet (one on the left), and two big holes for trapping bubbles. The middle and bottom layers provided fluidic channels having a width of 1 mm. Five triangular areas on the bottom layer, with widths varying from 1 to 4 mm, were used for cell culture and observation. Cytotoxicity of PMMA substrates and double-sided tapes on cells was examined, and no significant change in cell viability was observed.56
Figure 1.
Design of the microfluidic chip. Three layers of PMMA in (a) were bound together to form the integrated chip in (b).
Calculation and simulation of concentration and shear stress
As shown in Fig. 1b, when two solutions with relative concentrations of 1 and 0 were injected from the top and bottom inlets, respectively, relative concentrations of 1, (1 + 0)/2, and 0 could be achieved after the first separation and mixture (region I). Then relative concentrations of 1, (1 + 1/2)/2, (1/2 + 0)/2, and 0 could be attained after the second separation and mixture (region II). Finally, relative concentrations of 1, (1 + 3/4)/2, (3/4 + 1/4)/2, (1/4 + 0)/2, and 0 could be achieved after the third separation and mixture (region III) in the five downstream triangular regions. Here, we assume that all liquids split-flowed smoothly and equally around the fork. A similar concentration gradient generator was reported earlier for evaluating toxicity and teratogenicity of drugs on embryonic zebrafish developmental dynamics.57 The shear stress (τ) within the cell culture area is related to the volume flow rate (Q), fluidic viscosity (η), and dimensions of the channel (height h and width w) as .58 By setting Q = 0.3 ml/min in the inlet (0.12 ml/min in each triangle), η = 0.0008 Pa·s for medium, and w = 1–4 mm, the shear stress was calculated to range from 0.0048 Pa (4 mm wide) to 0.0192 Pa (1 mm wide). Numerical simulations of concentration and shear stress were performed using commercial CFD-ACE+ suite applications (CFD-GEOM, CFD-ACE, and CFD-VIEW) (ESI Group). The viscosity and volume flow rate of the medium were set to be the same as those used in the calculation.
Cell preparation
Lung cancer cell line CL1-5 was kindly provided by Dr. Pan-Chyr Yang (National Taiwan University, College of Medicine).59, 60 A complete medium composed of Dulbecco's Modified Eagle's medium (DMEM, Gibco) and 10% fetal bovine serum (FBS, Invitrogen) was used for cell culture. Cells were incubated in tissue culture poly-styrene (TCPS) flasks (Corning) in 5% CO2 at 37 °C until 90% confluence before seeding into the microfluidic chip.
Experimental system and procedure
Chip assembly and cell preparation
The microfluidic chip was assembled inside the laminar flow hood. The inlets were connected to two syringes driven by syringe pumps (NE-300, New Era). 1× phosphate buffered saline (PBS) was flowed into the chip and kept within the channel overnight under 5% CO2 at 37 °C. Then the syringes were pushed gently by hands to remove bubbles, and 1× PBS was replaced with DMEM. 106 cells suspended in 3 ml DMEM with 10% FBS was loaded into the triangular culture areas by injecting the solution from the outlet. The chip with seeded cells was placed inside the incubator for 12 h before further experiments.
H2O2 and shear stress experiments
For temperature control during experiments, the microfluidic chip was mounted on top of a transparent indium tin oxide (ITO) glass (Part No. 300739, Merck) which is connected to a proportional-integral-derivative (PID) controller (TTM-J4-R-AB, JETEC Electronics Co.) for maintaining the temperature at 37 ± 0.5 °C via feedback from a thermal couple (TPK-02A, TECPEL) clamped tightly between the heater and the chip. Then two syringes containing H2O2 of 0 and 200 μM in DMEM were connected to the inlets of the chip and driven by pumps at a volume flow rate of 0.3 ml/min. The H2O2 solutions were continuously flowed into the chip for 1 h. The intracellular ROS level is measured using a fluorescence-based indicator named 2′-7′-dichlorodihydrofluoresce diacetate (2′-7′-DCFDA). This fluorophore has excitation and emission wavelengths around 488 nm and 524 nm, respectively, and to make DCFDA fluoresce, the molecule must become de-acetylated and oxidized. After H2O2 stimuli, the cultured cells inside the microfluidic chip were incubated with DCFDA (10 μM in DMEM) for 15 min before washing with 1× PBS for another 30 min. Fluorescent images of different field of views (FOVs) were captured using an inverted fluorescent microscope (TS-100, Nikon) equipped with a CCD camera (DS-Qi1, Nikon).
Antioxidant experiments
After 12-h incubation, the chip was placed on top of an ITO glass for temperature control. α-tocopherol and ferulic acid were used as antioxidants to study their effects on reducing the production of ROS. Two syringes containing α-tocopherol of 0 and 25 μg/ml or ferulic acid of 0 and 50 mM (all mixed with 200 μM H2O2) were connected to the inlets of the chip and driven by pumps at a volume flow rate of 0.3 ml/min. Concentrations of these compounds were selected for testing their best antioxidant activities.61, 62 The antioxidant solutions were continuously flowed into the chip for 1 h, and then the cells were incubated with 10 μM DCFDA for 15 min before washing with 1× PBS for another 30 min. Again, fluorescent images were captured using an inverted fluorescent microscope.
Antioxidant experiments without flowing
105 cells in DMEM + 10% FBS was pipetted into each of the 8 wells in a chamber slide (Millipore). After incubation under 5% CO2 at 37 °C for 12 h, the medium was replaced with a mixture of H2O2 (50 μM) and α-tocopherol (0, 5, 10, or 25 μg/ml) in DMEM for 1 h. Then the mixture was replaced with 10 μM DCFDA for 15 min. Following a 1× PBS wash for 3 times, the cells in each well were imaged using an inverted fluorescent microscope.
Data analysis
Fluorescent intensity of cells was analyzed by ImageJ software (National Institute of Health (NIH)). For each FOV, a polygon was drawn to enclose a cell, and the mean intensity within the area was calculated. Background intensity was then subtracted out to obtain the absolute signal. For each experimental condition, more than 20 cells were selected from 3 independent experiments for data analysis. Standard error of the mean (SEM) was added to the data.
RESULTS AND DISCUSSION
Simulation of concentration and shear stress
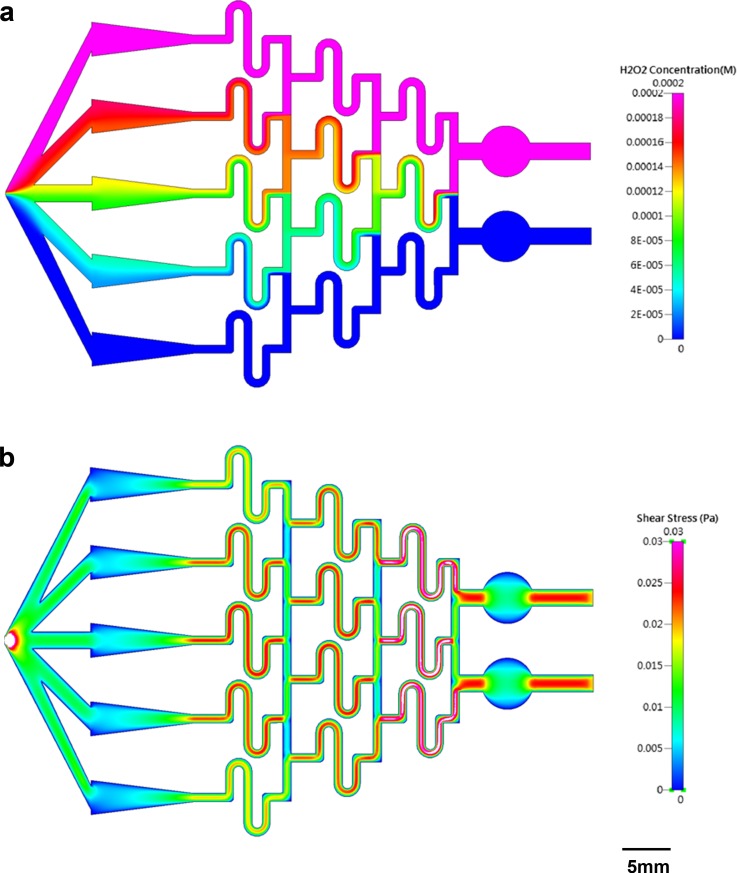
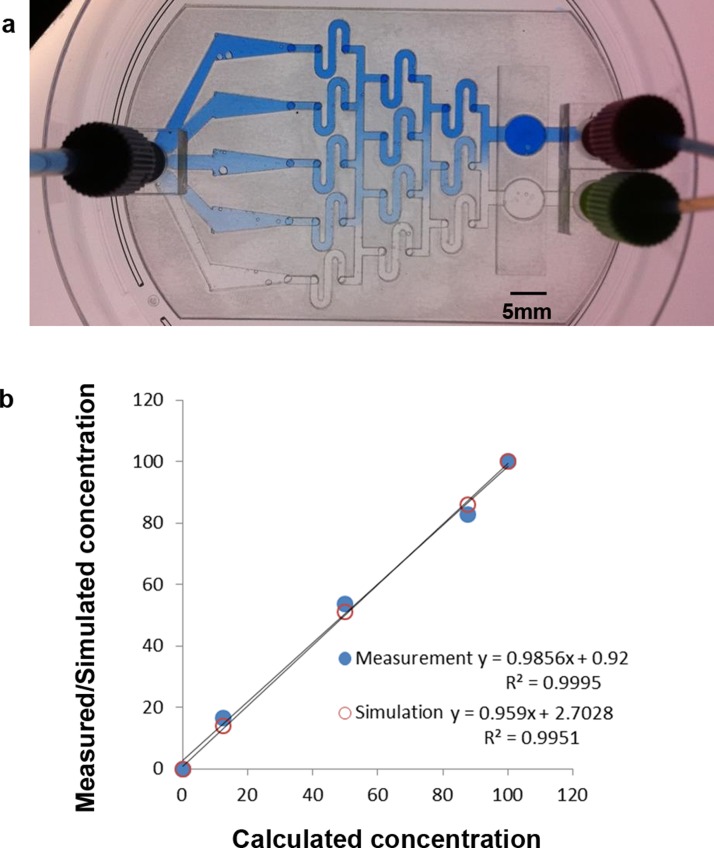
Fig. 2a shows the numerical simulation of H2O2 concentration inside the microfluidic chip, where the concentrations in the two inlets are 0 and 200 μM, respectively. Although the value is not quite uniform across any of the triangles, the concentration along the horizontal middle line of each area is almost equal to the calculated one, being 0, 25, 100, 175, or 200 μM. Therefore, during observation, the FOVs were chosen to be located along the horizontal middle line of each triangle. Fig. 2b shows the numerical simulation of shear stress inside the microfluidic chip. Again, though not uniform across each triangle, the simulated value is very close to the calculated one along the horizontal middle line, ranging from 0.0048 Pa (the widest part of the triangle) to 0.0192 Pa (the narrowest part of the triangle). To verify the distribution of concentration experimentally, blue dye (0.05% (w/v) bromophenol blue; 0.05% (w/v) xylene cyanol FF) in DI water was used as a tracing dye for observing the concentration difference. Blue dye in DI water and DI water only were continuously flowed into the two inlets of the chip for 1 h, and the whole chip was imaged using an inverted microscope, as shown in Fig. 3a. The absolute intensity along the horizontal middle line of each triangle was measured using ImageJ, and these values, together with the simulated values, were plotted against the calculated ones (see Fig. 3b). Very good correlation was obtained between calculation and measurement (R2 = 0.9995) as well as between calculation and simulation (R2 = 0.9951).
Figure 2.
(a) Numerical simulation of H2O2 concentration inside the microfluidic chip. The concentrations in the two inlets are 0 and 200 μM, respectively. (b) Numerical simulation of shear stress inside the microfluidic chip. The volume flow rate is set at 0.3 ml/min.
Figure 3.
(a) Image of the microfluidic chip with blue dye and DI water continuously flowing into the two inlets. (b) Measured and simulated concentrations plotted against calculated values.
Production of ROS under different concentrations of H2O2
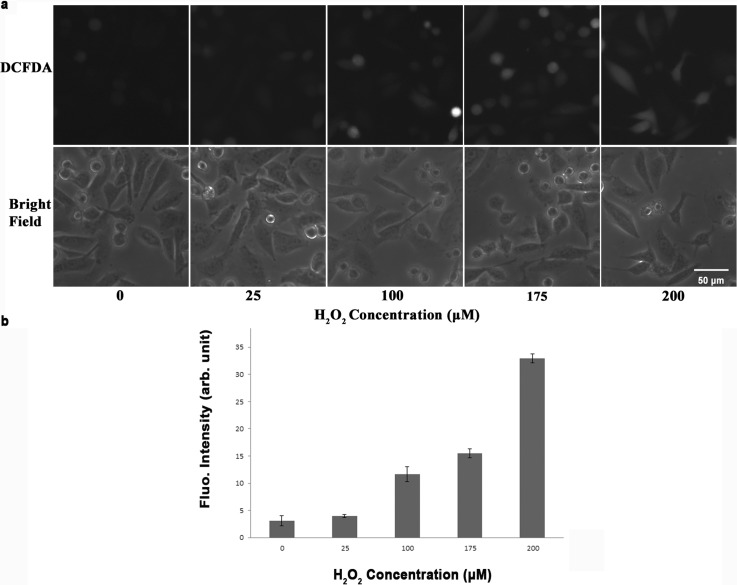
To investigate the effect of H2O2 on the production of ROS, CL 1–5 cells were incubated with continuous flowing of H2O2 at concentrations of 0, 25, 100, 175, and 200 μM. Fluorescent images were taken with FOVs in the center of each of the five triangular culture areas so that the concentration was most close to the calculated value. Fig. 4a top and bottom show the fluorescent and bright-filed images of the cells, respectively, with H2O2 concentrations of 0, 25, 100, 175, and 200 μM from left to right. The fluorescent intensity was analyzed and quantified by ImageJ with at least 20 cells selected from 3 independent experiments. Fig. 4b shows the mean fluorescent intensity with SEM at different H2O2 concentrations. The mean intensities (in arbitrary unit), which are proportional to the amounts of produced ROS, were 3.1, 3.9, 11.7, 15.5, and 32.9 for 0, 25, 100, 175, and 200 μM H2O2, respectively. This result suggests that H2O2 stimulate the production of ROS in a concentration-dependent way. The higher the concentration of H2O2 was, the more the ROS was produced.
Figure 4.
(a) Top: Fluorescent images of CL 1-5 cells after being treated with different concentrations of H2O2. Bottom: Bright-field images of CL 1-5 cells under the same FOVs. (b) Mean fluorescent intensity with SEM plotted at different concentrations of H2O2.
Production of ROS under different shear stresses
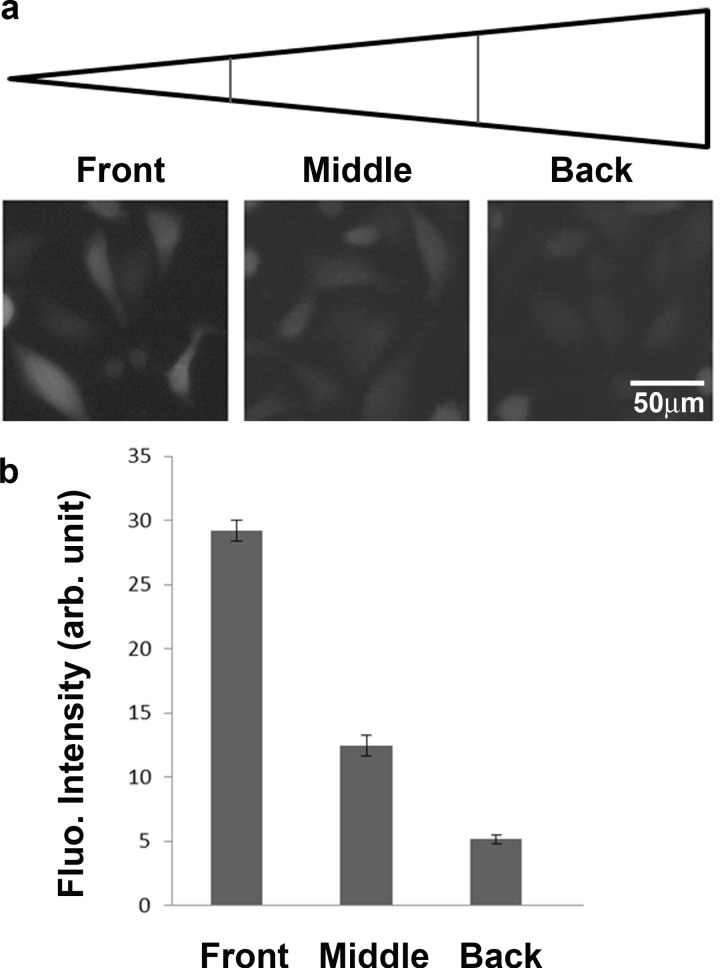
The microfluidic chip designed and fabricated in this study also allows us to investigate the effect of shear stress on the production of ROS. At a volume flow rate of 0.3 ml/min, the shear stress inside each of the five triangles was calculated and simulated to range from 0.0048 to 0.0192 Pa. Fig. 5a shows the fluorescent images of cells from the 200 μM H2O2 culture area, which was divided into three regions: the front with τ = 0.0144–0.0192 Pa, the middle with τ = 0.0096–0.0144 Pa, and the back τ = 0.0048–0.0096 Pa. All FOVs were selected in the center of the three regions. Fig. 5b shows the mean intensity with SEM, being 29.2, 12.6, and 5.1 in the front, middle, and back regions, respectively. Although the fluorescent signal was a result from a combination of both H2O2 and shear stress stimuli, it was obvious that higher shear stress induced more production of ROS. Other references have also shown that shear stress could affect the production of ROS in endothelial cells.63, 64
Figure 5.
(a) Fluorescent images of CL 1-5 cells under different shear stresses. (b) Mean fluorescent intensity with SEM plotted at different shear stresses.
Production of ROS under different concentrations of antioxidants
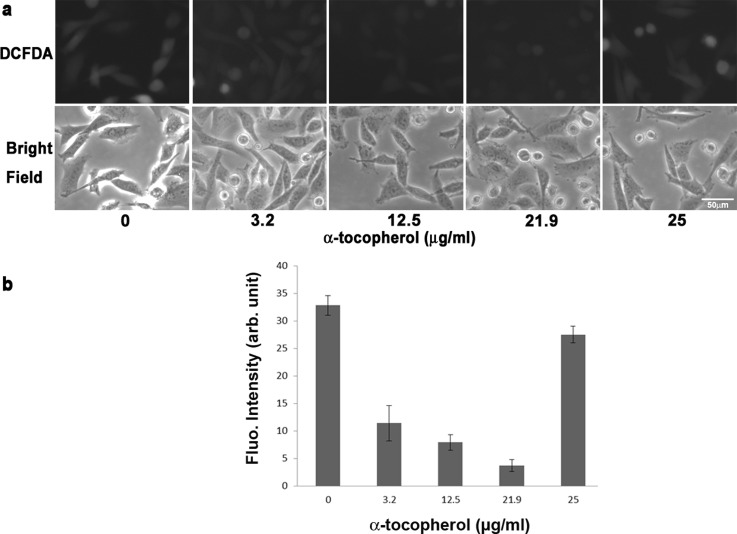
The same microfluidic chip was used to study the production of ROS in response to different concentrations of antioxidants. The first antioxidant to be examined is α-tocopherol, which is a form of vitamin E and is preferentially absorbed and accumulated in humans. After continuous flowing of a mixture of α-tocopherol and 200 μM H2O2, fluorescent images were taken with FOVs located in the center of each of the five triangular culture areas. Fig. 6a top and bottom show the fluorescent and bright-filed images of the cells, respectively, with antioxidant concentrations of 0, 3.2, 12.5, 21.9, and 25 μg/ml from left to right. The mean intensity with SEM was plotted in Fig. 6b. As shown in the figure, with a concentration lower than 22 μg/ml, α-tocopherol was able to eliminate the ROS produced inside cells. Here, the ROS produced was a result of both H2O2 (200 μM) and shear stress (center of the culture area, τ = 0.0096–0.0144 Pa). The mean fluorescent intensities decreased from 31.5 to 9.1, 6.8, and 2.9 at α-tocopherol concentrations of 3.2, 12.5, and 21.9 μg/ml, respectively. However, as the concentration increased to 25 μg/ml, the mean intensity also increased to 26.4, which was close to the value without the antioxidant. The result suggests that, instead of eliminating ROS, this high concentration of α-tocopherol promoted the production of ROS.
Figure 6.
(a) Top: Fluorescent images of CL 1-5 cells after treated with different concentrations of α-tocopherol. Bottom: Bright-field images of CL 1-5 cells under the same FOVs. (b) Mean fluorescent intensity with SEM plotted at different concentrations of α-tocopherol.
Pearson et al. studied the effect of high-dose α-tocopherol on patients with asthma and found that the mortality is higher in patients taking 250 mg of α-tocopherol daily than those taking placebo.65 They concluded that high-dose α-tocopherol could increase the production of pro-oxidant, instead of eliminating the production of ROS, as is the case at lower doses.
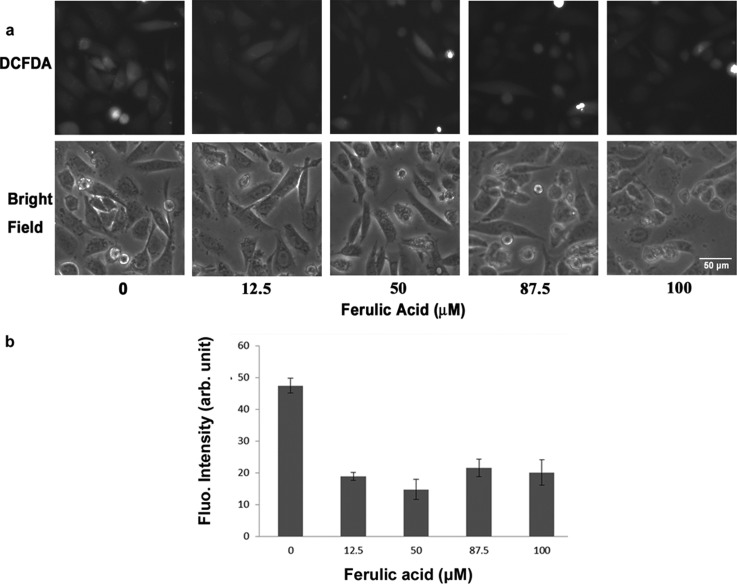
The second antioxidant to be studied is ferulic acid, which is an abundant phenolic phytochemical found in plant and is reactive toward free radicals such as ROS. Following the same procedure, the fluorescent and bright-filed images of the cells under antioxidant concentrations of 0, 12.5, 50, 87.5, and 100 μM were shown in the top and bottom of Fig. 7a, respectively. As indicated in Fig. 7b, the mean fluorescent intensity decreased from 47 to around 15–20 at an antioxidant concentration higher than 12.5 μM. This showed that ferulic acid could eliminate the production of ROS in a concentration-independent way within the range of 12.5–100 μM. Unlike the case of α-tocopherol, no counter effect was observed at high-dose ferulic acid.
Figure 7.
(a) Top: Fluorescent images of CL 1-5 cells after treated with different concentrations of ferulic acid. Bottom: Bright-field images of CL 1-5 cells under the same FOVs. (b) Mean fluorescent intensity with SEM plotted at different concentrations of ferulic acid.
Comparison between circulating and static conditions
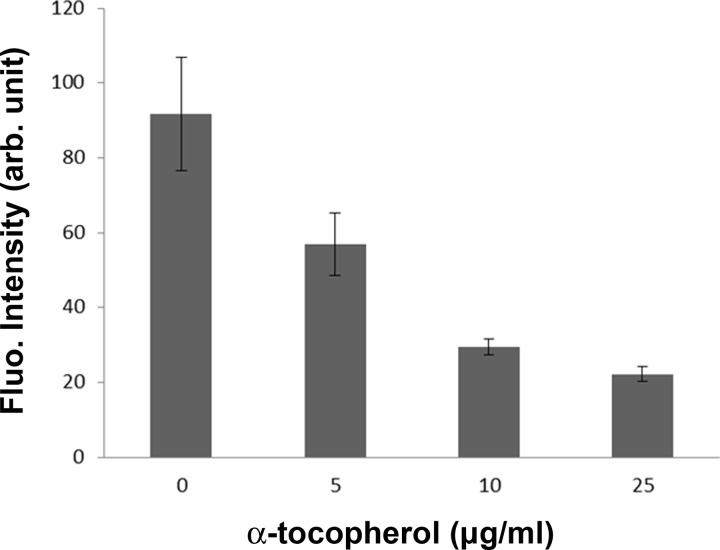
To compare the effect of α-tocopherol on the production of ROS between circulating and static conditions, CL 1-5 cells were cultured inside an 8-well chamber slide and then incubated with α-tocopherol at concentrations of 0, 5, 10, or 25 μg/ml. Under this condition, 25 μg/ml α-tocopherol did not promote a higher production of ROS (data not shown). In another experiment, cells were subject to the stimulus of 50 μM H2O2 together with α-tocopherol under the same static condition. Fluorescent images were taken with FOVs in the center of each well. Fig. 8 shows the mean intensity with SEM. Similarly, it was observed that the higher the concentration of α-tocopherol was, the less the ROS was produced. α-tocopherol still works as an antioxidant at the concentration of 25μg/ml.
Figure 8.
Mean fluorescent intensity with SEM plotted at different concentrations of α-tocopherol for cells incubated in a static condition.
This result was quite different from that shown in Sec. 3D where high-dose α-tocopherol increased the production of ROS instead. Evidences showed that antioxidants could turn into pro-oxidants under certain concentrations and/or intracellular redox states.66 It was reported that coumaric acid and resveratrol were antioxidants at high cellular ROS levels but acted as pro-oxidants as the cellular ROS level was low.66 Moreover, dietary phenolic is often considered as an antioxidant, but the presence of oxygen or transition metals might catalyze its redox cycling and in turn lead to the production of phenoxyl radicals.67 Therefore, to test the antioxidant or pro-oxidant effect of a specific compound under a certain concentration, it is necessary to create an intracellular redox state close to the in vivo condition. It is concluded that to best mimic the physiological condition where cells are affected by circulating fluids such as blood, tissue fluid, or even air, the current microfluidic chip provides an in vitro platform to quantify the effect of shear stress on the production of ROS.
CONCLUSION
In this study, we developed a microfluidic chip for studying the effects of various chemical and physical stimuli on the production of ROS in lung cancer cells. Five different concentrations of H2O2 were produced inside cell culture areas of a single chip. The amount of produced ROS increased as the concentration of H2O2 increased from 0 to 200 μM. A shear stress gradient ranging from 0.0048 to 0.0192 Pa was set up inside each of the triangular culture regions, and it was found that more ROS were generated in cells under larger shear stress. Using the same chip, α-tocopherol at a concentration lower than 22 μg/ml was shown to effectively reduce the production of ROS. However, as the concentration increased to 25 μg/ml, no obvious antioxidant effect was observed. Such opposite effect was not presented in cells either under ferulic acid or under a static condition. The latter case suggests the importance of testing the effects of antioxidants on cells subject to the flowing of fluids. Therefore, the current microfluidic chip can serve as an in vitro system to mimic the in vivo circulatory condition.
ACKNOWLEDGMENTS
This work was financially supported by the National Science Council of Taiwan under Contract No. 101-2112-M-030-003-MY3 (Y. S. Sun) and No. NSC 101-2313-B-002-036-MY3 (K. Y. Lo), and the National Taiwan University Career Development Project (No. 101R7818) (K. Y. Lo). The authors would like to thank Dr. Ji-Yen Cheng for help in fabricating microfluidic chips and Dr. Huai-Fang Chang for help in cell culturing.
References
- Finkel T. and Holbrook N. J., Nature 408(6809), 239–247 (2000). 10.1038/35041687 [DOI] [PubMed] [Google Scholar]
- Browning E. A., Chatterjee S., and Fisher A. B., Annu. Rev. Physiol. 74, 403–424 (2012). 10.1146/annurev-physiol-020911-153324 [DOI] [PMC free article] [PubMed] [Google Scholar]
- Ferrer M. D., Sureda A., Mestre A., Tur J. A., and Pons A., Cell Physiol. Biochem. 25(2–3), 241–252 (2010). 10.1159/000276558 [DOI] [PubMed] [Google Scholar]
- Kovacic P. and Hall M. E., J. Recept. Signal Transduct. Res. 30(1), 1–9 (2010). 10.3109/10799890903517939 [DOI] [PubMed] [Google Scholar]
- Shrotriya S., Deep G., Gu M., Kaur M., Jain A. K., Inturi S., Agarwal R., and Agarwal C., Carcinogenesis 33(4), 848–858 (2012). 10.1093/carcin/bgs019 [DOI] [PMC free article] [PubMed] [Google Scholar]
- Bruzzese F., Rocco M., Castelli S., Di Gennaro E., Desideri A., and Budillon A., Mol. Cancer Ther. 8(11), 3075–3087 (2009). 10.1158/1535-7163.MCT-09-0254 [DOI] [PubMed] [Google Scholar]
- Kim D., Kim Y. J., Seo J. N., Kim J., Lee Y., Park C. S., Kim D. W., Kim D. S., and Kwon H. J., Immunol. Invest. 38(2), 132–152 (2009). 10.1080/08820130802667499 [DOI] [PubMed] [Google Scholar]
- Watt N. T. and Hooper N. M., Biochem. Soc. Trans. 33(Pt 5), 1123–1125 (2005). 10.1042/BST20051123 [DOI] [PubMed] [Google Scholar]
- Koppula S., Kumar H., Kim I. S., and Choi D. K., Mediators Inflamm. 2012, 823902. 10.1155/2012/823902 [DOI] [PMC free article] [PubMed] [Google Scholar]
- Drechsel D. A. and Patel M., Free Radic. Biol. Med. 44(11), 1873–1886 (2008). 10.1016/j.freeradbiomed.2008.02.008 [DOI] [PMC free article] [PubMed] [Google Scholar]
- Tieu K., Ischiropoulos H., and Przedborski S., IUBMB Life 55(6), 329–335 (2003). 10.1080/1521654032000114320 [DOI] [PubMed] [Google Scholar]
- Cassarino D. S., Fall C. P., Swerdlow R. H., Smith T. S., Halvorsen E. M., Miller S. W., Parks J. P., W. D.Parker, Jr., and J. P.Bennett, Jr., Biochim. Biophys. Acta 1362(1), 77–86 (1997). 10.1016/S0925-4439(97)00070-7 [DOI] [PubMed] [Google Scholar]
- Aslan M. and Ozben T., Curr. Alzheimer Res. 1(2), 111–119 (2004). 10.2174/1567205043332162 [DOI] [PubMed] [Google Scholar]
- Multhaup G., Ruppert T., Schlicksupp A., Hesse L., Beher D., Masters C. L., and Beyreuther K., Biochem. Pharmacol. 54(5), 533–539 (1997). 10.1016/S0006-2952(97)00062-2 [DOI] [PubMed] [Google Scholar]
- Benzi G. and Moretti A., Neurobiol. Aging 16(4), 661–674 (1995). 10.1016/0197-4580(95)00066-N [DOI] [PubMed] [Google Scholar]
- Hulsmans M., Van Dooren E., and Holvoet P., Curr. Atheroscler. Rep. 14(3), 264–276 (2012). 10.1007/s11883-012-0237-0 [DOI] [PubMed] [Google Scholar]
- Martinet W., de Meyer G. R., Herman A. G., and Kockx M. M., Eur. J. Clin. Invest. 34(5), 323–327 (2004). 10.1111/j.1365-2362.2004.01343.x [DOI] [PubMed] [Google Scholar]
- Bennett M. R., Circ. Res. 88(7), 648–650 (2001). 10.1161/hh0701.089955 [DOI] [PubMed] [Google Scholar]
- Nediani C., Raimondi L., Borchi E., and Cerbai E., Antioxid. Redox Signal. 14(2), 289–331 (2011). 10.1089/ars.2010.3198 [DOI] [PubMed] [Google Scholar]
- Sorescu D. and Griendling K. K., Congest Heart Fail. 8(3), 132–140 (2002). 10.1111/j.1527-5299.2002.00717.x [DOI] [PubMed] [Google Scholar]
- Tsutsui H., Ide T., Hayashidani S., Suematsu N., Shiomi T., Wen J., Nakamura K., Ichikawa K., Utsumi H., and Takeshita A., Circulation 104(2), 134–136 (2001). 10.1161/01.CIR.104.2.134 [DOI] [PubMed] [Google Scholar]
- Cui X., Antioxid. Redox Signal. 16(11), 1212–1214 (2012). 10.1089/ars.2012.4532 [DOI] [PMC free article] [PubMed] [Google Scholar]
- Gogna R., Madan E., Kuppusamy P., and Pati U., Antioxid. Redox Signal. 16(5), 400–412 (2012). 10.1089/ars.2011.4103 [DOI] [PubMed] [Google Scholar]
- Shukla S. and Gupta S., Free Radic. Biol. Med. 44(10), 1833–1845 (2008). 10.1016/j.freeradbiomed.2008.02.007 [DOI] [PMC free article] [PubMed] [Google Scholar]
- Ostrakhovitch E. A. and Cherian M. G., Apoptosis 10(1), 111–121 (2005). 10.1007/s10495-005-6066-7 [DOI] [PubMed] [Google Scholar]
- Das T. P., Suman S. and Damodaran C., “ Reactive oxygen species generation inhibits epithelial–mesenchymal transition and promotes growth arrest in prostate cancer cells,” Mol. Carcinog. (published online 2013) 10.1002/mc.22014. [DOI] [PMC free article] [PubMed]
- Shimojo Y., Akimoto M., Hisanaga T., Tanaka T., Tajima Y., Honma Y., and Takenaga K., Clin. Exp. Metastasis 30(2), 143–154 (2013). 10.1007/s10585-012-9519-8 [DOI] [PubMed] [Google Scholar]
- Wang Z., Li Y., and Sarkar F. H., Curr. Stem Cell Res. Ther. 5(1), 74–80 (2010). 10.2174/157488810790442813 [DOI] [PMC free article] [PubMed] [Google Scholar]
- Pavlides S., Vera I., Gandara R., Sneddon S., Pestell R. G., Mercier I., Martinez-Outschoorn U. E., Whitaker-Menezes D., Howell A., Sotgia F., and Lisanti M. P., Antioxid. Redox Signal. 16(11), 1264–1284 (2012). 10.1089/ars.2011.4243 [DOI] [PMC free article] [PubMed] [Google Scholar]
- Ushio-Fukai M. and Nakamura Y., Cancer Lett. 266(1), 37–52 (2008). 10.1016/j.canlet.2008.02.044 [DOI] [PMC free article] [PubMed] [Google Scholar]
- Shi X., Zhang Y., Zheng J., and Pan J., Antioxid. Redox Signal. 16(11), 1215–1228 (2012). 10.1089/ars.2012.4529 [DOI] [PMC free article] [PubMed] [Google Scholar]
- Kim H. M., Haraguchi N., Ishii H., Ohkuma M., Okano M., Mimori K., Eguchi H., Yamamoto H., Nagano H., Sekimoto M., Doki Y., and Mori M., Ann. Surg. Oncol. 19(Suppl 3), 539–548 (2012). 10.1245/s10434-011-2040-5 [DOI] [PubMed] [Google Scholar]
- Kobayashi C. I. and Suda T., J. Cell Physiol. 227(2), 421–430 (2012). 10.1002/jcp.22764 [DOI] [PubMed] [Google Scholar]
- Sindler A. L., Reyes R. A., Chen B., Ghosh P., Gurovich A. N., Kang L. S., Cardounel A. J., Delp M. D., and Muller-Delp J. M., J. Appl. Physiol. 114, 681–693 (2013) 10.1152/japplphysiol.00341.2012. [DOI] [PMC free article] [PubMed] [Google Scholar]
- Puente-Maestu L., Tejedor A., Lazaro A., de Miguel J., Alvarez-Sala L., Gonzalez-Aragoneses F., Simon C., and Agusti A., Am. J. Respir. Cell Mol. Biol. 47(3), 358–362 (2012). 10.1165/rcmb.2011-0382OC [DOI] [PubMed] [Google Scholar]
- Filaire E. and Toumi H., Jt., Bone Spine 79(4), 341–346 (2012). 10.1016/j.jbspin.2012.03.007 [DOI] [PubMed] [Google Scholar]
- Barbosa V. A., Luciano T. F., Marques S. O., Vitto M. F., Souza D. R., Silva L. A., Santos J. P., Moreira J. C., Dal-Pizzol F., Lira F. S., Pinho R. A., and De Souza C. T., Int. J. Cardiol. 167(6), 2983–2988 (2012) 10.1016/j.ijcard.2012.08.050. [DOI] [PubMed] [Google Scholar]
- Tam Tam K. B., Lamarca B., Arany M., Cockrell K., Fournier L., Murphy S., J. N.Martin, Jr., and Granger J. P., Am. J. Hypertens. 24(1), 110–113 (2011). 10.1038/ajh.2010.180 [DOI] [PMC free article] [PubMed] [Google Scholar]
- Inoguchi T., Li P., Umeda F., Yu H. Y., Kakimoto M., Imamura M., Aoki T., Etoh T., Hashimoto T., Naruse M., Sano H., Utsumi H., and Nawata H., Diabetes 49(11), 1939–1945 (2000). 10.2337/diabetes.49.11.1939 [DOI] [PubMed] [Google Scholar]
- Cosentino F., Eto M., De Paolis P., van der Loo B., Bachschmid M., Ullrich V., Kouroedov A., Delli Gatti C., Joch H., Volpe M., and Luscher T. F., Circulation 107(7), 1017–1023 (2003). 10.1161/01.CIR.0000051367.92927.07 [DOI] [PubMed] [Google Scholar]
- Hoidal J. R., Fox R. B., LeMarbe P. A., Perri R., and Repine J. E., Am. Rev. Respir. Dis. 123(1), 85–89 (1981). [DOI] [PubMed] [Google Scholar]
- Schaberg T., Haller H., Rau M., Kaiser D., Fassbender M., and Lode H., Eur. Respir. J. 5(4), 387–393 (1992). [PubMed] [Google Scholar]
- Luanpitpong S., Talbott S. J., Rojanasakul Y., Nimmannit U., Pongrakhananon V., Wang L., and Chanvorachote P., J. Biol. Chem. 285(50), 38832–38840 (2010). 10.1074/jbc.M110.124958 [DOI] [PMC free article] [PubMed] [Google Scholar]
- Yoo S. H., Park Y. S., Kim H. R., Sung S. W., Kim J. H., Shim Y. S., Lee S. D., Choi Y. L., Kim M. K., and Chung D. H., Lung Cancer 42(2), 195–202 (2003). 10.1016/S0169-5002(03)00287-3 [DOI] [PubMed] [Google Scholar]
- Peto R., Darby S., Deo H., Silcocks P., Whitley E., and Doll R., BMJ 321(7257), 323–329 (2000). 10.1136/bmj.321.7257.323 [DOI] [PMC free article] [PubMed] [Google Scholar]
- Cai H., Am. J. Physiol. Cell Physiol. 290(1), C35–36 (2006). 10.1152/ajpcell.00414.2005 [DOI] [PubMed] [Google Scholar]
- Milovanova T., Chatterjee S., Manevich Y., Kotelnikova I., Debolt K., Madesh M., Moore J. S., and Fisher A. B., Am. J. Physiol. Cell Physiol. 290(1), C66–76 (2006). 10.1152/ajpcell.00094.2005 [DOI] [PubMed] [Google Scholar]
- Ghadiali S. N. and Gaver D. P., Respir. Physiol. Neurobiol. 163(1–3), 232–243 (2008). 10.1016/j.resp.2008.04.008 [DOI] [PMC free article] [PubMed] [Google Scholar]
- Aruoma O. I., Toxicol. In Vitro 10(5), 625–629 (1996). 10.1016/S0887-2333(96)00045-8 [DOI] [PubMed] [Google Scholar]
- Aruoma O. I., Spencer J. P., Rossi R., Aeschbach R., Khan A., Mahmood N., Munoz A., Murcia A., Butler J., and Halliwell B., Food Chem. Toxicol. 34(5), 449–456 (1996). 10.1016/0278-6915(96)00004-X [DOI] [PubMed] [Google Scholar]
- Marshall K. A., Reiter R. J., Poeggeler B., Aruoma O. I., and Halliwell B., Free Radic. Biol. Med. 21(3), 307–315 (1996). 10.1016/0891-5849(96)00046-9 [DOI] [PubMed] [Google Scholar]
- Aruoma O. I., Free Radic. Biol. Med. 20(5), 675–705 (1996). 10.1016/0891-5849(95)02110-8 [DOI] [PubMed] [Google Scholar]
- Cheng J. Y., Yen M. H., Kuo C. T., and Young T. H., Biomicrofluidics 2(2), 24105 (2008). 10.1063/1.2952290 [DOI] [PMC free article] [PubMed] [Google Scholar]
- Cheng J. Y., Wei C. W., Hsu K. H., and Young T. H., Sens. Actuators, B 99(1), 186–196 (2004). 10.1016/j.snb.2003.10.022 [DOI] [Google Scholar]
- Cheng J. Y., Yen M. H., Wei C. W., Chuang Y. C., and Young T. H., J. Micromech. Microeng. 15(6), 1147–1156 (2005). 10.1088/0960-1317/15/6/005 [DOI] [Google Scholar]
- Huang C. W., Cheng J. Y., Yen M. H., and Young T. H., Biosens. Bioelectron. 24(12), 3510–3516 (2009). 10.1016/j.bios.2009.05.001 [DOI] [PubMed] [Google Scholar]
- Yang F., Chen Z., Pan J., Li X., Feng J., and Yang H., Biomicrofluidics 5(2), 24115 (2011). 10.1063/1.3605509 [DOI] [PMC free article] [PubMed] [Google Scholar]
- Lu H., Koo L. Y., Wang W. M., Lauffenburger D. A., Griffith L. G., and Jensen K. F., Anal. Chem. 76(18), 5257–5264 (2004). 10.1021/ac049837t [DOI] [PubMed] [Google Scholar]
- Shih J. Y., Yang S. C., Hong T. M., Yuan A., Chen J. J. W., Yu C. J., Chang Y. L., Lee Y. C., Peck K., Wu C. W., and Yang P. C., J. Natl. Cancer I 93(18), 1392–1400 (2001). 10.1093/jnci/93.18.1392 [DOI] [PubMed] [Google Scholar]
- Chen J. J. W., Peck K., Hong T. M., Yang S. C., Sher Y. P., Shih J. Y., Wu R., Cheng J. L., Roffler S. R., Wu C. W., and Yang P. C., Cancer Res. 61(13), 5223–5230 (2001). [PubMed] [Google Scholar]
- Kim M. K., Ahn S. H., and Lee-Kim Y. C., Nutr. Res. 21(6), 797–809 (2001). 10.1016/S0271-5317(01)00300-1 [DOI] [Google Scholar]
- Scott B. C., Butler J., Halliwell B., and Aruoma O. I., Free Radic. Res. Commun. 19(4), 241–253 (1993). 10.3109/10715769309056512 [DOI] [PubMed] [Google Scholar]
- Chin L. K., Yu J. Q., Fu Y., Yu T., Liu A. Q., and Luo K. Q., Lab Chip 11(11), 1856–1863 (2011). 10.1039/c0lc00651c [DOI] [PubMed] [Google Scholar]
- Chiu J. J., Wung B. S., Shyy J. Y., Hsieh H. J., and Wang D. L., Arterioscler. Thromb. Vasc. Biol. 17(12), 3570–3577 (1997). 10.1161/01.ATV.17.12.3570 [DOI] [PubMed] [Google Scholar]
- Pearson P., Lewis S. A., Britton J., Young I. S., and Fogarty A., BioDrugs 20(5), 271–273 (2006). 10.2165/00063030-200620050-00002 [DOI] [PubMed] [Google Scholar]
- Giordo R., Cossu A., Pasciu V., Hoa P. T., Posadino A. M., and Pintus G., Open Biochem. J. 7, 44–53 (2013). 10.2174/1874091X01307010044 [DOI] [PMC free article] [PubMed] [Google Scholar]
- Galati G. and O'Brien P. J., Free Radic. Biol. Med. 37(3), 287–303 (2004). 10.1016/j.freeradbiomed.2004.04.034 [DOI] [PubMed] [Google Scholar]


