

Significance
Bacteriophages are viruses which infect bacteria. Many of these contain double-stranded DNA packed to almost crystalline density and exploit the resulting pressure to trigger DNA ejection into the infected bacterial cell. We show that the ejection kinetics is highly sensitive to the ordering and knotting of the packaged DNA which, in turn, is controlled by DNA self-interactions. The latter favor ordered DNA spools which have a lower effective or topological friction than disordered entangled DNA structures. We also find that torus knots (which can be drawn on the surface of a doughnut) exit the bacteriophage easily; while complex knots or twist knots (which can be formed by linking the ends of a twisted loop) slow down and may stall ejection.
Keywords: DNA knotting, Monte Carlo simulations
Abstract
Bacteriophages initiate infection by releasing their double-stranded DNA into the cytosol of their bacterial host. However, what controls and sets the timescales of DNA ejection? Here we provide evidence from stochastic simulations which shows that the topology and organization of DNA packed inside the capsid plays a key role in determining these properties. Even with similar osmotic pressure pushing out the DNA, we find that spatially ordered DNA spools have a much lower effective friction than disordered entangled states. Such spools are only found when the tendency of nearby DNA strands to align locally is accounted for. This topological or conformational friction also depends on DNA knot type in the packing geometry and slows down or arrests the ejection of twist knots and very complex knots. We also find that the family of (2, 2k+1) torus knots unravel gradually by simplifying their topology in a stepwise fashion. Finally, an analysis of DNA trajectories inside the capsid shows that the knots formed throughout the ejection process mirror those found in gel electrophoresis experiments for viral DNA molecules extracted from the capsids.
Bacteriophages are viruses which infect bacteria. They mostly rely on a remarkably simple infection strategy: after landing on the host cell wall, they release their genetic material into its cytoplasm and hijack the cell protein networks to aid capsid formation and phage replication. For double-stranded DNA (dsDNA)-based phages the infection is initiated by the very large pressure (∼10 atm) (1) to which the DNA is subject inside the capsid, where it is packaged to almost crystalline density by a powerful molecular motor (2). Because of the opposing osmotic pressure from the macromolecules in the bacterial cytosol, the later stages of the DNA ejection process in vivo often rely on the host cellular machinery to finalize the viral genome delivery.
Although existing theories have stressed the importance of salt-induced interactions and electrostatics on the ejection time (3, 4) these usually underestimate the conformational entropy contribution to the packaging or ejection force by exclusively considering one optimized, ordered DNA arrangement. The impact of highly variable DNA-packing conformations on the ejection process is thus not accounted for a priori.
To better understand the impact that DNA spatial arrangement has on its ejection kinetics we consider the ordering effects of local DNA–DNA interactions. We concentrate in particular on the known tendency of contacting dsDNA strands to align at a small angle with respect to each other (regardless of the 3′–5′ orientation in each of the strands). Increasing evidence shows that this cholesteric interaction is not only important for the formation of cholesteric phases in concentrated solutions of DNA (5–8) but can favor the spool-like DNA arrangements of viral DNA (9–11) inside small capsids. Moreover it can control the complexity of DNA self-entanglement in the form of knots (10, 12–14). It is useful here to recall that DNA knots have been already reported for some bacteriophages (12, 15, 16), although it is not yet clear how virus-specific effects (such as the genome anchoring to the capsid) may affect knot type and abundance.
Despite these findings, the impact of DNA cholesteric interaction on the key process of viral DNA packaging and ejection (17–21) remains largely unexplored.
Here we present evidence from stochastic simulations which demonstrates that the ordering effect of this DNA self-interaction plays a pivotal role in determining how quickly the phage DNA can escape from the capsid once ejection initiates.
We find that without cholesteric interactions the packaged DNA is more disordered and globally self-entangled. Consequently, ejection can only proceed by constant, slow global rearrangements of the DNA which favor the progressive release of the exiting strand. Conversely, the DNA is ejected much more quickly when cholesteric interactions are accounted for. In this case, however, a bistable behavior after pore opening is observed: most viral particles immediately start ejecting DNA at very high speed, whereas a small fraction of them remain dormant with the DNA still fully packed. Occasional major pauses during genome delivery are also observed.
This large variability is fully consistent with single-molecule experiments which monitor ejection from a population of phage capsids (22, 23) and can be rationalized in rather simple terms. In the presence of cholesteric interactions, ejections proceed analogously to the unraveling of a neatly coiled anchor line once the anchor is thrown overboard. In most of these cases we find that the genome forms a spool which can be released by pulling out the end at the exit pore, without propagating disturbances to the rest of the chain which reptates inside the capsid. At the same time, when the DNA spool is misaligned with respect to the capsid axis (perpendicular to the exit pore), the genome cannot escape easily, and this accounts for a small population of dormant viruses: DNA release can only be unlocked by infrequent collective spool rearrangements (e.g., a rotation).
Because the difference in DNA pressure with and without cholesteric alignment is negligible, and because we find that the ejection rates are so different, our findings can be restated in the language of the usual ejection theory by saying that the effective DNA friction (proportional to the ejection force divided by the observed ejection rate) strongly depends on the conformation adopted by the genome. The closest approach to this idea of conformational or topological friction comes perhaps from the scaling theory of ref. 24.
DNA–DNA Interactions Strongly Affect Ejection Speed
We begin by reporting results on the ejection dynamics, as measured in terms of the percentage of DNA inside the capsid as a function of time. Fig. 1A shows such a fraction for several individual runs where the DNA cholesteric self-interaction is accounted for. Specifically, the data pertain to simulations of mutant bacteriophage P4 viral particles which accommodate a 5-kg-base pairs (kbp) dsDNA inside a capsid with effective diameter of ∼45 nm (Materials and Methods). The mutant genome is half the length of the wild-type one, yet it has been shown experimentally to display the same overall native entanglement and to be capable of infection and spontaneous ejection (14). The short size of this viral genome makes it ideally suited for the present extensive numerical simulation.
Fig. 1.

(A) Time evolution of the percentage of ejected DNA for  simulations where the DNA cholesteric self-interactions were accounted for. Red curves refer to runs where ejection proceeds to completion, whereas blue lines pertain to runs in which the DNA gets “stuck” and ejection halts midway. (B) Black curves refer to 30 simulations without the cholesteric interaction. The much slower ejection rate is manifest by comparison with the red curves which pertain to an equal number of runs with cholesteric interactions and lag time smaller than 0.5 ms.
By inspecting Fig. 1A, it is readily seen that the actual start of the ejection process (curves departing from the horizontal baseline) does not necessarily follow immediately the opening of the exit pore at the start of the simulation. Indeed, in many instances the DNA stays fully packed for a long time, then ejection abruptly commences. Ejection can occasionally halt midway and stall indefinitely, at least within our simulated timescales, as highlighted by the blue curves in Fig. 1A. By mapping our time step to physical units (Materials and Methods), we find that the average ejection time from pore opening is about 2.0 ms.
To assess how this compares with experiments, we note that for λ-phage DNA, which is about one order of magnitude larger than our mutant P4 genome, ejection is completed in about 1 s in vitro (in a buffer which contains a 10-mM concentration of monovalent counterions).
This ejection time can be scaled down to the size of our DNA by considering two general mechanisms controlling genome release: reptation and biased translocation (24, 25, 26). (The escape time of a packaged polymer of size L from a cavity grows with L to the power 3 for reptation and 1.6 for biased polymer translocation out of the exit pore.) These two limiting cases bound the expected ejection time for our mutant P4 genome between 1 and 35 ms. Our timescales are therefore compatible with the data of in vitro experiments. The same holds for the existence of a lag time, which, based on the data in ref. 22, can be estimated to be of the order of seconds.
It is interesting to compare the results in Fig. 1A with those obtained from simulations where the cholesteric effects are omitted altogether. This comparison is carried out in Fig. 1B. The difference is striking: disregarding the cholesteric interaction for nearby or contacting DNA strands causes two major qualitative changes to the ejection process. First, it leads to approximately a 10-fold slowdown of the DNA escape time. In fact, after 15 ms, only 10% of the ejections have completed. Second, the absence of noticeable lag phases and pauses makes the ejection process statistically more homogeneous, unlike what is seen in experiments.
To understand the origin of such differences, it is useful to examine in detail the evolution of the DNA arrangement in the two cases. To this end, Fig. 2 provides a succession of snapshots for specific ejection trajectories where cholesteric interactions are either omitted or included. Two notable instances of the latter case, with very different lag times but comparable total ejection times, are given in Fig. 2 A and B.
Fig. 2.

Snapshots from three ejection runs. The DNA cholesteric interactions were considered for runs shown in A and B (as well as for generating the initial fully packaged state). The two runs differ for the (A) absence and (B) presence of an initial lag phase. The cholesteric interaction was neglected in C. The initial arrangements of the packaged genome are shown (Left) and followed by snapshots taken at various time intervals and percentage of packaged genome, as indicated. For visual clarity, beads are colored with a rainbow scheme (red → yellow → green → blue), and their rendered size is decreased systematically going from the red to the blue end.
The ejection process shown in Fig. 2A occurs with neither initial lag phase nor intermediate pauses and completes in about 7 ms (the complete ejection dynamics is shown in Movie S1). As for most spools shaped by the cholesteric interaction, the initial toroidal structure unfolds turn by turn without much modifying the rest of the packaged chain. Indeed, the unconstrained DNA end inside the capsid is not dragged toward the pore (except at the very last stages of the ejection process) and can wander around in regions of the capsid which have become free. Therefore, the ejection process is as fast as it can be; its average duration is a few milliseconds, which is remarkably close to the Rouse relaxation time of the (unconstrained) P4 DNA we considered.
The ejection process shown in Fig. 2B, instead, starts after an appreciable lag time of about 2.5 ms, which is about equal to the mean ejection time. Its analysis can therefore shed light on the physical origin of the lag time. The DNA spool axis is initially oriented perpendicular to the capsid axis (i.e., the axis joining the opening and the center of the capsid), and furthermore, the exiting strand is topologically trapped between spool loops that are far away in sequence. The ejection of this initially stuck configuration is seen to proceed only after the chain dynamics inside the capsid has freed the jammed strand and favorably oriented the spool axis. Once this happens, the ejection rate is very high and completes in about 2 ms, as in the more common case in which the spool is initially arranged more favorably for ejection. The sudden ejection unlocking following the spontaneous global DNA rearrangement is vividly shown in Movie S2.
Fig. 2C finally shows how the DNA unravels and ejects in the absence of cholesteric interactions. The initial configuration is much more disordered, and isotropic, than for Fig. 2 A and B. Consequently, there is no optimal orientation of the packaged DNA relative to the capsid to favor its escape. Consistent with this fact, the lag time is now negligible. However, ejection takes much longer: only 50% of the genome is ejected after 11 ms, because there are several points of local entanglement which lead to frequent slowdown or pauses in ejection: these can only be overcome through continuous global readjustments of the DNA inside the capsid (Movie S3).
Unraveling Dynamics of DNA Knots
The cholesteric interaction considered in this work, although underappreciated in theoretical/computational DNA packaging studies, is known to deeply affect the conformational organization of the phage genome at various scales. Indeed, at the local level it promotes the collinearity of contacting strands, whereas globally it affects the presence and complexity of physical knots in the packaged DNA. (Unlike mathematically knotted curves, which are circular, the encapsidated DNA is linear. However, it is now customary to extend the notion of knottedness to open chains too whenever they become mathematically knotted after a suitable closing of the two ends (Materials and Methods). In these cases, one speaks of “physical” knots.) For instance, it generally favors the occurrence of torus knots over twist knots (10).
Torus knots are those which can be drawn as a closed curve on a torus and comprise, in order of complexity, the trefoil (31), 51, and 71 knots, etc. Twist knots are observed far less frequently within the phage than in solution of unconstrained DNA, where, for instance, the figure-of-eight and the 52 knots are often observed (27). An intuitive reason which has been proposed for the abundance of twist knots in solution is that their unknotting number (the smallest number of crossings that have to be reversed to render it topologically equivalent to the unknot) is always 1. Therefore, these knots may be thought of as simpler to tie, and hence entropically favored, than others. Experimentally, almost all knots produced by bacteriophage T4 topoisomerase acting on unknotted negatively supercoiled plasmid substrate in vitro are twist knots (28).
It is clear from Figs. 1 and 2 that the different DNA organization observed with and without cholesteric interaction has a dramatic effect on the efficiency and speed of DNA ejection. This fact may come as a surprise from the topological point of view, because the torus knots which can easily exit the capsid (Fig. 2A), have on average a much higher unknotting number than any twist knot. For instance, the trefoil, 51, 71, and 91 knots have unknotting numbers equal to 1, 2, 3, and 4, respectively, as opposed to unknotting number 1 for all twist knots. Therefore, untying such knots nominally requires many more elementary (strand-crossing) operations than, say, untying a figure-of-eight knot.
It is therefore of interest to explore how the unraveling of these torus knots can be so highly efficient in practice. Furthermore, one may ask how the DNA knots inside the capsid simplify over time as the ejection proceeds. Two possible scenarios can be envisaged. One possibility is that the knot is drawn to the exit pore and forms a long-lived topological blockade (29, 30). In this situation, the entanglement problem can be solved only at the very end, thanks to the reptation/sliding of the free end (the one inside the capsid) along the knot contour. The second possibility is that knots are progressively untied as DNA comes out. However, which of these two possible routes is most likely followed by viral DNA ejection?
To address this issue, we analyzed the abundance and type of DNA knots as the genome is ejected and next compared the cases where cholesteric alignment is included or omitted. The results are shown in Fig. 3 and illustrate that knot complexity drops progressively as ejection proceeds.
Fig. 3.
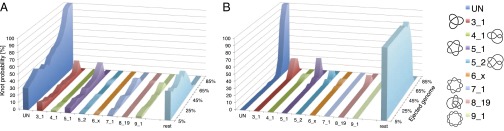
Percentage of occurrence of various types of physical knots as a function of the amount of ejected DNA when cholesteric interactions are (A) included or (B) omitted. Only runs which eventually fully eject their DNA are considered. For simplicity, knots are sketched with closed–curved diagrams [produced with the Knotplot software (www.knotplot.com) developed by R.G. Scharein] and are labeled with standard nomenclature with the proviso that UN refers to the unknot, and  includes the 61, 62, and 63 knots. Diagrams of torus and twist knots are shown on the left and on the right, respectively.
This is particularly evident for the simulations with cholesteric interaction. In fact, Fig. 3A shows the steady decrease of complex knots population in favor of simpler topologies. It is therefore clear that the knot topology changes continuously: Knots simplify gradually, rather than abruptly, during ejection. For instance, the probability of finding an unknot is only about 25% at the start of ejection, rises to 50% when half of the DNA is out, and is about 80% when 80% of the genome has been released. Strikingly, the knot spectrum which is recorded during the release of the genome, although highly variable, is biased in favor of torus knots at all times.
Compared with the above case, unknotting during ejection is much more cumbersome in the absence of the cholesteric interactions. Indeed, it is seen in Fig. 3B that the fraction of unknotted molecules remains negligible until  of the genome has ejected (although in this case as well the ejection is accompanied by a progressive reduction of the number of crossings, nc). At the latest ejection stages, when simple knot types are sizeably populated, one observes a high incidence of twist knots, such as figure-of-eight and 52 knots, which are absent in the electrophoretic gels in the experiments for phage knots.
It is also instructive to follow the knot-type evolution for specific ejection simulations. This analysis can elucidate the mechanisms through which a DNA knot can progressively simplify itself. It can also assess whether topological entanglement can, by itself, stall ejection.
A typical dynamics of DNA self-untying is given in Fig. 4A and corresponds to the ejection run illustrated in Fig. 2A (Movie S1). It can be seen that the number of crossing, nc, decreases gradually during ejection (starting from  ). When the ejected fraction is ∼60%, the chain is tied up as a 91 torus knot. This simplifies in a stepwise fashion to a 71 knot, a 51 knot, a trefoil, and finally the unknot. This sequence of torus knots has progressively smaller unknotting number, showing that in our simulations the crossings in the minimal projections are undone one by one during ejection. This unraveling dynamics is followed in most of the cases where DNA is fully released and accounts for the persistent bias in favor of torus knots in the shifting spectrum in Fig. 3. In our simulations, the crossings are eliminated by reducing the contour length of the packaged DNA, as the free end inside the capsid is entropically pulled out, so that the knot never acts as a tight blockage jamming the neighborhood of the pore.
Fig. 4.

(A) The time evolution of the number of crossings,  , or knot type for the ejection run illustrated in Fig. 2A.
  was calculated on the minimal projection after simplifying as much as possible the chain geometry at fixed topology (Materials and Methods) and therefore is an upper bound to the true, minimal crossing number. The progressive disentanglement takes the chain through a series of torus knots with decreasing complexity. (B) The effective mobility measured during the ejection process as well as the enthalpic ejection force. (C and D) Analogous quantities for a configuration which gets stuck during ejection. Both simulations include cholesteric interactions.
As shown in Fig. 4B, the internal enthalpic force driving ejection has an average magnitude of about 10 pN and an overall decreasing trend. Interestingly, the buildup and decrease of internal force, arguably related to the onset and solution of chain jams, is paralleled by a modulation of the chain mobility. Both the magnitude of the average internal force and those of the chain mobility are comparable with those observed experimentally in vitro for capsids with residual filling fraction comparable with the one considered here (31).
As illustrated in Fig. 3, the free-end precessive dynamics provides a very effective means of topological simplification. However, because of its intrinsic stochastic character it can lead to the formation of complex knots as well. This is illustrated in Fig. 4C which profiles one trajectory in which ejection stops midway. Here, after a minor lag phase, DNA starts to eject, and, intriguingly, one of the rare twist knots (52) forms. This knot has an unknotting number equal to just 1: it could thus be untied by a single suitably chosen strand-crossing operation. The stochastic chain dynamics, however, does not take this simplification route and ends up complicating the topology to the point that ejection cannot proceed beyond 50%. The knot jamming the configuration happens to be a complicated torus knot,  , which has unknotting number equal to 4 (and is also one of the few cases of torus knots which are also pretzel knots).
Although the simpler torus knots typically populated during ejection (Fig. 4A) can be drawn on a torus as a closed curve embracing twice the small torus circumference, the  knot requires at least three such turns: its unraveling is then more problematic, hence ejection halts. We find that in all cases in which the ejection stops, similarly complicated knots form, which then act as a topological plug to block the DNA release. We note, however, that such complicated cases are very much the exception rather than the rule in our results. In fact, less than 5% of the knots get stuck halfway once ejection has started, consistently with the small incidence of stalled ejections seen experimentally (22, 32). The nontrivial chain entanglement associated with these configurations is further illustrated by the relatively high internal force that eventually builds up inside the capsid (Fig. 4D).
Further major differences in the ejection kinetics with and without cholesteric self-interactions emerge upon varying the ionic strength of the solution. This was established by repeating 20 ejection simulations for either case after lowering the Debye electrostatic screening length from the default value,  , to
, to  . The slow, but steady, ejection of the disordered conformations packed without cholesteric interactions was virtually unaffected by the reduction of screening length. Instead, ejections with cholesteric interactions were slowed down significantly. In particular, after 0.5 ms, the number of runs still in the lag phase is 8 for
  and only 3 for
  . Overall the typical ejection rate is decreased by 35% upon reducing
  (Fig. S1). Analysis of the trajectories shows that the slowing down occurs because the reduced self-repulsion of DNA makes it more prone to self-entangle. This slowing down does not occur for configurations that are already significantly disordered and entangled due to the lack of cholesteric interactions. This is well consistent with the recent experiments on the histone His 1 archaeal virus for which both a significant slowdown in kinetics and higher incidence of stalled ejections were observed upon increasing the solution ionic strength (32).
Conclusions
We have presented computer simulations of DNA ejection from a mutant P4 phage whose genome length is half the wild-type one. The simulations, which account for standard DNA self-interaction terms (bending rigidity, electrostatics, and steric repulsion) are geared toward clarifying the key role that cholesteric interactions have on the DNA ejection process.
When the cholesteric interactions are included, DNA ejection often occurs after a long lag time, comparable to the time needed to complete ejection once started. This is because the DNA spool inside the capsids needs to rotate so that the normal to the spool plane is in the direction of the capsid opening before ejection can proceed. After the spool reorientation, ejection proceeds rapidly.
In contrast, when cholesteric interactions are omitted, the packaged configurations are more disordered, entangled, and lack a spool organization. As a result, there is no appreciable lag phase, but the genome release is dramatically slowed down by its continuous global readjustments required to solve the entanglement.
We also find that with cholesteric interactions the known predominance of torus over twist knots observed in equilibrium (10, 13) persists at all ejection stages. Interestingly, simple torus knots unravel by decreasing their unknotting number one by one as ejection proceeds. Occasionally, for particularly entangled configurations, ejection halts midway: the reason for this arrest is once more topological, as the corresponding knots are either twist knots or very complicated ones.
We hope that our results will prompt further experimental and numerical verification of the validity of our concept of topological friction, which inside a capsid is much larger for twist knots and for disordered, highly entangled DNA conformations. This friction leads to a large slowdown in DNA ejection, even in cases for which the thermodynamic force leading to genome release is quantitatively similar (our cases with and without chiral bias).
Materials and Methods
The stretch of dsDNA corresponding to the half-genome of P4 is modeled as an open chain of  spherical beads of diameter
  nm. Following ref. 10, the coarse-grained potential includes the following contributions.
First, chain connectivity is treated within the finitely extensible nonlinear elastic model (33) and by further requiring that the bond length is never either smaller than 0.7 σ or larger than 1.3 σ. Second, the bending rigidity of DNA is modeled via a Kratky–Porod potential, with parameters tuned to reproduce the known persistence length,  , of unconstrained DNA. There are then three contributions to the chain self-interaction: steric repulsion and screened electrostatic and cholesteric interactions (5). Steric repulsion is modeled using a truncated-and-shifted Lennard–Jones potential VLJ (also known as Weeks–Chandler–Anderson potential)
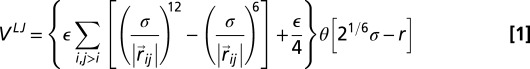 |
where  (kB is the Boltzmann constant and T is temperature), θ is the Heaviside function, and
  (
( denotes the position of the ith bead). Screened electrostatic interactions are accounted for via a Debye–Huckel potential, with
  , the Bjerrum length, equal to 0.7 nm; a, the distance between two elementary charges, equal to about 1 nm (this takes into account some screening of the bare DNA charges); and
  , the Debye length, equal to 0.9 nm [corresponding to 0.1 M solution of monovalent counterions (Vc) such as NaCl]. Finally, the cholesteric interaction potential is
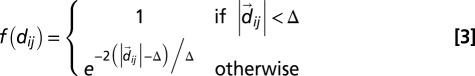 |
where  is the distance between the centers of mass of the two bonds connecting beads i to
  , and j to
  , whereas Δ is the spatial range of the interaction. The apolar twist angle, α, formed by two bonds,
  (connecting beads i and i + 1) and
  (connecting beads j and j + 1), is defined by
where the preferential twist angle,  , can be either positive or negative, allowing the potential in Eq. 2 to locally select either left-handed or right-handed twist. Moreover, Eq. 4 implies that the colesteric interaction is apolar (i.e., insensitive to the reversal
  ), as required by the symmetry of the DNA double helix. The above cholesteric potential was introduced and used in ref. 10, where it was shown to lead to a knot spectrum consistent with that observed experimentally in P4 experiments. (A similar chiral bias was found by analyzing helix–helix contacts in proteins (34).) As in ref. 10, we set
  (35) and the strength of the cholesteric interaction
  ,
,  (10, 36), whereas
  . Finally, because the packaged linear DNA is not expected to accumulate torsional stress (37) unlike circular one (38), we do not consider the DNA torsional rigidity.
The simulations were performed using a stochastic dynamics scheme, known as the “kink–jump” dynamics (39). This algorithm consists of attempting at each step a trial move by locally deforming the polymer. This move is then accepted or rejected according to the well-known Metropolis algorithm.
To perform our ejection simulations, we started from a packaged genome, obtained through a packaging run, where one end is anchored and the other grows and is free (this situation applies to some, but not all, phages), as explained previously (10). The capsid was simulated as a sphere with diameter equal to 45 nm. To initiate ejection, we create a “hole” (radius 5 nm) on the surface of the capsid from which DNA can get out. To model the presence of a collar in the phage, beads close to the opening are subjected to a harmonic potential toward the center of the opening. DNA ejection from the capsid is therefore a passive process, driven by, mainly, entropic forces. We finally note that the kink–jump dynamics can be shown to be equivalent to Brownian dynamics (40), hence hydrodynamic interactions are neglected. This is a common assumption in the field; including these would require more sophisticated integrators and render our work unfeasible currently. Previous literature, however, suggests that hydrodynamics speeds up the dynamics but does not change the trend observed in packaging and ejection simulations qualitatively. The ejection timescales can be estimated by matching the time required for one bead of the model DNA to diffuse over a distance comparable to its size (in physical time and Monte Carlo sweeps). This maps a Monte Carlo sweep to about 0.1 ns and leads to the ejection times reported in Fig. 1.
Finally, the knotted state of the packaged linear DNA is established by computing various invariants after suitably bridging the ends of the chain portion that is inside the capsid. This is done by prolonging the two ends radially out of the capsid and closing them “at infinity.” The knot identification with topological invariants [calculated with the Knotscape algorithm (www.math.utk.edu/~morwen/knotscape.html) created by J. Hoste and M. Thislethwaite] was done after simplifying as much as possible the chain geometry at fixed topology (41, 42). The geometry simplification algorithms were used for the calculation of the number of crossings,  , as well.
Supplementary Material
Acknowledgments
We thank A. Stasiak for important discussions. We acknowledge financial support from the Italian Ministry of Education (Grant PRIN 2010HXAW77), and from the Engineering and Physical Sciences Research Council (Grant EP/I034661/1). This work has made use of the resources provided by the Edinburgh Compute and Data Facility (www.ecdf.ed.ac.uk).
Footnotes
The authors declare no conflict of interest.
This article is a PNAS Direct Submission.
This article contains supporting information online at www.pnas.org/lookup/suppl/doi:10.1073/pnas.1306601110/-/DCSupplemental.
References
- 1.Gelbart WM, Knobler CM. Virology. Pressurized viruses. Science. 2009;323(5922):1682–1683. doi: 10.1126/science.1170645. [DOI] [PubMed] [Google Scholar]
- 2.Smith DE, et al. The bacteriophage straight phi29 portal motor can package DNA against a large internal force. Nature. 2001;413(6857):748–752. doi: 10.1038/35099581. [DOI] [PubMed] [Google Scholar]
- 3.Inamdar MM, Gelbart WM, Phillips R. Dynamics of DNA ejection from bacteriophage. Biophys J. 2006;91(2):411–420. doi: 10.1529/biophysj.105.070532. [DOI] [PMC free article] [PubMed] [Google Scholar]
- 4.Fuller DN, Raymer DM, Kottadiel VI, Rao VB, Smith DE. Single phage T4 DNA packaging motors exhibit large force generation, high velocity, and dynamic variability. Proc Natl Acad Sci USA. 2007;104(43):16868–16873. doi: 10.1073/pnas.0704008104. [DOI] [PMC free article] [PubMed] [Google Scholar]
- 5.Strey HH, Podgornik R, Rau DC, Parsegian VA. DNA–DNA interactions. Curr Opin Struct Biol. 1998;8(3):309–313. doi: 10.1016/s0959-440x(98)80063-8. [DOI] [PubMed] [Google Scholar]
- 6.Sartori Blanc N, Senn A, Leforestier A, Livolant F, Dubochet J. DNA in human and stallion spermatozoa forms local hexagonal packing with twist and many defects. J Struct Biol. 2001;134(1):76–81. doi: 10.1006/jsbi.2001.4365. [DOI] [PubMed] [Google Scholar]
- 7.Zanchetta G, et al. Right-handed double-helix ultrashort DNA yields chiral nematic phases with both right- and left-handed director twist. Proc Natl Acad Sci USA. 2010;107(41):17497–17502. doi: 10.1073/pnas.1011199107. [DOI] [PMC free article] [PubMed] [Google Scholar]
- 8.Bellini T, et al. Liquid crystal self-assembly of random-sequence DNA oligomers. Proc Natl Acad Sci USA. 2012;109(4):1110–1115. doi: 10.1073/pnas.1117463109. [DOI] [PMC free article] [PubMed] [Google Scholar]
- 9.Leforestier A, Livolant F. Structure of toroidal DNA collapsed inside the phage capsid. Proc Natl Acad Sci USA. 2009;106(23):9157–9162. doi: 10.1073/pnas.0901240106. [DOI] [PMC free article] [PubMed] [Google Scholar]
- 10.Marenduzzo D, et al. DNA-DNA interactions in bacteriophage capsids are responsible for the observed DNA knotting. Proc Natl Acad Sci USA. 2009;106(52):22269–22274. doi: 10.1073/pnas.0907524106. [DOI] [PMC free article] [PubMed] [Google Scholar]
- 11.Lander GC, et al. DNA bending-induced phase transition of encapsidated genome in phage λ. Nucleic Acids Res. 2013;41(8):4518–4524. doi: 10.1093/nar/gkt137. [DOI] [PMC free article] [PubMed] [Google Scholar]
- 12.Liu LF, Perkocha L, Calendar R, Wang JC. Knotted DNA from bacteriophage capsids. Proc Natl Acad Sci USA. 1981;78(9):5498–5502. doi: 10.1073/pnas.78.9.5498. [DOI] [PMC free article] [PubMed] [Google Scholar]
- 13.Arsuaga J, et al. DNA knots reveal a chiral organization of DNA in phage capsids. Proc Natl Acad Sci USA. 2005;102(26):9165–9169. doi: 10.1073/pnas.0409323102. [DOI] [PMC free article] [PubMed] [Google Scholar]
- 14.Trigueros S, Roca J. Production of highly knotted DNA by means of cosmid circularization inside phage capsids. BMC Biotechnol. 2007;7:94. doi: 10.1186/1472-6750-7-94. [DOI] [PMC free article] [PubMed] [Google Scholar]
- 15.Menissier J, Laquel P, Lebeurier G, Hirth L. A DNA polymerase activity is associated with Cauliflower Mosaic Virus. Nucleic Acids Res. 1984;12(23):8769–8778. doi: 10.1093/nar/12.23.8769. [DOI] [PMC free article] [PubMed] [Google Scholar]
- 16.Arsuaga J, Vázquez M, Trigueros S, Sumners D, Roca J. Knotting probability of DNA molecules confined in restricted volumes: DNA knotting in phage capsids. Proc Natl Acad Sci USA. 2002;99(8):5373–5377. doi: 10.1073/pnas.032095099. [DOI] [PMC free article] [PubMed] [Google Scholar]
- 17.Kindt J, Tzlil S, Ben-Shaul A, Gelbart WM. DNA packaging and ejection forces in bacteriophage. Proc Natl Acad Sci USA. 2001;98(24):13671–13674. doi: 10.1073/pnas.241486298. [DOI] [PMC free article] [PubMed] [Google Scholar]
- 18.Marenduzzo D, Micheletti C. Thermodynamics of DNA packaging inside a viral capsid: the role of DNA intrinsic thickness. J Mol Biol. 2003;330(3):485–492. doi: 10.1016/s0022-2836(03)00584-9. [DOI] [PubMed] [Google Scholar]
- 19.Purohit PK, et al. Forces during bacteriophage DNA packaging and ejection. Biophys J. 2005;88(2):851–866. doi: 10.1529/biophysj.104.047134. [DOI] [PMC free article] [PubMed] [Google Scholar]
- 20.Forrey C, Muthukumar M. Langevin dynamics simulations of genome packing in bacteriophage. Biophys J. 2006;91(1):25–41. doi: 10.1529/biophysj.105.073429. [DOI] [PMC free article] [PubMed] [Google Scholar]
- 21.Petrov AS, Harvey SC. Packaging double-helical DNA into viral capsids: Structures, forces, and energetics. Biophys J. 2008;95(2):497–502. doi: 10.1529/biophysj.108.131797. [DOI] [PMC free article] [PubMed] [Google Scholar]
- 22.Grayson P, Han L, Winther T, Phillips R. Real-time observations of single bacteriophage lambda DNA ejections in vitro. Proc Natl Acad Sci USA. 2007;104(37):14652–14657. doi: 10.1073/pnas.0703274104. [DOI] [PMC free article] [PubMed] [Google Scholar]
- 23.Chiaruttini N, et al. Is the in vitro ejection of bacteriophage DNA quasistatic? A bulk to single virus study. Biophys J. 2010;99(2):447–455. doi: 10.1016/j.bpj.2010.04.048. [DOI] [PMC free article] [PubMed] [Google Scholar]
- 24.Gabashvili IS, Grosberg AYu Dynamics of double stranded DNA reptation from bacteriophage. J Biomol Struct Dyn. 1992;9(5):911–920. doi: 10.1080/07391102.1992.10507966. [DOI] [PubMed] [Google Scholar]
- 25.Cacciuto A, Luijten E. Confinement-driven translocation of a flexible polymer. Phys Rev Lett. 2006;96(23):238104. doi: 10.1103/PhysRevLett.96.238104. [DOI] [PubMed] [Google Scholar]
- 26.Milchev A, Binder K. Kinetics of polymer ejection from capsid confinement: Scaling considerations and computer experiment. Int J Mod Phys C. 2012;23(8):1240005. [Google Scholar]
- 27.Rybenkov VV, Cozzarelli NR, Vologodskii AV. Probability of DNA knotting and the effective diameter of the DNA double helix. Proc Natl Acad Sci USA. 1993;90(11):5307–5311. doi: 10.1073/pnas.90.11.5307. [DOI] [PMC free article] [PubMed] [Google Scholar]
- 28.Wasserman SA, Cozzarelli NR. Supercoiled DNA-directed knotting by T4 topoisomerase. J Biol Chem. 1991;266(30):20567–20573. [PubMed] [Google Scholar]
- 29.Matthews R, Louis AA, Yeomans JM. Knot-controlled ejection of a polymer from a virus capsid. Phys Rev Lett. 2009;102(8):088101. doi: 10.1103/PhysRevLett.102.088101. [DOI] [PubMed] [Google Scholar]
- 30.Rosa A, Di Ventra M, Micheletti C. Topological jamming of spontaneously knotted polyelectrolyte chains driven through a nanopore. Phys Rev Lett. 2012;109(11):118301. doi: 10.1103/PhysRevLett.109.118301. [DOI] [PubMed] [Google Scholar]
- 31.Grayson P, Molineux IJ. Is phage DNA ‘injected’ into cells—biologists and physicists can agree. Curr Opin Microbiol. 2007;10(4):401–409. doi: 10.1016/j.mib.2007.04.004. [DOI] [PMC free article] [PubMed] [Google Scholar]
- 32.Hanhijärvi KJ, Ziedaite G, Pietilä MK, Hæggström E, Bamford DH. DNA ejection from an archaeal virus—a single-molecule approach. Biophys J. 2013;104(10):2264–2272. doi: 10.1016/j.bpj.2013.03.061. [DOI] [PMC free article] [PubMed] [Google Scholar]
- 33.Kremer K, Grest G. Dynamics of entangled linear polymer melts: A molecular-dynamics simulation. J Chem Phys. 1990;92:5057–5086. [Google Scholar]
- 34.Trovato A, Seno F. A new perspective on analysis of helix-helix packing preferences in globular proteins. Proteins. 2004;55(4):1014–1022. doi: 10.1002/prot.20083. [DOI] [PubMed] [Google Scholar]
- 35.Tombolato F, Ferrarini A. From the double-stranded helix to the chiral nematic phase of B-DNA: A molecular model. J Chem Phys. 2005;122(5):054908. doi: 10.1063/1.1839859. [DOI] [PubMed] [Google Scholar]
- 36.Kornyshev AA, Leikin S, Malinin SV. Chiral electrostatic interaction and cholesteric liquid crystals of DNA. Eur Phys J E. 2002;7(1):83–93. [Google Scholar]
- 37.Rollins GC, Petrov AS, Harvey SC. The role of DNA twist in the packaging of viral genomes. Biophys J. 2008;94(5):L38–L40. doi: 10.1529/biophysj.107.126698. [DOI] [PMC free article] [PubMed] [Google Scholar]
- 38.Witz G, Dietler G, Stasiak A. Tightening of DNA knots by supercoiling facilitates their unknotting by type II DNA topoisomerases. Proc Natl Acad Sci USA. 2011;108(9):3608–3611. doi: 10.1073/pnas.1016150108. [DOI] [PMC free article] [PubMed] [Google Scholar]
- 39.Marenduzzo D, Orlandini E. Dynamics of fibers growing inside soft vesicles. Europhys Lett. 2007;80(4):48004. [Google Scholar]
- 40.Tiana G, Sutto L, Broglia R. Use of the metropolis algorithm to simulate the dynamics of protein chains. Physica A. 2007;380:241–249. [Google Scholar]
- 41.Koniaris K, Muthukumar M. Knottedness in ring polymers. Phys Rev Lett. 1991;66(17):2211–2214. doi: 10.1103/PhysRevLett.66.2211. [DOI] [PubMed] [Google Scholar]
- 42.Micheletti C, Marenduzzo D, Orlandini E, Sumners DW. Simulations of knotting in confined circular DNA. Biophys J. 2008;95(8):3591–3599. doi: 10.1529/biophysj.108.137653. [DOI] [PMC free article] [PubMed] [Google Scholar]
Associated Data
This section collects any data citations, data availability statements, or supplementary materials included in this article.