

Abstract
Nanospray desorption electrospray ionization (nano-DESI) combined with tandem mass spectrometry (MS/MS), high-resolution mass analysis of the fragment ions (m/Δ=17,500 at m/z 200), and rapid spectral acquisition enabled simultaneous imaging and identification of a large number of metabolites and lipids from 92 selected m/z windows (± 1 Da) with a spatial resolution of better than 150 μm. Mouse uterine sections of implantation sites on day 6 of pregnancy were analyzed in the ambient environment without any sample pre-treatment. MS/MS imaging was performed by scanning the sample under the nano-DESI probe at 10 μm/s while acquiring higher-energy collision-induced dissociation (HCD) spectra for a targeted inclusion list of 92 m/z values at a rate of ~6.3 spectra/s. Molecular ions and their corresponding fragments, separated using high-resolution mass analysis, were assigned based on accurate mass measurement. Using this approach, we were able to identify and image both abundant and low-abundance isobaric and isomeric species within each m/z window. MS/MS analysis enabled efficient separation and identification of isomeric and isobaric phospholipids that are difficult to separate in a full-scan mode. Furthermore, we identified several metabolites associated with early pregnancy and obtained the first 2D images of these molecules.
Keywords: imaging mass spectrometry, nanospray desorption electrospray ionization (nano-DESI), mouse embryo, tandem mass spectrometry, MS/MS, Orbitrap
Introduction
Mass spectrometry imaging (MSI)1-12 is a powerful technique that enables label-free 2D and 3D mapping of molecules in biological samples. Many ionization techniques have been used in conjunction with MSI. These include matrix assisted laser desorption ionization (MALDI),4-5, 13 secondary ion mass spectrometry (SIMS),1, 3, 7 desorption electrospray ionization (DESI),6, 14-15 laser ablation electrospray ionization (LAESI)16-17, nanostructure-initiator mass spectrometry (NIMS)18, inlet ionization19-20, nanospray desorption electrospray ionization (nano-DESI)21-22, and other techniques. Advantages and limitations of these techniques for imaging of drugs, metabolites, and lipids have been discussed in several recent reviews.3, 8-10, 23-25
MSI has been used for detecting proteins, lipids, drugs, and metabolites in tissue sections. Although MALDI MSI coupled with ion mobility separation has been demonstrated26-27, most MSI experiments do not involve any separation prior to detection of complex mixtures extracted from tissue sections. Because of the large number of peaks in MSI spectra, identification of molecules observed in these experiments is often challenging. High-resolution mass analysis combined with MSI experiments separates isobaric compounds within the reach of the experimental mass resolution but cannot separate isomers.21, 28-40 Molecular identification in MSI relies on the accurate mass measurement and MS/MS, which can be performed directly on the tissue in the imaging mode. The first MS/MS imaging experiments by Caprioli and co-workers used selected reaction monitoring (SRM) combined with MALDI for localization and unambiguous identification of drugs in tissues41-42 and since then this protocol has been used by many research groups.10, 23 More recently, DESI SRM imaging has been used for spatial profiling of clozapine in kidney and testis tissue sections.43 Both SRM and multiple reaction monitoring (MRM) have proven very successful for targeted analysis of dosed tissues.43-49
Broadband MS/MS acquisition opens up opportunities for untargeted identification of molecules in MSI experiments. Using this approach, Burnum et al. were able to distinguish spatial distributions of isomeric phosphoethanolamines (PE) in mouse uterine implantation sites demonstrating the power of MS/MS imaging for simultaneous spatial localization and identification of molecules.50 Guenther et al. demonstrated MALDI MS/MS imaging of two neuropeptides in a mouse pituitary gland with a spatial resolution of 10 μm.36 However, most MALDI MS/MS imaging experiments were performed with a spatial resolution of ~500 μm.23 Multiplexing approaches have been developed to improve the throughput of MALDI MS/MS imaging experiments,33, 51 but they are still typically limited to less than 10 compounds.11
In this study, we demonstrate for the first time MS/MS imaging using nano-DESI coupled with high-resolution mass spectrometry. Nano-DESI52 is an ambient ionization technique that relies on localized desorption of analyte molecules into a liquid bridge formed between two fused silica capillaries, followed by controlled transfer of the extracted analyte molecules to the mass spectrometer inlet and nanospray ionization. Nano-DESI has been used for sensitive analysis of complex environmental53-57 and biological samples.21-22, 58-59 Furthermore, nano-DESI has been used for imaging of tissue sections, without special sample pre-treatment, and with a spatial resolution down to 12 μm.21-22 In this study we report the coupling of an automated nano-DESI source37 with a high-resolution Q-Exactive instrument which enabled MS/MS imaging of a large number of individual compounds from a targeted list of 92 m/z values, with a spatial resolution of ~150 μm and mass resolution of 17,500 (m/Δm at m/z 200), in a single experiment. Accurate mass measurement enabled unambiguous identification of the observed fragment ions. Several examples of MS/MS imaging data sets obtained for lipids and metabolites will be presented demonstrating simultaneous MS/MS imaging of high- and low-abundance metabolites, isobaric and isomeric species. This new capability opens up new exciting opportunities for simultaneous imaging and identification of biological molecules in tissue sections using MSI.
Experimental section
Tissue collection and handling
Adult CD-1 mice were purchased from Charles River Laboratory (Raleigh, NC). Females were mated with fertile males of the same strain to induce pregnancy (day 1 of pregnancy = vaginal plug). All mice used in this investigation were housed in the Cincinnati Children’s Hospital Medical Center Animal Care Facility according to National Institutes of Health and institutional guidelines for the use of laboratory animals. All protocols of the present study were reviewed and approved by Cincinnati Children’s Hospital Research Foundation Institutional Animal Care and Use Committee.
Implantation sites on day 6 of pregnancy were visualized by the blue dye method as previously described.60 Implantation sites were dissected from uteri and snap frozen. Successive sections (12 μm), ranging from 25-30 section per implantation site, were mounted onto glass slides precoated with poly-L-lysine solution (Sigma). Slides were stored at −80°C. The sections were equilibrated to room temperature prior to analysis.
Nano-DESI MS/MS imaging
A customized nano-DESI imaging source developed at the Pacific Northwest National Laboratory (PNNL) was mounted onto a Q-Exactive Orbitrap mass spectrometer (Thermo Electron, Bremen, Germany). Figure 1a shows a photograph of the source installed on the Q-Exactive instrument. The nano-DESI probe was assembled using a specially designed capillary holder shown in Figure 1b, in which two fused silica capillaries of 50 μm ID and 150 μm OD each (Polymicro Technologies, LLC, Phoenix, AZ) were sandwiched between two plates equipped with precisely machined grooves. The capillaries were positioned in the holder under a microscope and fixed by tightening set screws connecting the two plates. A custom-made nano-DESI sample holder attached to a motorized XYZ stage (Newport Corp., Irvine, CA) was controlled by custom-designed LabVIEW software as described in our previous study.37 Images were acquired in lines by a continuous motion of the stage in the x-direction at 10 μm/s and with spacing between the individual lines of 154 μm in the y-direction. For each MS/MS imaging experiment 27 lines were acquired over an area of 4.6 mm × 4.1 mm with an acquisition time of 7.67 min/line and a total analysis time of ~3.5 hours.
Figure 1.

A photograph of the nano-DESI imaging source attached to a Q-Exactive instrument at Thermo Fischer, San Jose; red arrow points to the nano-DESI probe; b) a photograph of the nano-DESI probe holding the primary capillary (1) and the nanospray capillary (2); c) optical image of one of the tissue sections analyzed in this study (scale bar = 1 mm). M = mesometrial pole; AM = antimesometrial pole; Em = embryo; le = luminal epithelium; myo = myometrium muscle layers; uterine stroma is comprised of the primary decidual zone (PDZ) and the secondary decidual zone (SDZ). Light blue trace of the optical image will be used for comparison with ion images.
Positive mode higher-energy collision-induced dissociation (HCD) spectra were acquired with a mass resolution of 17,500 (m/Δm at m/z 200), mass isolation window of 2 amu, and an average acquisition rate of ~6.3 spectra/s. The automated gain control target was set to 2×10⁵ ions, maximum ion injection time (IT) was 100 ms. Each MS/MS spectrum was acquired by ramping the nominal collision energy (NCE) in the range of 24-36 V. This parameter defines the extent of fragmentation observed in the spectrum. In this study, the NCE was optimized for selected peaks across the mass range to obtain efficient averaging over both higher- and lower-energy dissociation pathways in the MS/MS spectrum. A targeted inclusion list of 92 precursor m/z values shown in Table S1 of the supporting information was repeatedly subjected to HCD while the sample was moved under the nano-DESI probe. The inclusion list was composed of abundant metabolites and lipids, in the range of m/z 130-950, observed in a full-scan nano-DESI imaging experiment. The average acquisition time for each inclusion list was ~14.7 s during which 92 MS/MS spectra were acquired thereby generating data for one pixel in each of the 92 MS/MS imaging data sets. During this time, the sample moved under the nano-DESI probe by ~147 μm corresponding to the pixel size in the x-direction. The pixel size in the y-direction is given by the 154 μm spacing between the individual lines. The resulting image is composed of 92 MS/MS data sets with an average pixel size of 147 μm ×154 μm each. To evaluate technical reproducibility of the data, MS/MS imaging experiments were performed on three consecutive sections from the same implantation site. Data reproducibility is demonstrated in Figure S1 of the supporting information for one of the MS/MS data sets.
In this study, a 9:1 methanol:water mixture was used as a working solvent. The solvent was delivered via a syringe pump (Legato 180, KD Scientific) through the primary capillary to the sample at a flow rate of 0.5 μl/min. Ions were produced by nanoelectrospray from the secondary capillary at the mass spectrometer inlet by applying a high voltage of 3.0 kV through the liquid junction created in a stainless steel union holding the primary capillary. The heated capillary was kept at 250°C.
Data Analysis
Raw data obtained using Xcalibur software (Thermo Scientific) were visualized and processed using customized imaging software, MSI QuickView. 61 MSI QuickView provides the platform to process, visualize, analyze and query spatial mass spectrometry data. Applications include the real-time visualization of the high resolution mass spectrometric datasets during experimental acquisition, generation of ion images, visualization of spectra, image processing options, and post-processing options including image classification, normalization, and correction for variations in the acquisition time of individual spectra.37 Because individual line scans obtained in this study contained MS/MS imaging data for 92 precursor m/z values we, first, separated raw data files into 92 individual MS/MS datasets. The individual datasets were subsequently analyzed using MSI QuickView as described in our previous studies.37, 61
Result and discussion
nano-DESI MS/MS imaging experiments were performed on a Q-Exactive instrument (Figure 1a) by sequential isolation and fragmentation of 92 user defined m/z values, shown in Table S1, with an isolation window of 2 amu, while continuously moving the sample under the nano-DESI probe. Because 2-8 isobaric peaks are typically isolated within one mass window, we estimate that MS/MS imaging reported in this study enabled detection of an estimated 300 individual molecules from 92 m/z windows with a spatial resolution of ~150 μm for each isolated m/z range. We did not attempt identifying all the features observed in this experiment but rather focused on several important metabolites and lipids that have been previously observed in mouse embryo tissues. Figure 1c shows an optical image of a representative tissue section analyzed in this study. Implantation in mice occurs at the antimesometrial (AM) pole of the uterus. After attachment, proliferating stromal cells surrounding the implanting embryo begin to differentiate into decidual cells, first forming the avascular primary decidual zone (PDZ). By day 6 of pregnancy, the PDZ is well differentiated and formed, and a secondary decidual zone (SDZ) begins to form around the PDZ. The SDZ is surrounded by the myometrium comprising circular and longitudinal muscle layers. MS/MS imaging was performed for a list of lipids and metabolites observed in uterine tissue sections with reasonable abundance in the full-scan mode. Peak assignment was performed using MS/MS and accurate mass in combination with database searches (METLIN, http://metlin.scripps.edu/, RCM Lipid Calculator, http://pharmacology.ucdenver.edu/lipidcalc/, and LIPID MAPS, http://www.lipidmaps.org/). All ion images shown in this paper were constructed from the raw ion signals; no normalization or smoothing was performed.
Figure 2a shows an average MS/MS spectrum of ions with m/z 132 ± 1. The spectrum is dominated by the [M+H]+ ion of creatine at m/z 132.077 and its fragment at m/z 90.055. Minor fragments of creatine at m/z 114.067, 115.051, and 87.056 are also present in the spectrum. Several other minor peaks including m/z 116.071 and 70.066 correspond to fragment ions of the protonated ornithine (m/z 133.097). We note that although ornithine can be readily separated from creatine by its mass-to-charge ratio, we could not obtain an image of this compound in the full-scan mode. Because ornithine is a low-abundance peak, it was barely seen above the noise level in the full-scan mode MSI. In contrast, in the MS/MS mode, fragment ions of ornithine at m/z 116.071 and 70.066 were observed in individual pixels with an average signal-to-noise of 5 and 10, respectively. It follows that MS/MS imaging enhances the dynamic range of MSI experiments while providing simultaneous identification of the observed molecules. The corresponding 2D images of the precursor and fragment ions of creatine and ornithine are shown in Figure 2b. Both the precursor ion of creatine and ornithine show similar distribution to their respective fragments over the sampled area. Creatine signal is distributed across all the tissue types in the mouse uterine section with measurable enhancement close to the embryo and areas of the myometrium. In contrast, the fragment ions of ornithine show a somewhat different distribution with enhanced signal observed at the mesometrial (M) pole of the myometrium. Creatine supplies energy to all cells in the body and hence is ubiquitous in vertebrate tissues. Specifically, creatine-phosphocreatine shuttle is known to act as an energy buffer, in which creatine kinase converts phosphocreatine and adenosine diphosphate (ADP) into creatine and adenosine triphosphate (ATP).62-63 This energy buffer operates at sites of high energy utilization and helps maintain the ATP/ADP ratio when the ATP production by mitochondrial respiration is insufficient.63 Enhanced creatine signal at the embryo may indicate higher rate of ATP turnover in this region.
Figure 2.
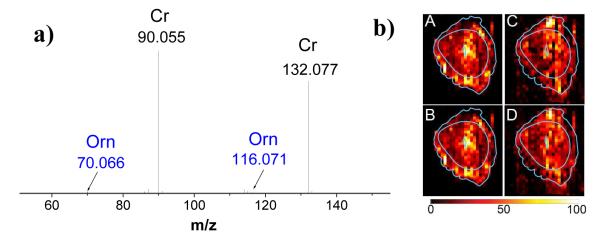
a) Average MS/MS spectrum of m/z 132±1; b) 2D images of creatine (precursor) at m/z 132.07 (A), fragment of creatine at m/z 90.05 (B), ornithine fragments at m/z 116.07 (C) and m/z 70.06 (D). Light blue lines show a trace of the optical image overlaid on top of the ion image. Lateral scale bar 1 mm. Intensity scale bar ranging from 0 (black) to 100% (light yellow) signal intensity of an individual peak.
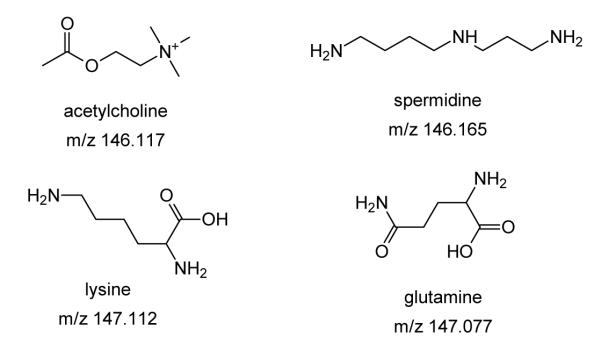
Figure 3a shows an average spectrum of m/z 146 ± 1 and 2D images for selected ions. Detailed analysis of the high-resolution MS/MS data indicated this spectrum contains fragment ions of at least four precursors shown in Scheme 1. These include protonated acetylcholine (m/z 146.117, fragments: m/z 87.045 and 60.082), protonated spermidine (m/z 146.165, fragments: m/z 129.139, 112.113, and 72.082), protonated lysine (m/z 147.113, fragments: m/z 130.086, 129.102, and 84.081), and protonated glutamine (m/z 147.07, fragment: m/z 130.050). The latter is a very minor component in this m/z range with the fragment ion abundance at m/z 130.050 of only ~0.8 % of the main peak in the spectrum. High-resolution MS/MS analysis allowed us to distinguish between the glutamine fragment at m/z 130.050 and its isobaric peak at m/z 130.086, corresponding to the fragment of lysine. Interestingly, the two isobaric peaks have different spatial distributions as shown in Figure 3b. Our results indicate that glutamine (Figure 3b – A, E) localizes mainly to the myometrium, the muscle layer encircling the uterine stroma. This is reasonable since glutamine is primarily produced by muscle tissues. Peripheral nerve terminals in the myometrium may also contribute to these levels. It is interesting that the image obtained for the precursor ion of glutamine shows measurable signal outside the tissue section indicating the presence of an interfering isobaric background peak at m/z 147.07. In contrast, the image obtained for the glutamine fragment at m/z 130.050 is localized to the tissue. This finding demonstrates that MS/MS imaging efficiently eliminates possible interferences and produces higher-quality images as compared to regular MSI. Lysine (Figure 3b – D, H, I), on the other hand, seems to be localized to both the myometrium and areas of the stroma. Spermidine is a polyamine essential to embryo development.64-65 Zhao et al. demonstrated that polyamine-related genes are significantly expressed at the embryo implantation site and suggested that polyamines, spermine and spermidine are essential for endometrial cell proliferation following implantation.64 The image of spermidine reproducibly shows spikes in several locations in the stroma (Figures 3b and S1). Acetylcholine primarily localizes to the avascular PDZ region where low oxygen concentrations can lead to hypoxia. A previous study showed that acetylcholine inhibits long-term hypoxia-induced apoptosis in mouse embryonic stem cells.66 Elevated levels of acetylcholine may be inhibiting hypoxia-induced reactive oxygen species in the PDZ thereby protecting the embryo. Although the isobaric peaks observed in the 146 ± 1 m/z window can be readily separated in the full-scan mode, MS/MS imaging does provides an advantage of simultaneous imaging and identification of the observed metabolites in each pixel in the image. It is also important to note that because of the overlap with background ion signals two of the four features in this m/z window could not be imaged in the full-scan mode. 2D images of m/z 147.07 and m/z 147.113 corresponding to m/z of glutamine and lysine, respectively, obtained in the full-scan model are shown in Figure S1 of the supporting information. Both images show significantly enhanced ion signal outside the tissue sample, which is typical for background peaks. Because of the interference with a background ion signal, it is impossible to obtain reliable ion images of glutamine and lysine in the full-scan mode. In contrast, MS/MS imaging of the fragment ions of glutamine and lysine enabled spatial localization of these metabolites in mouse uterine tissue sections.
Figure 3.

a) Average MS/MS spectrum of m/z 146± 1.The spectrum is a combination of MS/MS of the four precursor ions shown in Scheme 1. Color coding was used for labeling fragment ions of the following protonated precursors: glutamine (red), spermidine (blue), acetylcholine (black), lysine (green). b) 2D images of the four precursor ions (A– glutamine at m/z 147.07, B– spermidine at m/z 146.16, C– acetylcholine at m/z 146.11, D– lysine at m/z 147.11), and the corresponding fragments at m/z 130.05 (E), 72.08 (F), 87.04 (G), and 130.08 (H), respectively. Light blue lines show a trace of the optical image overlaid on top of the ion image. Lateral scale bar 1 mm. Intensity scale bar ranging from 0 (black) to 100% (light yellow) signal intensity of an individual peak.
Scheme 1.
Results from the following example demonstrate separation by MS/MS imaging of isobaric peaks that cannot be readily separated in the full-scan mode. Figure 4a shows an average MS/MS spectrum of the isolated m/z 770 ± 1. The spectrum contains characteristic fragment ions of phospholipids.67-68 For example, the peak at m/z 86.097 corresponds to CH2=CH-N(CH3)3+ and the peak at m/z 184.074 (C5H15NPO4+) corresponds to the phosphatidylcholine head group typically observed in CID of glycerophosphatidylcholines. Other abundant low-mass ions observed in the spectrum include m/z 146.982 and m/z 162.956 corresponding to sodium and potassium adducts of ethyl phosphate (C2H5PO4), respectively. It follows that the peak at m/z 770 is composed of both sodium and potassium adducts of phospholipids. Neutral losses of 59.073 (N(CH3)3) and 221.017 (potassium salt of the PC headgroup, C5H13NPO4K) are consistent with the presence of an [M+K]+ ion of phosphatidylcholine (PC), while neutral losses of 43.039 (C2H5N) and 141.019 (C2H8NPO4) indicate the presence of phosphatidylethanolamine (PE) at this nominal mass. Subsequent neutral loss of 328.24 from the [M+Na-43.039]+ ion indicates the presence of the 22:6 fatty acid in the sn-2 position.68 Based on the accurate mass measurement of the neutral losses and the observed fragmentation pattern, we identified this lipid as a plasmenyl PE (P-16:0/22:6) species (m/z 770.5095) while the PC lipid at m/z 770.5095 was identified as [M+K]+ ion of PC 32:1. Separation of these lipids in the full scan mode would require a mass resolving power of 3,850,000, which is challenging even using the most advanced high-resolution mass spectrometers. The MS/MS image obtained for the PE lipid is consistent with previously published data.50 Specifically, the PE (P-16:0/22:6) image in Figure 4b shows no distinct cellular localization just like the previously published MALDI-TOF image of this lipid in day 6 implantation site.50 Conversely, the PC 32:1 image in Figure 4b shows high abundance at the embryo.
Figure 4.

a) Average MS/MS spectrum of m/z 770 ± 1; b) 2D images of selected fragment ions of the [M+Na]+ ion of the PE(P-16:0/22:6): A– m/z 727.48 (NL 43.04), B– m/z 629.49 (NL 141.03), and C– m/z 146.98; 2D images of selected fragment ions of the [M+K]+ ion of the PC(14:0/18:1) lipid: D– m/z 711.43 (NL 59.07), E– m/z 549.48 (NL 221.02), and F– m/z 162.95. Light blue lines show a trace of the optical image. Lateral scale bar 1 mm. Intensity scale bar ranging from 0 (black) to 100% (light yellow) signal intensity of an individual peak.
Because glycerophospholipids are abundant in nano-DESI spectra of tissue samples, a majority of ions with m/z>500 examined in this study correspond to alkali adducts of glycerophospholipids. Ion mapping option of the Xcalibur software allowed us to classify the observed species based on the characteristic neutral losses. Figure 5 shows an example of such classification performed for lipids containing a phosphatidylcholine headgroup (PC or SM). Specifically, we extracted the abundances of precursor ions showing the characteristic losses of 59.07 and 183.06 from the phosphatidylcholine head group.67, 69-70 These ions are shown as positive signal in Figure 5. A majority of ions containing the phosphatidylcholine head group are observed at even m/z indicating these are PC lipids whereas SM lipids containing one additional nitrogen atom are observed at odd m/z.71 The observed peaks can be further separated into [M+Na]+ and [M+K]+ ions based on the loss of the sodium or potassium adduct of phosphatidylcholine corresponding to neutral loss of 205.05 or 221.02, respectively.67 [M+Na]+ and [M+K]+ ions of PC lipids, shown as negative signal in Figure 5, were identified using this approach. Several abundant lysoPC species are observed as sodium adducts at m/z<600.
Figure 5.

Characteristic neutral losses of PC lipids observed in MS/MS nano-DESI imaging experiments. Losses of 59.07 (trimethylamine) and 183 (PC headgroup) are shown as positive signal. Losses of the sodium and potassium adducts of phosphocholine (NL 205.05 and 221.01, respectively) are shown as negative signal.
MS/MS images of selected [M+Na]+ ions of PC lipids and their characteristic fragments are shown in Figure S2 of the supporting information. MS/MS imaging indicates PC 32:0 lipid (A) is distributed across the tissue section; when compared to each other PC 34:1 (B) is enhanced in the M pole and PC 36:2 (C) is enhanced in the AM pole. Both PC 36:1 (D) that differs only by one double bond and the less saturated PC 38:4 show similar spatial distributions enhanced in the AM pole as PC 36:2. These results are consistent with the MALDI data for day 6 uterine tissue sections reported by Burnum et al.50 Comparison with the literature data indicates that nano-DESI MS/MS imaging provides accurate mapping of phospholipids in tissue sections. Furthermore, the ability to resolve isobaric peaks by imaging the corresponding fragment ions enables spatial mapping of ions that cannot be separated in MSI experiments.
In addition to the ability to separate closely spaced isobaric peaks, MS/MS imaging enables separation of isomeric lipids. Figure 6 shows an example of an MS/MS data set, in which both isobaric and isomeric lipids are separated and imaged in a single experiment. Figure 6a shows an average spectrum of m/z 808 ± 1. The spectrum is dominated by the peak at m/z 146.982 indicating the presence of a sodium adduct of a PC lipid. Fragment ions at m/z 749.521, 625.519, and 603.540 corresponding to neutral losses of 59.07, 183.06, and 205.05, respectively, are consistent with this assertion. As discussed earlier, neutral losses of 59.07 and 183.06 are characteristic of alkali adducts of PC lipids while the loss of 205.05 is unique for sodium adducts. The fragment ion at m/z 184.074 (C5H15NPO4)+ indicates the presence of a protonated PC. It follows that two PC species, [PC 36:2 +Na]+ (m/z 808.5827) and [PC 38:5 +H]+ (m/z 808.5851) separated by 0.0024 Da, are found in the m/z window of 808 ± 1. A mass resolving power of ~330,000 -- well beyond the highest mass resolving power achievable with Q-Exactive -- is required for separating these ions in the full-scan mode. Left panels in Figure 6b show 2D ion images of the precursor ion at m/z 808.591, the [M+Na-59]+ fragment at m/z 749.521, and the abundant head group fragment of [PC 38:5 +H]+ at m/z 184.074. Clearly, the spatial distributions of [PC 36:2 +Na]+ and [PC 38:5 +H]+ ions are quite different. Specifically, the fragment from the head group of [PC 38:5 +H]+ is distributed evenly across the tissue while the [M+Na-59]+ fragment of [PC 36:2 +Na]+ is enhanced in the AM pole and near the embryo.
Figure 6.

a) Average MS/MS spectrum of m/z 808 ± 1; b) 2D images of the precursor ion at m/z 808.592 (A) and selected fragment ions. B– m/z 749.521 (NL 59.07 from [PC 36:2 +Na]+); C– m/z 184.074 (characteristic fragment of [PC 38:5 +H]+); D– m/z 465.235 (loss of FA 18:0 from [PC 36:2 +Na]+); E– m/z 467.251 (loss of FA 18:1 from [PC 36:2 +Na]+); F– m/z 469.27 (loss of FA 18:2 from [PC 36:2 +Na]+). Lateral scale bar 1 mm. Intensity scale bar ranging from 0 (black) to 100% (light yellow) signal intensity of an individual peak.
Several fragment ions corresponding to losses of fatty acid (FA) tail groups from [PC 36:2 +Na]+ were also observed in the spectrum, some of which are shown in the insert of Figure 7a. These include fragments at m/z 465.235, 467.251, and 469.270 corresponding to losses of FA 18:0, FA 18:1, and FA 18:2, respectively, from the [M+Na-59]+ fragment. The observed fragmentation is consistent with the presence of two isomeric structures of PC 36:2. Losses of FA 18:0 and FA 18:2 indicate the presence of PC 18:0/18:2 while the loss of FA 18:1 indicates the presence of PC 18:1/18:1. Right panels in Figure 6b show 2D ion images of these fragment ions. As expected, ions at m/z 465.236 and 469.270 originating from PC 18:0/18:2 are co-localized. The observed distribution of these fragment ions indicates that PC 18:0/18:2 is enhanced in the AM pole. In contrast, the fragment ion at m/z 467.251 PC 18:1/18:1 is enhanced near the embryo and in the M pole. Our observations are consistent with the study by Burnum et al. that reported localization of different classes of phospholipids containing FA 18:2 (linoleate) to the AM pole and enhancement of phospholipids containing FA 18:1 (oleate) at the M pole.50 Our results indicate that subtle differences in the structures of FA tail groups may have a significant effect on the spatial localization of isomeric lipids.
Conclusions
This study demonstrated for the first time ambient MS/MS imaging of a large number of compounds in tissue sections with a spatial resolution of better than 150 μm (we estimate that at least 300 compounds were simultaneously detected in one experiment). Imaging was performed using nano-DESI, an ambient ionization technique that relies on a localized liquid extraction of molecules from tissue sections. MS/MS imaging enables simultaneous spatial mapping and identification of the extracted molecules, efficiently eliminates isobaric interferences from background peaks, and separates isomeric and isobaric compounds based on their unique fragment ions. These features of MS/MS imaging combined with the high sensitivity of nano-DESI imaging and high-resolution mass analysis enable remarkably detailed characterization of lipid and metabolite localization in tissue sections.
Supplementary Material
Acknowledgements
The research described in this paper is part of the Chemical Imaging Initiative, at Pacific Northwest National Laboratory (PNNL). It was conducted under the Laboratory Directed Research and Development Program at PNNL a multiprogram national laboratory operated by Battelle for the U.S. Department of Energy (DOE) under Contract DE-AC05-76RL01830. The research was performed at EMSL, a national scientific user facility sponsored by the DOE’s Office of Biological and Environmental Research and located at PNNL. This work was partially supported by NIH grants (HD068524 and DA06668 to SKD), and JC is supported by a Ruth L. Kirschstein Predoctoral NRSA Fellowship (F30AG040858).
References
- 1.Pacholski ML, Winograd N. Chem. Rev. 1999;99:2977–3005. doi: 10.1021/cr980137w. [DOI] [PubMed] [Google Scholar]
- 2.Caldwell RL, Caprioli RM. Mol. Cell. Proteomics. 2005;4:394–401. doi: 10.1074/mcp.R500006-MCP200. [DOI] [PubMed] [Google Scholar]
- 3.McDonnell LA, Heeren RMA. Mass Spectrom. Rev. 2007;26:606–643. doi: 10.1002/mas.20124. [DOI] [PubMed] [Google Scholar]
- 4.Reyzer ML, Caprioli RM. Curr. Opin. Chem. Biol. 2007;11:29–35. doi: 10.1016/j.cbpa.2006.11.035. [DOI] [PubMed] [Google Scholar]
- 5.Walch A, Rauser S, Deininger SO, Hofler H. Histochemistry and Cell Biology. 2008;130:421–434. doi: 10.1007/s00418-008-0469-9. [DOI] [PMC free article] [PubMed] [Google Scholar]
- 6.Ifa DR, Wu CP, Ouyang Z, Cooks RG. Analyst. 2010;135:669–681. doi: 10.1039/b925257f. [DOI] [PubMed] [Google Scholar]
- 7.Vickerman JC. Analyst. 2011;136:2199–2217. doi: 10.1039/c1an00008j. [DOI] [PubMed] [Google Scholar]
- 8.Chaurand P. Journal of Proteomics. 2012;75:4883–4892. doi: 10.1016/j.jprot.2012.04.005. [DOI] [PubMed] [Google Scholar]
- 9.Gode D, Volmer DA. Analyst. 2013;138:1289–1315. doi: 10.1039/c2an36337b. [DOI] [PubMed] [Google Scholar]
- 10.Greer T, Sturm R, Li LJ. Journal of Proteomics. 2011;74:2617–2631. doi: 10.1016/j.jprot.2011.03.032. [DOI] [PMC free article] [PubMed] [Google Scholar]
- 11.Andersson M, Andren P, Caprioli RM. MALDI Imaging and Profiling Mass Spectrometry in Neuroproteomics. In: Alzate O, editor. Neuroproteomics. CRC Press; Boca Raton (FL): 2010. [Google Scholar]
- 12.Watrous JD, Alexandrov T, Dorrestein PC. J. Mass Spectrom. 2011;46:209–222. doi: 10.1002/jms.1876. [DOI] [PMC free article] [PubMed] [Google Scholar]
- 13.Cornett DS, Reyzer ML, Chaurand P, Caprioli RM. Nature Methods. 2007;4:828–833. doi: 10.1038/nmeth1094. [DOI] [PubMed] [Google Scholar]
- 14.Eberlin LS, Ifa DR, Wu C, Cooks RG. Angewandte Chemie-International Edition. 2010;49:873–876. doi: 10.1002/anie.200906283. [DOI] [PMC free article] [PubMed] [Google Scholar]
- 15.Wiseman JM, Ifa DR, Song QY, Cooks RG. Angewandte Chemie-International Edition. 2006;45:7188–7192. doi: 10.1002/anie.200602449. [DOI] [PubMed] [Google Scholar]
- 16.Nemes P, Vertes A. Anal. Chem. 2007;79:8098–8106. doi: 10.1021/ac071181r. [DOI] [PubMed] [Google Scholar]
- 17.Nemes P, Barton AA, Vertes A. Anal. Chem. 2009;81:6668–6675. doi: 10.1021/ac900745e. [DOI] [PubMed] [Google Scholar]
- 18.Yanes O, Woo H-K, Northen TR, Oppenheimer SR, Shriver L, Apon J, Estrada MN, Potchoiba MJ, Steenwyk R, Manchester M, Siuzdak G. Anal. Chem. 2009;81:2969–2975. doi: 10.1021/ac802576q. [DOI] [PMC free article] [PubMed] [Google Scholar]
- 19.Inutan ED, Wager-Miller J, Mackie K, Trimpin S. Anal. Chem. 2012;84:9079–9084. doi: 10.1021/ac301665h. [DOI] [PMC free article] [PubMed] [Google Scholar]
- 20.Richards AL, Lietz CB, Wager-Miller J, Mackie K, Trimpin S. J. Lipid Res. 2012;53:1390–1398. doi: 10.1194/jlr.D019711. [DOI] [PMC free article] [PubMed] [Google Scholar]
- 21.Lanekoff I, Thomas M, Carson JP, Smith JN, Timchalk C, Laskin J. Anal. Chem. 2012;85:882–889. doi: 10.1021/ac302308p. [DOI] [PubMed] [Google Scholar]
- 22.Laskin J, Heath BS, Roach PJ, Cazares L, Semmes OJ. Anal. Chem. 2012;84:141–148. doi: 10.1021/ac2021322. [DOI] [PMC free article] [PubMed] [Google Scholar]
- 23.Prideaux B, Stoeckli M. Journal of Proteomics. 2012;75:4999–5013. doi: 10.1016/j.jprot.2012.07.028. [DOI] [PubMed] [Google Scholar]
- 24.Esquenazi E, Yang Y-L, Watrous J, Gerwick WH, Dorrestein PC. Natural Product Reports. 2009;26:1521–1534. doi: 10.1039/b915674g. [DOI] [PubMed] [Google Scholar]
- 25.Watrous JD, Dorrestein PC. Nat Rev Micro. 2011;9:683–694. doi: 10.1038/nrmicro2634. [DOI] [PMC free article] [PubMed] [Google Scholar]
- 26.McLean JA, Ridenour WB, Caprioli RM. J. Mass Spectrom. 2007;42:1099–1105. doi: 10.1002/jms.1254. [DOI] [PubMed] [Google Scholar]
- 27.Trim PJ, Henson CM, Avery JL, McEwen A, Snel MF, Claude E, Marshall PS, West A, Princivalle AP, Clench MR. Anal. Chem. 2008;80:8628–8634. doi: 10.1021/ac8015467. [DOI] [PubMed] [Google Scholar]
- 28.Cornett DS, Frappier SL, Caprioli RM. Anal. Chem. 2008;80:5648–5653. doi: 10.1021/ac800617s. [DOI] [PMC free article] [PubMed] [Google Scholar]
- 29.Koestler M, Kirsch D, Hester A, Leisner A, Guenther S, Spengler B. Rapid Commun. Mass Spectrom. 2008;22:3275–3285. doi: 10.1002/rcm.3733. [DOI] [PubMed] [Google Scholar]
- 30.Sampson JS, Hawkridge AM, Muddiman DC. J. Am. Soc. Mass. Spectrom. 2008;19:1527–1534. doi: 10.1016/j.jasms.2008.06.013. [DOI] [PMC free article] [PubMed] [Google Scholar]
- 31.Jun JH, Song ZH, Liu ZJ, Nikolau BJ, Yeung ES, Lee YJ. Anal. Chem. 2010;82:3255–3265. doi: 10.1021/ac902990p. [DOI] [PubMed] [Google Scholar]
- 32.Manicke NE, Dill AL, Ifa DR, Cooks RG. J. Mass Spectrom. 2010;45:223–226. doi: 10.1002/jms.1707. [DOI] [PMC free article] [PubMed] [Google Scholar]
- 33.Perdian DC, Lee YJ. Anal. Chem. 2010;82:9393–9400. doi: 10.1021/ac102017q. [DOI] [PubMed] [Google Scholar]
- 34.Rompp A, Guenther S, Schober Y, Schulz O, Takats Z, Kummer W, Spengler B. Angewandte Chemie-International Edition. 2010;49:3834–3838. doi: 10.1002/anie.200905559. [DOI] [PubMed] [Google Scholar]
- 35.Vidova V, Pol J, Volny M, Novak P, Havlicek V, Wiedmer SK, Holopainen JM. J. Lipid Res. 2010;51:2295–2302. doi: 10.1194/jlr.M005488. [DOI] [PMC free article] [PubMed] [Google Scholar]
- 36.Guenther S, Rompp A, Kummer W, Spengler B. Int. J. Mass spectrom. 2011;305:228–237. [Google Scholar]
- 37.Lanekoff I, Heath BS, Liyu A, Thomas M, Carson JP, Laskin J. Anal. Chem. 2012;84:8351–8356. doi: 10.1021/ac301909a. [DOI] [PubMed] [Google Scholar]
- 38.Shahidi-Latham SK, Dutta SM, Conaway MCP, Rudewicz PJ. Anal. Chem. 2012;84:7158–7165. doi: 10.1021/ac3015142. [DOI] [PubMed] [Google Scholar]
- 39.Robichaud G, Barry JA, Garrard KP, Muddiman DC. J. Am. Soc. Mass. Spectrom. 2013;24:92–100. doi: 10.1007/s13361-012-0505-9. [DOI] [PMC free article] [PubMed] [Google Scholar]
- 40.Smith DF, Kiss A, Leach FE, Robinson EW, Pasa-Tolic L, Heeren RMA. Analytical and Bioanalytical Chemistry. 2013;405:6069–6076. doi: 10.1007/s00216-013-7048-1. [DOI] [PubMed] [Google Scholar]
- 41.Reyzer ML, Hsieh Y, Ng K, Korfmacher WA, Caprioli RM. J. Mass Spectrom. 2003;38:1081–1092. doi: 10.1002/jms.525. [DOI] [PubMed] [Google Scholar]
- 42.Khatib-Shahidi S, Andersson M, Herman JL, Gillespie TA, Caprioli RM. Anal. Chem. 2006;78:6448–6456. doi: 10.1021/ac060788p. [DOI] [PubMed] [Google Scholar]
- 43.Wiseman JM, Ifa DR, Zhu YX, Kissinger CB, Manicke NE, Kissinger PT, Cooks RG. Proceedings of the National Academy of Sciences of the United States of America. 2008;105:18120–18125. doi: 10.1073/pnas.0801066105. [DOI] [PMC free article] [PubMed] [Google Scholar]
- 44.Kertesz V, Van Berkel GJ, Vavrek M, Koeplinger KA, Schneider BB, Covey TR. Anal. Chem. 2008;80:5168–5177. doi: 10.1021/ac800546a. [DOI] [PubMed] [Google Scholar]
- 45.Li F, Hsieh Y, Kang L, Sondey C, Lachowicz J, Korfmacher WA. Bioanalysis. 2009;1:299–307. doi: 10.4155/bio.09.27. [DOI] [PubMed] [Google Scholar]
- 46.Prideaux B, Dartois V. r., Staab D, Weiner DM, Goh A, Via LE, Barry CE, Iii, Stoeckli M. Anal. Chem. 2011;83:2112–2118. doi: 10.1021/ac1029049. [DOI] [PMC free article] [PubMed] [Google Scholar]
- 47.Goodwin RJA, Scullion P, MacIntyre L, Watson DG, Pitt AR. Anal. Chem. 2010;82:3868–3873. doi: 10.1021/ac100398y. [DOI] [PubMed] [Google Scholar]
- 48.Pirman DA, Reich RF, Kiss A, Heeren RMA, Yost RA. Anal. Chem. 2012;85:1081–1089. doi: 10.1021/ac302960j. [DOI] [PubMed] [Google Scholar]
- 49.Nilsson A, Fehniger TE, Gustavsson L, Andersson M, Kenne K, Marko-Varga G, Andren PE. PLoS One. 2010;5 doi: 10.1371/journal.pone.0011411. [DOI] [PMC free article] [PubMed] [Google Scholar]
- 50.Burnum KE, Cornett DS, Puolitaival SM, Milne SB, Myers DS, Tranguch S, Brown HA, Dey SK, Caprioli RM. J. Lipid Res. 2009;50:2290–2298. doi: 10.1194/jlr.M900100-JLR200. [DOI] [PMC free article] [PubMed] [Google Scholar]
- 51.Yagnik GB, Korte AR, Lee YJ. J. Mass Spectrom. 2013;48:100–104. doi: 10.1002/jms.3134. [DOI] [PubMed] [Google Scholar]
- 52.Roach PJ, Laskin J, Laskin A. Analyst. 2010;135:2233–2236. doi: 10.1039/c0an00312c. [DOI] [PubMed] [Google Scholar]
- 53.Nguyen TB, Roach PJ, Laskin J, Laskin A, Nizkorodov SA. Atmospheric Chemistry and Physics. 2011;11:6931–6944. [Google Scholar]
- 54.Roach PJ, Laskin J, Laskin A. Anal. Chem. 2011;83:4924–4929. doi: 10.1021/ac200654j. [DOI] [PubMed] [Google Scholar]
- 55.Eckert PA, Roach PJ, Laskin A, Laskin J. Anal. Chem. 2012;84:1517–1525. doi: 10.1021/ac202801g. [DOI] [PubMed] [Google Scholar]
- 56.Laskin J, Eckert PA, Roach PJ, Heath BS, Nizkorodov SA, Laskin A. Anal. Chem. 2012;84:7179–7187. doi: 10.1021/ac301533z. [DOI] [PubMed] [Google Scholar]
- 57.O’Brien RE, Laskin A, Laskin J, Liu S, Weber R, Russell LM, Goldstein AH. Atmos. Environ. 2013;68:265–272. [Google Scholar]
- 58.Watrous J, Roach P, Alexandrov T, Heath BS, Yang JY, Kersten RD, van der Voort M, Pogliano K, Gross H, Raaijmakers JM, Moore BS, Laskin J, Bandeira N, Dorrestein PC. Proceedings of the National Academy of Sciences of the United States of America. 2012;109:E1743–E1752. doi: 10.1073/pnas.1203689109. [DOI] [PMC free article] [PubMed] [Google Scholar]
- 59.Lanekoff I, Geydebrekht O, Pinchuk GE, Konopka AE, Laskin J. Analyst. 2013;138:1971–1978. doi: 10.1039/c3an36716a. [DOI] [PubMed] [Google Scholar]
- 60.Daikoku T, Cha J, Sun X, Tranguch S, Xie H, Fujita T, Hirota Y, Lydon J, DeMayo F, Maxson R, Dey, Sudhansu K. Developmental Cell. 2011;21:1014–1025. doi: 10.1016/j.devcel.2011.09.010. [DOI] [PMC free article] [PubMed] [Google Scholar]
- 61.Thomas M, Heath BS, Laskin J, Li DS, Liu E, Hui K, Kuprat AP, van Dam KK, Carson JP. Ieee, Visualization of High Resolution Spatial Mass Spectrometric Data during Acquisition. 2012 Annual International Conference of the Ieee Engineering in Medicine and Biology Society; New York. Ieee; 2012. pp. 5545–5548. [DOI] [PubMed] [Google Scholar]
- 62.Greenhaff PL. The Journal of Physiology. 2001;537:657. doi: 10.1111/j.1469-7793.2001.00657.x. [DOI] [PMC free article] [PubMed] [Google Scholar]
- 63.Bessman SP, Carpenter CL. Annu. Rev. Biochem. 1985;54:831–862. doi: 10.1146/annurev.bi.54.070185.004151. [DOI] [PubMed] [Google Scholar]
- 64.Zhao YC, Chi YJ, Yu YS, Liu JL, Su RW, Ma XH, Shan CH, Yang ZM. Endocrinology. 2008;149:2325–2332. doi: 10.1210/en.2007-1420. [DOI] [PubMed] [Google Scholar]
- 65.Lefèvre PLC, Palin M-F, Murphy BD. Endocrine Reviews. 2011;32:694–712. doi: 10.1210/er.2011-0012. [DOI] [PubMed] [Google Scholar]
- 66.Kim M, Kim M, Heo J, Kim J, Han H. Apoptosis. 2008;13:295–304. doi: 10.1007/s10495-007-0160-y. [DOI] [PubMed] [Google Scholar]
- 67.Hsu FF, Turk J. Journal of Chromatography B-Analytical Technologies in the Biomedical and Life Sciences. 2009;877:2673–2695. doi: 10.1016/j.jchromb.2009.02.033. [DOI] [PMC free article] [PubMed] [Google Scholar]
- 68.Hsu FF, Turk J. J. Am. Soc. Mass. Spectrom. 2008;19:1681–1691. doi: 10.1016/j.jasms.2008.07.023. [DOI] [PMC free article] [PubMed] [Google Scholar]
- 69.Blanksby SJ, Mitchell TW. Annual Review of Analytical Chemistry. 2010;3:433–465. doi: 10.1146/annurev.anchem.111808.073705. [DOI] [PubMed] [Google Scholar]
- 70.Pulfer M, Murphy RC. Mass Spectrom. Rev. 2003;22:332–364. doi: 10.1002/mas.10061. [DOI] [PubMed] [Google Scholar]
- 71.Manicke NE, Wiseman JM, Ifa DR, Cooks RG. J. Am. Soc. Mass. Spectrom. 2008;19:531–543. doi: 10.1016/j.jasms.2007.12.003. [DOI] [PubMed] [Google Scholar]
Associated Data
This section collects any data citations, data availability statements, or supplementary materials included in this article.