Abstract
The conventional Poisson-Nernst-Planck equations do not account for the finite size of ions explicitly. This leads to solutions featuring unrealistically high ionic concentrations in the regions subject to external potentials, in particular, near highly charged surfaces. A modified form of the Poisson-Nernst-Planck equations accounts for steric effects and results in solutions with finite ion concentrations. Here, we evaluate numerical methods for solving the modified Poisson-Nernst-Planck equations by modeling electric field-driven transport of ions through a nanopore. We describe a novel, robust finite element solver that combines the applications of the Newton's method to the nonlinear Galerkin form of the equations, augmented with stabilization terms to appropriately handle the drift-diffusion processes.
To make direct comparison with particle-based simulations possible, our method is specifically designed to produce solutions under periodic boundary conditions and to conserve the number of ions in the solution domain. We test our finite element solver on a set of challenging numerical experiments that include calculations of the ion distribution in a volume confined between two charged plates, calculations of the ionic current though a nanopore subject to an external electric field, and modeling the effect of a DNA molecule on the ion concentration and nanopore current.
Keywords: Steric effects, nucleic acids, ionic current, continuum transport theory, ion channels, PNP, SUPG, finite element method
1 Introduction
Beginning with the experiments that revealed the microscopic mechanisms of nerve cell excitation [1], measurements of ion currents through nanoscale channels and pores have become the basis of many experimental techniques in biology and biotechnology. In addition to permitting the study of the behavior of individual proteins that allow the passage of ions into and out of cells [2], ion current measurements through nanopores have been used to study the rupture of molecular bonds [3–5], to distinguish between similar molecules [6], and to determine the properties and sequences of nucleic acid molecules [7–11]. However, since direct experimental imaging of molecules within nano-pores is extremely difficult, computation plays an important role in associating current with nanoscale phenomenon [12–19] (see [20, 21] for recent reviews of the field).
Equilibrium and transport properties of ionic solutions can be simulated using explicit ion methods such as all-atom molecular dynamics [16, 20] or Brownian dynamics [22–24], or by using continuum models such as the Poisson-Boltzmann and Poisson-Nernst-Planck equations [25, 26]. While the explicit ion methods provide the most accurate description of the system's behavior, both in spatial and temporal domains, they are stochastic in nature and thus require long, computationally expensive simulations to obtain average properties. Furthermore, the application of an explicit ion method usually requires the system to be described with the same resolution over the entire simulation domain. Often, this leads to a situation where a majority of the computational effort is applied to simulate a nearly uniform solution where quantities of interest exhibit little variation. In contrast, continuum methods allow different regions of the same system to be described at varying levels of detail, and thus focus the computational effort on regions that require a more precise description. In addition to being more computationally efficient, continuum models more easily incorporate certain types of boundary conditions that arise in physical systems, such as boundaries of fixed concentration or electrostatic potential.
The traditional continuum approach to modeling ionic transport is based on the Poisson-Nernst-Planck equations (PNPE). Although the PNPE have been applied successfully to model the electro-diffusion phenomena [27, 28], the equations are not without drawbacks. Within the PNPE approach, ions are modeled as mathematical points of negligible physical dimension, thereby allowing for accumulation of ions at unrealistically high concentrations in certain regions of the system. A modified formulation of the PNPE, called the modified Poisson-Nernst-Planck equations (MPNPE) [29], explicitly takes the physical dimensions of ions into consideration, which limits the maximum concentration that attained in the system. The advantage of using MPNPE over PNPE becomes apparent in the systems that contain regions subject to strong attractive potentials, for example, near charged surfaces.
In this work, we explore the MPNPE approach for modeling equilibrium and transport properties of ionic solutions in realistic three-dimensional geometries subject to realistic applied potentials. The finite difference method has been widely used to solve the Nernst-Planck equations in one or three dimensions [27, 30–32]. Although the finite difference method is straightforward to implement, applying this method to systems that have curved boundaries and complicated geometries is challenging. In this respect, using a finite element method is more appropriate as it naturally handles complex geometries, such as the molecular surfaces of DNA molecules and ion channels. Finite element methods for solving the three-dimensional PNPE have already been described [33, 34]. However, numerical studies of the MPNPE have been limited to one-dimensional systems [29] or the three dimensional spherical case [35] and have not been applied to simulate ion flow through a solid-state nanopore, which is the main process considered in this work.
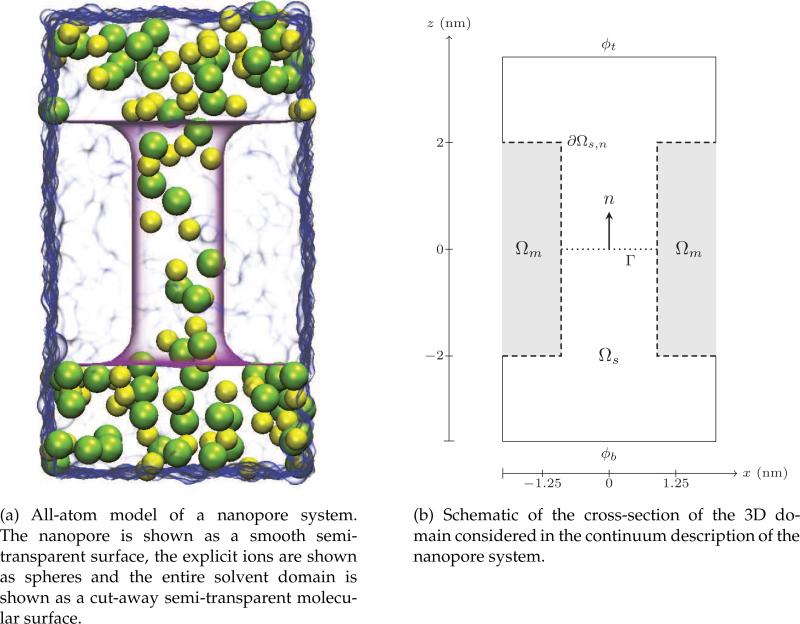
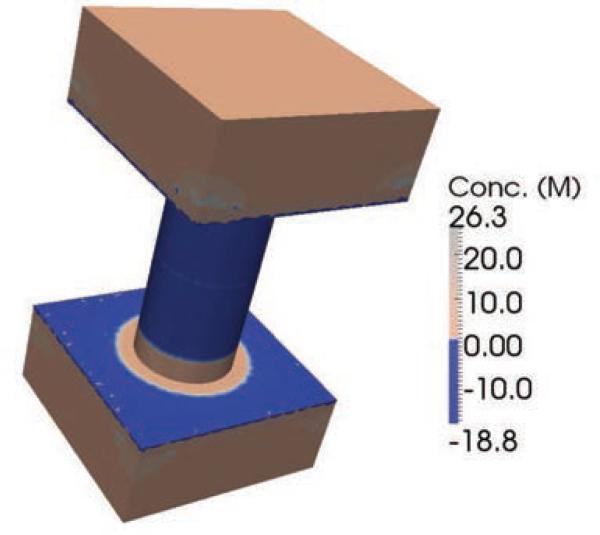
Here, we introduce a three-dimensional MPNPE solver for the simulation of ionic current through nanopores, which can handle the complex geometry of the system and the realistic microscopic potentials the ions are subject to. The nanopore system is illustrated in Fig. 2 and described in detail in Section 2. In contrast to the previous efforts, our finite element method conserves ion concentration, takes into account the sharp repulsive potentials present near the walls of an ion channel [13, 27], and is able to reproduce the results of explicit ions simulations. The presence of a sharp, repulsive potential at the interface of fluid and solid-state domains necessitates formulation of a new stable numerical method for finding the solution of the PNPE and the MPNPE. Specifically, we found that, when applied to our nanopore systems, standard finite element methods become unstable and produce spurious results such as negative concentrations. Fig. 1 gives an example of such behavior. The sharp repulsive potential near the walls of a nanopore causes instability of the Galerkin method, producing spurious negative concentration values (see Section 4, Experiment 3 for more details). Below, we describe a numerical procedure that stabilizes the finite element method in the presence of sharp repulsive potentials, which is one of the main results of this works.
Figure 2.
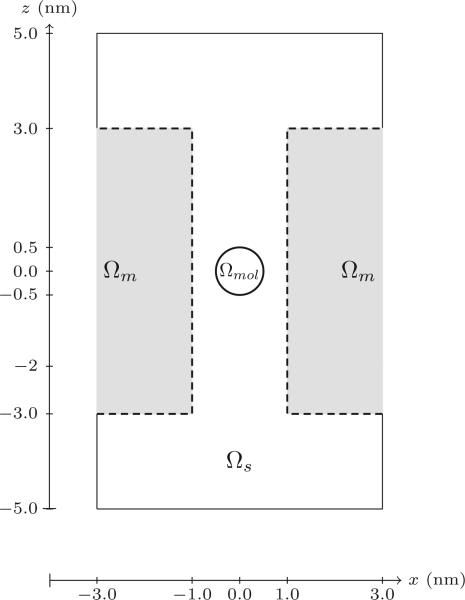
Description of the problem domain. The 3D domain is approximately 7.2 nm in length and 4 nm in width. The pore has a radius of 0.9 nm and a height of 4 nm. Dashed lines in the figure on the right represent a blocking boundary, while solid lines represent a periodic boundary for Nernst-Planck equations, and Dirichlet boundary at the top and bottom for the Poisson equation.
(a) All-atom model of a nanopore system. The nanopore is shown as a smooth semi-transparent surface, the explicit ions are shown as spheres and the entire solvent domain is shown as a cut-away semi-transparent molecular surface.
(b) Schematic of the cross-section of the 3D domain considered in the continuum description of the nanopore system.
Figure 1.
Concentration of negatively-charged ions in a nanopore system obtained as a solution of the PNP equations using the standard Galerkin method. The concentration attains unphysical negative values near the surface of the nanopore because of the sharp repulsive potential. A detailed description of this calculation is provided in Section 4 (Experiment 3). The average ion concentration in the solvent domain of the system is 1.623 M.
The remainder of the paper is organized as follows. Section 2 introduces the systems and the governing equations. Our nonlinear finite element method for solving the MPNPE is described in Section 3. Also in this section, we provide the Galerkin formulation for the equations that do not have large drift terms, and a streamline-upwind-Petrov-Galerkin (SUPG) method for the equations in which such terms are present. In Section 4 we describe the results of several computational experiments that highlight the utility of the MPNPE and the necessity of having a stabilized algorithm. The paper concludes with final remarks.
2 Problem description
In this section we give a brief overview of the problem and review the relevant equations.
2.1 Governing equations
We consider the Poisson-Nernst-Planck Equations (PNPE) for a 1:1 electrolyte solution (referred to as solvent) described over a computational domain, denoted by , which includes both the solvent region, represented as Ωs, as well as a molecular or membrane region, Ωm, which is void of solvent. The time dependent PNPE are given as [27]
| (2.1) |
| (2.2) |
where ϕ is the electrostatic potential and U is the potential due to other interactions (such as van der Waals and solvation forces), which is assumed to be the same for both ionic species. Hereafter, we will refer to potential U as a non-electrostatic potential, to differentiate it from the explicit electrostatic potential ϕ. In the Nernst-Planck equation, (2.1), the concentration of positive and negative ions are c+ and c–, respectively, kB is the Boltzmann's constant, T is temperature, e is the charge on an electron and D± are the diffusivities of the positive and negative ions, respectively. In the Poisson equation, (2.2), we assume a piecewise constant dielectric coefficient ε that is defined in the two sub-domains, Ωs and Ωm. For simplicity, we write the total potential energy experienced by an ion as V± =±eϕ+U.
The modified form of the PNPE (MPNPE) adds a nonlinear term to each of the two Nernst-Planck equations in (2.1) to model the steric repulsion. The Poisson equation remains unchanged, however the modified Nernst Planck equations are [29],
| (2.3) |
Here a is the size of the ion (assumed to be the same for both species). As a result, in this model the maximum permitted concentration is bounded by 1/a3, which we refer to as the steric limit. To simplify the presentation of the material that follows, we write the PNPE and the MPNPE as
| (2.4) |
where
| (2.5) |
2.2 Description of the model system
A primary focus of this paper is the application of MPNPE solver to nanopores, wherein we compute the ionic current through a pore in a solid-state membrane. The domain we consider is depicted in Fig. 2(a). Here, solution reservoirs above and below the membrane are connected through a nanopore, allowing positive and negative ions to pass from one side of the membrane to the other. We also consider a system where a DNA molecule is present inside the pore. Thus, the membrane (and the DNA, if present) comprise the domain Ωm, whereas the ionic solution, which consists of the solution reservoirs above and below the membranes and the nanopore, comprise the domain Ωs.
With the concentration profiles of (2.4), one important quantity is the ionic current J through a surface G with normal n (see Fig. 2(b)), which is defined as
| (2.6) |
For example, in the 2D cross-section of the problem domain shown in Fig. 2(b), we measure the ionic current through the plane in the middle of the pore, denoted by a dotted line.
The Poisson portion of the PNPE in (2.2) is solved with Dirichlet boundary conditions specified by ϕt and ϕb at the top and the bottom of the domain, and periodic boundary conditions along the other four sides. Further, the (unmodified and modified) Nernst-Planck equations in (2.1) and (2.3) use blocking boundary conditions on the interface of the membrane and the ionic solution, which is denoted ∂Ωs,n and is displayed with a dotted line in Fig. 2(b), while periodic boundary conditions are set at the remaining boundaries. Specifically, we consider blocking boundary conditions of the form
| (2.7) |
where n is the unit normal on the surface ∂Ωs,n. One consequence of the blocking boundary conditions is that the integral of the concentration remains constant. That is, the total number of ions of each ion species is conserved:
| (2.8) |
Additionally, the number of ions in the domain is also conserved in the case of a partially periodic boundary. Moreover, we note that the numerical methods we develop are equally applicable for other boundary conditions, like Dirichlet boundary conditions for the concentrations.
3 Numerical methods
In this section we describe a numerical approach to solving the MPNPE. For the modified Nernst-Planck equations, we use the finite element method for spatial discretization, and backward Euler for time discretization due to the stiff nature of the solutions. Similarly, we also use a finite element discretization for solving the Poisson's equation. Our approach is used to solve for both the transient and steady state solutions. If the goal of the simulation is the steady state, then we evolve the solution until the measured temporal change reaches a desired tolerance.
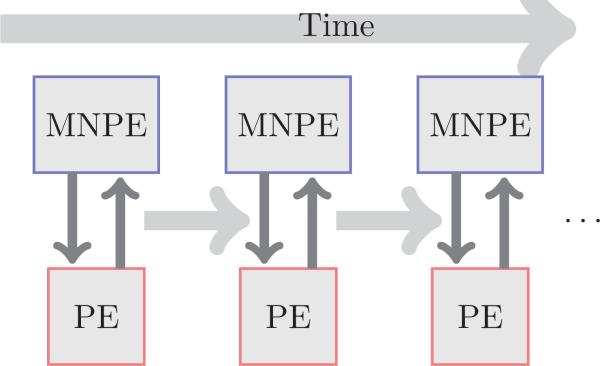
We have slightly different schemes for the transient and steady state solutions. For the transient solution, where accuracy at each time step is important, we solve the (2.3) and the (2.2) in a self-consistent manner, employing a Gummel iteration. That is, at each time step, given some initial concentrations c± and electrostatic potential ϕ, we solve (2.3) using the finite element method. The updated values of the concentrations are then used to solve (2.2), and this process is repeated until convergence. Then we move on to the next time step. This is illustrated in Fig. 3.
Figure 3.
Overview of the numerical scheme. At each time step, we iterate between the solves for the modified Nernst-Planck equations and the Poisson equation.
For the steady state method, at each time step, we solve the (2.3), with the updated values of the concentration used in the solution of (2.2). However, further iteration is not needed and the updated value of the electric potential is immediately used as input to (2.3) for the next time step. The steady state method corresponds to employing one iteration in the Gummel iteration — i.e., we do not iterate to convergence at each time step. This process works well in practice since the primary purpose of the steady state solution are the final concentrations and is similar to previous strategies in the setting of the PNPE and MPNPE [28, 35, 36]. However, our scheme has two distinct features: 1) it uses a stabilized method, and 2) it accounts for the conservation of ions. We now proceed to describe our method in more detail (the approach is implemented in the finite element package Dolfin [37]). In the following we devise two finite element methods: one for the case in which there is only an electric field, and one in which a non-electric potential is also applied. We seek to highlight the benefits of incorporating the steric effects into the modified Nernst-Planck equations. Hence we derive our finite element method for both PNPE and MPNPE, highlighting several important differences. Themethodswe propose are used further when we devise a method for solving the MPNPE in the presence of an applied non-electrostatic potential.
3.1 Non-linear finite element method for modified Nernst-Planck equations
For the (modified) Nernst-Planck equations, we seek a solution in H1(Ωs) × H1(Ωs) for c±, where H1 is a Sobolev space with standard notation [38]. The weak form of (2.4) (which represents both (2.1) and (2.3)) is found by integrating against a test function v± = (v+,v–) ∈ [H1(Ωs)]2 : find c± ∈ [H1(Ωs)]2 such that
| (3.1a) |
| (3.1b) |
for all v±in[H1(Ωs)]2. Note that we used integration by parts along with the blocking and periodic boundary conditions to derive (3.1b) from (3.1a). From this, we apply the backward Euler method in time to (3.1b) and multiply by Dt to arrive at
| (3.2) |
for all v± ∈ [H1(Ωs)]2. Here, are the concentrations at time step k, while Δt is the length of the time step.
For the PNPE, (3.2) is a pair of uncoupled equations, linear in the unknown variables c±. For the MPNPE, (3.2) is a pair of coupled non-linear equations, and hence result in a more complicated form than PNPE. To address the nonlinearity, we use a straightforward application of Newton's method to find the concentrations c± for the MPNPE. Specifically, we define the form in (3.2) as :
| (3.3) |
Here we again use the α notation to write the weak form for both the NP and MNP equations.
The MNPE in (3.3) are nonlinear in c± and linear in v±. The first step in a Newton's method is to linearize this form with respect to c±, to arrive at a bilinear form in w± and v±. This is accomplished by taking a variational derivative of with respect to ,
| (3.4) |
where
| (3.5) |
As a consequence, with α=0 for PNPE, the derivative DN0 is absent from (3.4).
With the derivative defined, we arrive at Newton's method, which first computes w± by solving
| (3.6) |
followed by the estimate of with
| (3.7) |
Solving the weak problem in (3.6) reduces to a linear system of the form Aw = f , where stiffness matrix A is formed by , the force vector f by , and where w represents the unknown coefficients for the function w±.
In the case of the NP equations, with α = 0, the form DFα in (3.6) does not depend on , and the Newton's method converges in one iteration (as we expect for linear problems). For simplicity, we drop the arguments to the forms DFα and Fα. Then DF0 and DF1 represent the forms in (3.4). Similarly F0 and F1 are the forms for NP and MMP in (3.3). The relationship between these forms is expressed as,
| (3.8) |
| (3.9) |
which allows us to view the Newton step for MNP as,
| (3.10) |
From this equation, we notice that the Newton step for the MPNPE is exactly the Newton step for the PNPE with the addition of stabilizing terms DN1(c±) and N1(c±)·∇v±.
3.2 A stabilized finite element method for the modified Nernst Planck equations
The discretization scheme we have developed so far works well if there is no strong electrostatic potential (represented as ϕ) or applied non-electrostatic potential (i.e. U = 0). However, in the presence of a strong electorstatic potential or non-electrostatic applied potential, the Nernst-Planck equations have a large drift term, which is a challenge to standard Galerkin methods. Using the standard Galerkin approach results in a solution with spurious values [39] — e.g. the concentration becomes negative in portions of the domain, as illustrated earlier in Fig. 1 for the nanopore system. We see that the concentration becomes negative in parts of the domain. One remedy is to augment the Galerkin weak form by adding artificial dissipative terms to stabilize the method. To this end, we use a variant of streamline upwind Petrov-Galerkin method (SUPG) for stabilizing our scheme in presence of steep gradients in ϕ or U [40, 41].
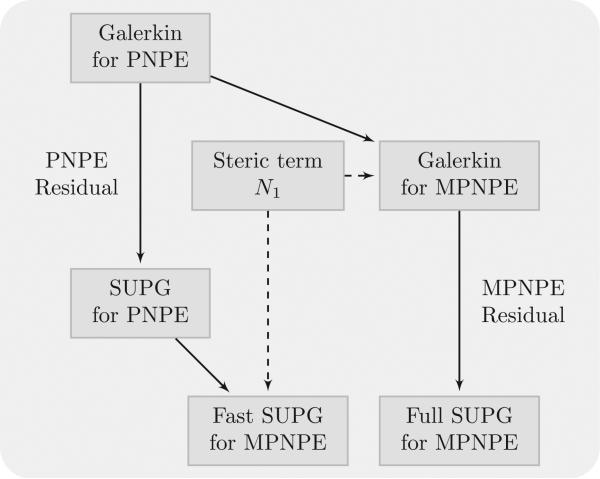
We develop stabilized schemes for both the PNPE and the MPNPE. We develop two such schemes for the MPNPE. One arises from a standard application of SUPG to the MPNPE, whereas the other is developed by adding the nonlinear terms of the MPNPE to the SUPG scheme for the PNPE. The latter scheme, which we call “Fast SUPG” improves on the former, called the “Full SUPG” scheme, by increasing its computational efficiency, as we explain later. We use the “Fast SUPG” method in this paper, unless noted. The relationship between different SUPG schemes is shown in Fig. 4.
Figure 4.
Relationship between SUPG methods.
To simplify the presentation of our SUPG scheme, we introduce some notation. The differential operator is given as
| (3.11) |
which consists of a flow field governed by the applied potential V± and denoted by
| (3.12) |
We also isolate the Péclet number Pe with a stability parameter of the form
| (3.13) |
where hτ denotes the diameter of the element τ, and with
| (3.14) |
The Péclet number of element τ, denoted as Peτ is an indication of the strength of advection. Specifically, a Péclet number greater than 1.0 indicates that advection is dominating the flow and that stabilization may be necessary, and we use the values developed in [39, 42].
Using the above notation, we write (3.1a) as,
| (3.15) |
From this, we define the SUPG weak form using integration-by-parts similar to the derivation in (3.1a), to arrive
| (3.16) |
where the test functions in stabilized form are
| (3.17) |
For the PNPE, (3.16) is solved as a pair of uncoupled equations. However, for the MPNPE, we use a nonlinear solver, as discussed in the previous section. The nonlinear SUPG scheme is similar to the approach taken in [43] for use with nonlinear Navier-Stokes equations. The convergence rate of the L2 error for the SUPG scheme is typically half an order less than the Galerkin method [44]. That is, the convergence rate of the L2 error is for the SUPG scheme, and for the Galerkin method, where k refers to the polynomial degree of the approximating space. However, the benefit of the SUPG method lies in its stability properties. The stability of the SUPG method yields a physically meaningful solution as compared to the Galerkin method, even for coarse meshes.
A faster SUPG scheme for MPNPE
The SUPG method arising from (3.16) stabilizes the MPNPE, however it is costly to implement. This cost arises because of the presence of the strong form of the operator in the “stabilization” part of (3.16) — i.e., we do not use integration by parts. Thus, one of the terms in the weak form 〈F1,supg(c±),v±〉 is ∇·N1(c±), which is lengthy, and is costly to evaluate. Moreover, in Newton's method, the variational derivative of this term is needed, which makes the implementation even costlier. By considering a Newton's method for the SUPG method for NPE we are able to derive a more efficient scheme for the modified form of the equations. To further motivate this, consider the Newton step for the Galerkin method for MPNPE, as given in (3.10). We observe that the Newton step for MPNPE in (3.10) is the Newton step for PNPE along with additional stabilization terms. Thus, we take a similar view in designing the faster SUPG method for MPNPE: first we form the Newton step for the SUPG method for the PNPE followed by the addition of stabilization terms. As before, to formtheNewton step for NPE,we take the variational derivative of the form F0,supg to arrive at the form 〈DF0,supg(c±),w±,v±〉. The Newton iteration for the SUPG method for the NPE is then to find functions w±[H1(Ωs)]2 such that
| (3.18) |
From w±, we then update using (3.7): .
As in the previous case, for the unmodified form of the NPE, Newton's method reduces to one iteration. For the MNPE however, we add additional terms present in Newton's method for the Galerkin method in (3.10), namely DN1(c±) and N1(c±)·∇v±, to (3.18). As a result, the SUPG method for the MNPE is defined by the following Newton's step,
| (3.19) |
We use the SUPG form in (3.19) in our numerical tests in Section 4.
3.3 Galerkin method for Poisson equation
A stabilized scheme is unnecessary for the Poisson portion of the PNPE in (2.2). Thus, we use a standard Galerkin finite element method which is stated as the following: find such that,
| (3.20) |
for all and where ϕd is a function satisfying Dirichlet boundary conditions.
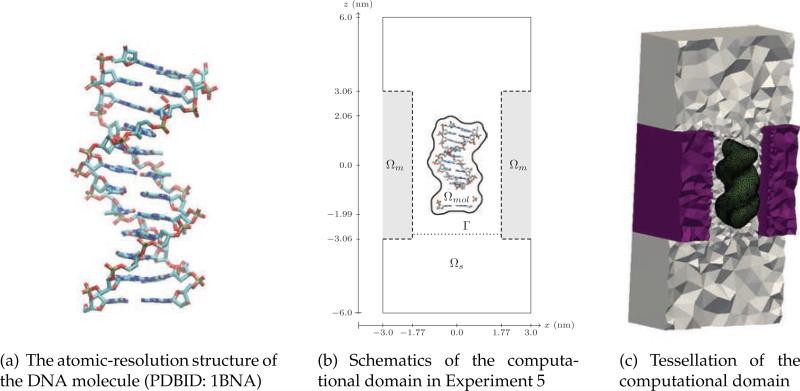
The situation is more complicated in the presence of a biomolecule, such as a DNA molecule. In this case, we have an additional region, Ωmol which contains a biomolecule inside the pore, as illustrated in Fig. 17(b). The solvent-ions are excluded from the region Ωmol. The biomolecule contains a distribution of singular charges,
| (3.21) |
Here ρf denotes the charge distribution, δ(x–xi) is the Dirac delta function based at the location xi representing a charge qi. Consequently, we modify the Poisson's equation (2.2) as,
| (3.22) |
where χs is the characteristic function of the solvent domain, Ωs, that is, χs = 1 inside Ωs and χs = 0 everywhere else. The presence of singular charge distribution ρf makes the design of a convergent finite element method for the Poisson's equation a challenge, as the source term is no longer in H–1(Ω), the dual space of . To rectify this, two term and three term decompositions of the potential have been proposed [34,45–50]. We use the three term decomposition, which is numerically more accurate [49, 50]. In this formulation, potential ϕ in (3.22) is written as sum of a singular component ϕs, a harmonic component ϕh and a regular component ϕr as,
| (3.23) |
The singular component, ϕs, is the solution to,
| (3.24) |
where εmol is the dielectric coefficient for the molecular region. We observe that ϕs is the Green's function for the Laplace operator, and is computed analytically. The harmonic component ϕh is defined by,
| (3.25) |
| (3.26) |
where ∂Ωmol is the boundary of the region Ωmol. Substituting (3.23) in (3.22) leads to the following equation for the regularized potential,
| (3.27) |
| (3.28) |
Here n is the unit normal at the molecular surface ∂Ωmol and [[·]] denotes the jump across the molecular surface,
| (3.29) |
In our numerical simulations, we precompute (3.25), and then use (3.27) at each time step for computing the potential ϕ. Similar to (3.20), our new weak form of the Poisson equation is,
| (3.30) |
where
| (3.31) |
Figure 17.
Structure (a), setup (b) and mesh (c) of the DNA dodecamer system used in Experiment 5. The ionic current is measured across the circular cross-section of the nanopore denoted as G in panel (b). Note the fine mesh representing the atomic features of the DNA molecule in panel (c).
(a) The atomic-resolution structure of the DNA molecule (PDBID: 1BNA)
(b) Schematics of the computational domain in Experiment 5
(c) Tessellation of the computational domain
4 Numerical experiments
In this section we illustrate the use of our finite element method through five numerical experiments. The first experiment examines the steric effects in an electrolyte solution confined between two charged plates. Then, we apply our method to compute the ionic current through a nanopore in a solid-state membrane in the absence of a nonelectrostatic potential and a DNA molecule. We follow with a third experiment in which we introduce a non-electrostatic potential into the ionic current calculations, mimicking the effect of a realistic nanopore surface or a biomolecule. This system highlights the significant difference between MPNPE and PNPE calculations. Finally, in Experiments 4 and 5, we examine the steric effects in the nanopore system when a DNA molecule is present in the nanopore. As the process of DNA translocation occurs much slower then ion transport, one can assume DNA to remain at the same location in the pore during the calculation of the ionic current [20].
We employ continuous piecewise linear functions to represent the concentrations, c+ and c–, and the potential, ϕ, in all our numerical experiments. The piecewise linear functions are available in all common finite element packages (e.g. [37]) and are computationally less expensive than higher degree polynomial spaces.
For the steady state experiments, we evolve an initial uniform concentration until the temporal change in the concentration is less than a fixed tolerance. More specifically, the temporal change is measured as
| (4.1) |
where N is the number of nodes in the mesh, and n refers to the temporal time step. For example, in the case of the nanopore in Experiments 2, 3, 4 and 5, a tolerance of θ =10–2 is used. With a tolerance of 10–2, the computations remain generally static and are representative of the final steady state. Higher concentrations demand increased resolution and thus require more time steps, as shown in Table 1.
Table 1.
Number of temporal iterations to reach steady state. Experiments 2 and 3 examine the flow of ions through a nanopore.
| Experiment: | #2 | #3 | |||
|---|---|---|---|---|---|
| Concentration (c+): | 0.1082M | 1.623M | 2.705M | 1.623M | 2.705M |
| PNPE | 17 | 50 | 125 | 74 | 149 |
| MPNPE | 17 | 50 | 116 | 120 | 155 |
One of the goals of our numerical experiments is to highlight the utility of using the modified form of the equations. To this end, we present the sum of concentrations — i.e. c = c++c– — to illustrate the behavior of the solutions with respect to the steric limit of the problem.
Choice of the effective ion size parameter a
Finding an optimal value for the effective ion size parameter a is not the focus of this work. Interested readers are directed to a detailed discussion of the subject [35, 51]. In this work, we used several values of parameter a to demonstrate the robustness of our finite element solver. Thus, in computational Experiment 1, we use a = 0.66 nm for both K+ and Cl– ions [51]. In computational Experiments 2, and 3, we use a=0.3 nm to achieve the best quantitative agreement with the results of Brownian dynamics simulations [24] (see also Section A.1). In computational Experiments 4 and 5, we set parameter a to 0.5 and 0.55 nm to describe nanopore systems containing a charged sphere (Experiment 4) and a double helix of DNA (Experiment 5), respectively, matching the ion size to the closest distance between the object and the wall of the nanopore. It is important to note that our numerical methods for MPNPE are valid for a range of (realistic) ion sizes, and the specific selection of effective ion size is not the focus of our method nor necessary for its analysis.
Validation of the fast SUPG scheme
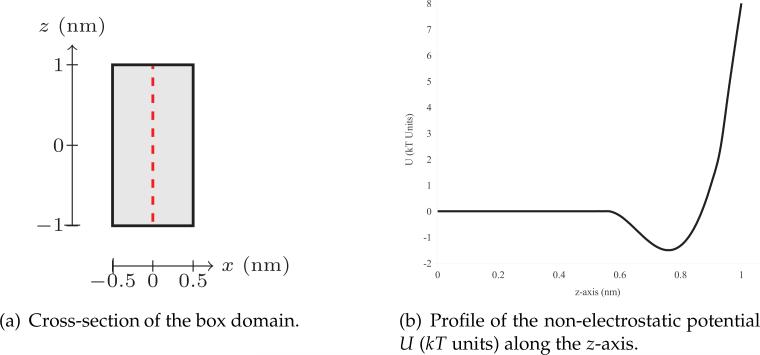
First, we verify that our fast SUPG scheme (3.19) results in solutions similar to that of the full SUPG scheme (3.16). Toward this end, we perform computational experiments on a box domain of dimensions 1 nm × 1 nm × 2 nm subject to a non-electrostatic potential U. The cross-section of the box domain is shown in Fig. 5(a). The profile of this potential U along the z-axis is shown in Fig. 5(b). Since no external electrostatic potential is applied, the system converges rapidly to a steady state. Using a tolerance of 10–5 for the temporal change of concentration, these numerical experiments generally required fewer than 10 iterations to converge to a steady state.
Figure 5.
Cross-section of the box domain (left) and the profile of non-electrostatic potential (right).
(a) Cross-section of the box domain.
(b) Profile of the non-electrostatic potential U (kT units) along the z-axis.
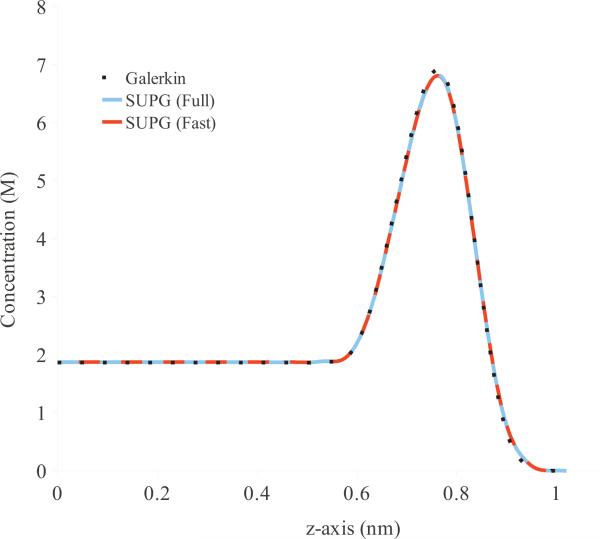
In Fig. 6, we plot the average concentration of positively-charged ions along the z-axis of the box domain computed using the standard Galerkin, full SUPG, and our fast SUPG schemes. The overall concentration of ions in the box domain was equivalent to having 3 ions of each species. For these calculations, we use a mesh fine enough to ensure that the standard Galerkin method results in accurate solution. For a more realistic computational domain, this resolution presents a significant limitation as it considerably decreases the computational efficiency of the continuum model. The close agreement between the profiles indicates that our fast SUPG scheme computes the concentrations to the same accuracy as the more computationally expensive methods. Hence, we use our fast SUPG scheme for all calculations reported in the remainder of the paper.
Figure 6.
Profile of steady-state concentration c+ for di erent numerical schemes for MPNPE for the box domain.
Next, we demonstrate that using our fast SUPG scheme results in significant savings of the computational effort. Table 2 lists the speedup of the fast scheme in comparison with the full scheme when applied to the box and nanopore domains (the nanopore domain is described in Experiment 2 later in the text). Using the fast scheme speeds up the solution process more than twofold in the case of the nanopore domain, and by more than a factor of 4 in the case of the box domain.
Table 2.
Speedup of the fast SUPG scheme versus the full SUPG scheme
| System | Box - 3 ions | Box - 4 ions | Nanopore - 60 ions |
|---|---|---|---|
| Speedup | 4.47 | 4.40 | 2.26 |
Experiment 1: Ionic solution between two charged plates
In this experiment, we consider a 1 nm×1 nm×4 nm parallelepiped domain placed between two charged plates, as shown in Fig. 7. At the beginning of the numerical experiments, the concentration of ions is uniform in the solvent domain. We solve the PNPE and the MPNPE for the concentration of ions in the presence of an electrostatic potential difference between the plates. Specifically, the upper plate is set at a potential of –800 mV and the lower plate at +800mv, leading to a total potential difference of –1600 mV (see Fig. 7). In these calculations, we use blocking boundary conditions for the ionic concentrations throughout the domain.
Figure 7.
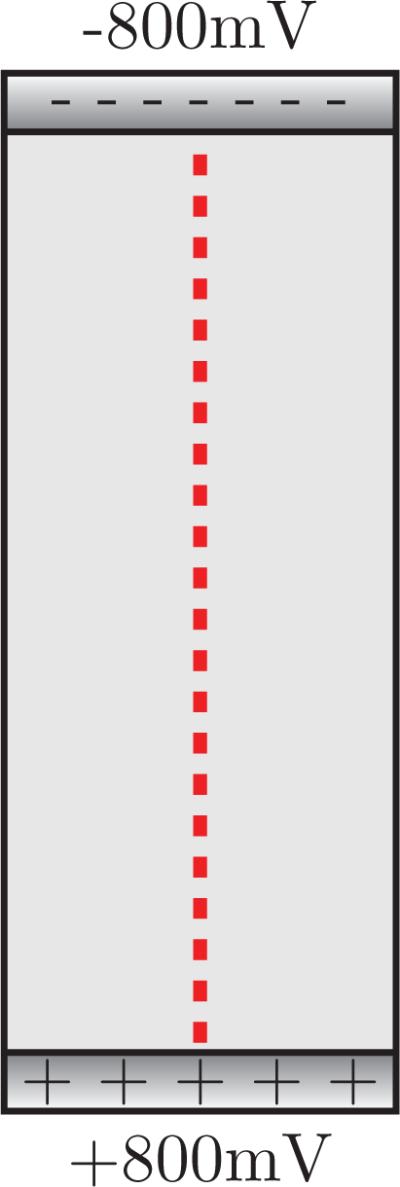
Cross-section of the parallel plates domain considered in Experiment 1.
The parameters used for this numerical experiment are listed in Table 3. Specifically, an ion size parameter a of 0.66 nm was used as an effective diameter of K+ or Cl+ ions, which is larger than the actual ion size. Such an approximation was previously shown to work specifically well in the case of high charge densities [51].
Table 3.
Summary of parameters used in Experiment 1.
| Name | Symbol | Value |
|---|---|---|
| Time step | Δ t | 10–13 s |
| Diffusivity for positive ions | D + | 2.27×10⁻⁹ m2/s |
| Diffusivity for negative ions | D – | 2.27×10⁻⁹ m2/s |
| Relative permittivity | ε | 92 |
| Ion diameter | a | 0.66 nm |
| Initial concentration | c init | 1 M |
| Potential drop | ϕtop – ϕbottom | –1600 mV |
| Steric limit | ψ | 5.776 M |
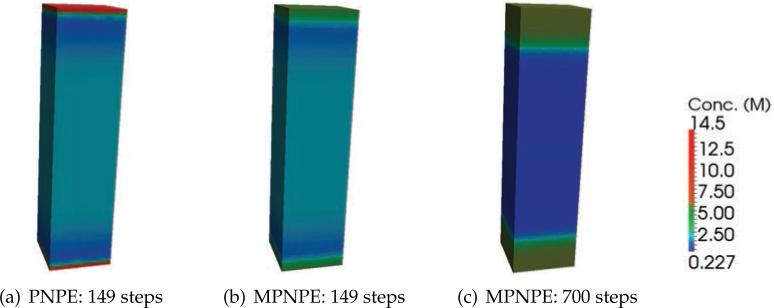
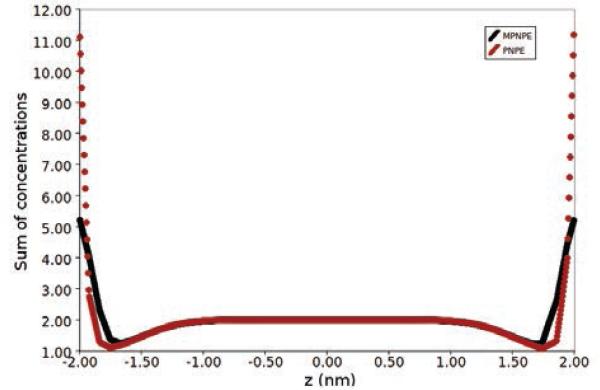
From Figs. 8(a) and 8(b), which show 2-D cross-sections of the concentration after 149 times steps of the simulation, we see that the steric limit is violated in the case of PNPE (colored red in the figure), but that the concentration remains appropriately bounded in the case of MPNPE (Fig. 8(c)), even after 700 iterations. Furthermore, Fig. 9 shows that the local sum of the concentrations along the z-axis of the domain is unrealistically high in the case of the PNPE, whereas the sum for the MPNPE remains bounded and within steric limit. Computationally, we also observe that consecutive approximations to the PNPE are increasingly difficult to compute as the simulation progresses due to the sharp gradients, whereas approximations to solutions of the MPNPE maintain a more subtle profile.
Figure 8.
The sum of concentrations c= c++c– for the PNPE and the MPNPE in Experiment 1.
(a) PNPE: 149 steps
(b) MPNPE: 149 steps
(c) MPNPE: 700 steps
Figure 9.
Comparison of the solutions of PNPE and MPNPE for the parallel plates domain system in Experiment 1. The local sum of positive and negative ion concentrations is plotted along the z-axis. A red hue indicates a violation of the steric limit.
Experiment 2: Ionic current through a nanopore in the membrane
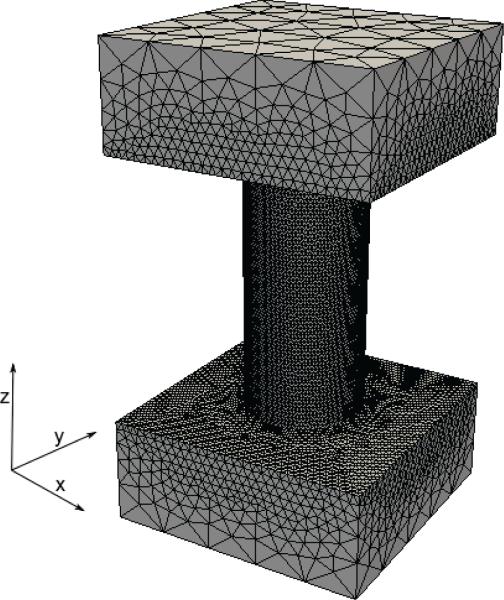
In this experiment, our aim is to accurately compute the current through a nanopore in a membrane. The system setup is shown in Fig. 2(b). A three-dimensional view of the solvent domain Ωs is given in Fig. 10, where the dimensions of the full domain, are 4 nm × 4 nm × 7.2 nm, whereas the length of the pore (modeled as a cylinder) is 4 nm with a radius of 0.9 nm. We summarize additional parameters for this experiment in Table 4.
Figure 10.
Three-dimensional solvent domain, Ωs, and an example of domain's tessellation. This domain is used in Experiments 2 and 3.
Table 4.
Summary of parameters used in Experiment 2.
| Name | Symbol | Value |
|---|---|---|
| Diffusivity for positive ions | D + | 2.27×10⁻⁹ m2/s |
| Diffusivity for negative ions | D – | 2.41×10⁻⁹ m2/s |
| Relative permittivity of membrane | ε m | 92 |
| Relative permittivity of solvent | ε s | 92 |
| Ion diameter | a | 0.3 nm |
| Potential drop | ϕtop – ϕbottom | −180 mV |
| Temperature | T | 295 K |
Periodic boundary conditions are applied in all directions for the concentrations, except for the boundary of the pore, ∂Ws,n (see Fig. 2(b)), where blocking conditions are applied. For the potential, we enforce periodic conditions in the x and y directions, along with the Dirichlet conditions at the top and bottom of the domain. That is, the top of the domain is set at a potential of –90 mV and the bottom at +90 mV.
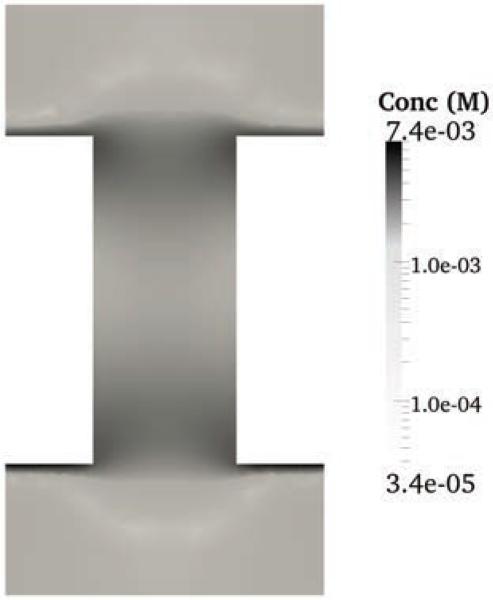
The ion size is taken to be the approximate size of the K+ or Cl– ions in the bulk [51]. In this setting, the PNPE do not exhibit steric effects. Consequently, we expect to see similar results for PNPE and MPNPE, which we examine by computing steady state concentration profiles and by computing the ionic currents. The difference between the steady state concentrations for the positively charged ions for a uniform initial concentration of 1.623 M computed by PNPE and MPNPE is shown in Fig. 11. The figure shows that both MPNPE and PNPE result in similar concentration profiles, with the majority of the differences appearing near the channel edges where the gradient is the largest.
Figure 11.
Di erence in approximating c+ for PNPE and MPNPE in Experiment 2.
For the calculation of the electric current (2.6), we consider a circular slice through the center of the channel which has a unit-normal vector pointing in the z-coordinate direction. The resulting ionic current values are computed using both MPNPE and PNPE and are listed in Table 5. As expected for ion concentrations below the steric limit, the ionic currents calculated by MPNPE closely match those of PNPE.
Table 5.
Nanopore ionic currents computed by solving PNPE and MPNPE.
| Concentration (M) | PNPE Current (pA) | MPNPE Current (pA) |
|---|---|---|
| 0.1082 | 198.10 | 198.00 |
| 1.623 | 2592.78 | 2590.12 |
| 2.705 | 4275.77 | 4272.34 |
Experiment 3: Ionic current through a nanopore in the presence of a non-electrostatic potential
Next, we consider calculation of the ionic current through the nanopore domain described in Figs. 2(b) and 10. In this experiment we apply a non-electrostatic potential at the boundary of the membrane and the solvent domains denoted ∂Ωs,n. The dimensions of the domain and parameters for the experiment are the same as specified in Table 4 for Experiment 2, with the exception of the diffusivities D+ and D–, which are used for the computation of the ionic currents. The diffusivities are obtained from the BD simulations with the same setup [24], and are listed in Table 6.
Table 6.
Diffusivities used for the calculations of ionic current values reported in Table 7.
| Atoms | D+ (m2/s) | D– (m2/s) |
|---|---|---|
| 60 | 1.90584 | 1.96144 |
| 100 | 1.71593 | 1.72708 |
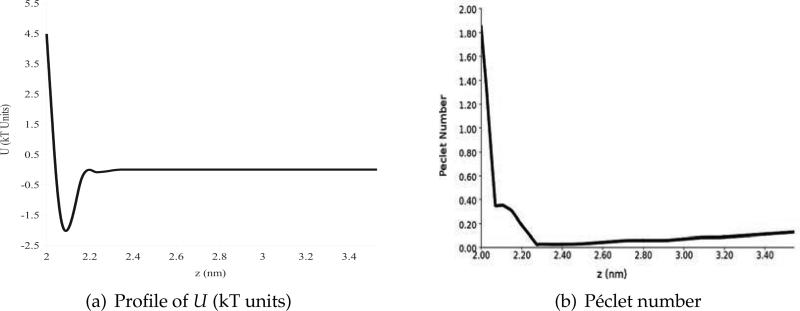
Fig. 12(a) illustrates the variation of the non-electrostatic potential U across the nanopore wall, which is located around z = 2 nm in this plot. The non-electrostatic potential applied here was designed as model of a silica surface and was designed to mimic the free energy of the ions as function of distance from the surface observed in molecular dynamics (MD) simulations [24]. It has the essential features of van der Waals interaction: an attractive well and a repulsive wall. Such external potentials have been used in MD simulations to represent such synthetic surfaces [24, 52]. The sharp gradient of the potentials near the wall makes the traditional Galerkin method unstable, so we have to apply our stabilized SUPG method to arrive at the solution. To illustrate the instability in the Galerkin method, the variation of the element-wise Péclet number (defined in Section 3.2) across the nanopore wall is shown in Fig. 12(b). Near the pore surface, the Péclet number surpasses a value of 1.0, indicating likely instabilities in the Galerkin method (see Section 3.2).
Figure 12.
Profiles of the non-electrostatic potential U (left) and the Péclet number (right) for the system investigated in Experiment 3. The schematics of the system is shown in Fig. 2(b). Both profiles were computed along a line parallel to the z-axis and passing through x = y = 1.5 nm. In these profiles, the surface of the nanopore, which separates the solvent region from the membrane, is located at z = 2 nm. The sharp repulsive gradients in the potential U cause spurious modes in the Galerkin approximation.
(a) Profile of U (kT units)
(b) Péclet number
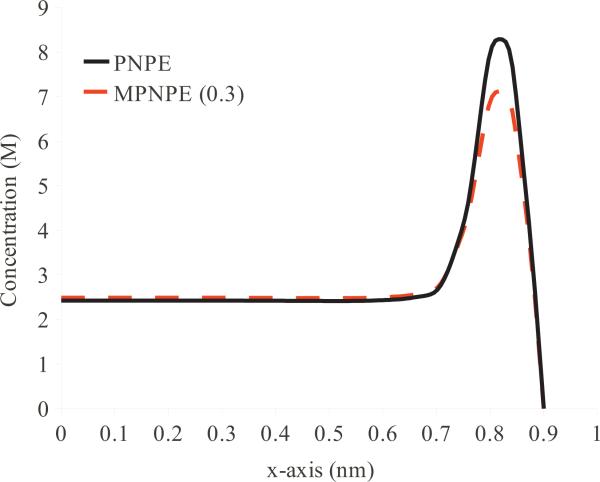
For the computation of the ionic current through the nanopore, we use systems containing 60 and 100 ions, which correspond to the uniform initial concentrations of 1623.26 and 2705.43 mM for each ion species. Fig. 13 shows representative concentration profiles of positively-charged ions, c+, for the steady-state solutions of PNPE and MPNPE. Because the MPNPE formulation takes into account steric interactions between the ions, the MPNPE solution generally shows lower ion concentration in the regions of large potential gradients when compared to the PNPE solution.
Figure 13.
Concentration of positively charged ions (c+) along the x-axis (at y, z = 0 nm) in the nanopore system (Fig. 2(b)) computed in the presence of the non-electric potential (Experiment 3). The overall ion concentration is equivalent to the presence of 100 ions in the solvent domain.
Furthermore, Table 7 show that the ionic currents computed using PNPE and MPNPE are lower in the case of MPNPE. It is important to note that the current calculations are insensitive to small variations in the concentration since the form of the current calculation is an integral. Thus, while the difference in the PNPE and MPNPE current calculations are only around 2%, this represents a significant deviation in the concentration (see Fig. 13). The ionic currents predicted by both PNPE and MPNPE are in reasonable agreement with the results of the BD simulations.
Table 7.
Nanopore ionic currents computed using BD, PNPE and MPNPE.
| Atoms | Concentration (M) | BD Current (pA) | PNPE Current (pA) | MPNPE Current (pA) |
|---|---|---|---|---|
| 60 | 1.623 | 2170±9 | 2421.54 | 2396.30 |
| 100 | 2.705 | 2960±18 | 3575.12 | 3514.29 |
Experiment 4: A nanopore containing a charged, spherical biomolecule
In this computational experiment, we model the presence of a biomolecule in a nanopore using a uniformly charged sphere (see Fig. 14). A charge of 8 electron units is assigned to reside in the center of the sphere. The volume occupied by the sphere is excluded from the solvent domain and the non-electrostatic potential U is set to zero throughout the system. Periodic boundary conditions are applied in all directions for the concentrations, except for the boundary of the pore (∂Ωs,n) and the molecular surface (∂Ωmol), where blocking conditions are applied. For the potential, we enforce periodic conditions in the x and y directions, along with Dirichlet conditions at the top and bottom of the domain. That is, the top of the domain was set at a potential of -90 mV and the bottom at +90 mV.
Figure 14.
Setup of Experiment 4. A spherical, charged biomolecule is placed inside a nanopore. The radius of the sphere is 0.5 nm. The figure shows a 2D cross-section of the 3D domain.
In our experiments, we compare the concentration profiles obtained from the Galerkin and SUPG method for the PNPE and the SUPG solution for the MPNPE. The charge inside the biomolecule is handled numerically as described in Section 3.3.
In these experiments, we consider a system containing 10 positively-charged ions, and 18 negatively-charged ions, which correspond to uniform initial concentrations of 0.102 and 0.184 M respectively, leading to an electrically neutral system. The relative permittivity of the spherical molecule, the solvent, and the membrane are εmol =2, εs =78 and εm = 4. The diffusivities of the ions are set to be D+ = D– = 2.27×10⁻⁹ m2/s, which are typical values associated with a nanopore system. Finally, a potential drop of 180 mV is applied across the system in the z direction, and the ion size parameter, a, is chosen to be 0.5 nm, which is the nearest distance between the surface of the biomolecule and the surface of the nanopore.
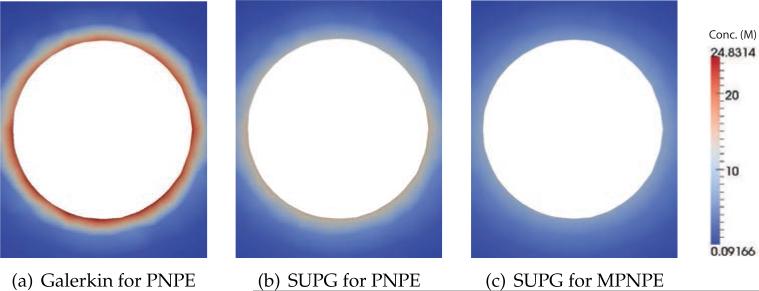
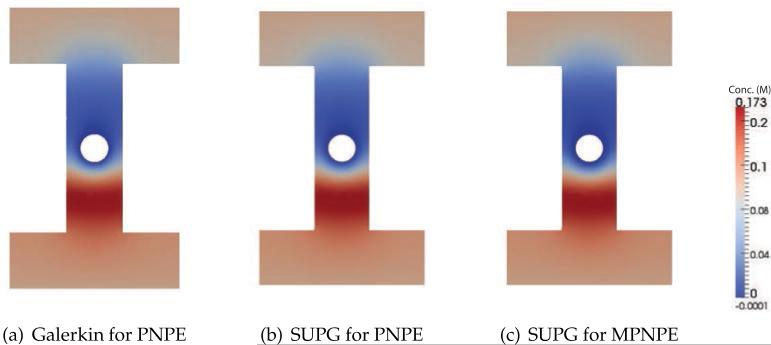
Figs. 15 and 16 show the resulting steady-state concentration profiles obtained by using the standard Galerkin method for the PNPE, the SUPG method for the PNPE and the SUPG method for MPNPE. Fig. 15 illustrates the local concentration of negatively-charged ions near the charged sphere. The PNPE solution exhibits very high local concentrations of ions near the surface of the sphere (a maximum of 27.9 M), whereas the maximum concentration within the MPNPE solution is considerably less (a maximum of 9.3 M). Fig. 16 illustrates the local concentration of positively-charged ions. The Galerkin solution of the PNPE features negative concentration values (a minimum of –0.0003 M), whereas the SUPG solutions for both PNPE and MPNPE do not have this artifact.
Figure 15.
Comparison of numerical solutions for a charged sphere/nanopore system (Experiment 4). The 2D density plots show the local concentration of negatively-charged ions near a spherical biomolecule (within the yz plane, see Fig. 14).
(a) Galerkin for PNPE
(b) SUPG for PNPE
(c) SUPG for MPNPE
Figure 16.
Comparison of numerical solutions for a charged sphere/nanopore system (Experiment 4). The 2D density plots show the local concentration of positively-charged ions within the yz plane of the system.
(a) Galerkin for PNPE
(b) SUPG for PNPE
(c) SUPG for MPNPE
Experiment 5: Ionic current through a nanopore containing a 12-basepair DNA duplex
In our final experiment, we demonstrate the capability of our solver by considering a nanopore system that contains a 12-basepair DNA molecule. The atomic-resolution structure of a double-helical dodecamer in the canonical B-DNA form [53] is obtained from the Protein Data Bank [54] (PDBID: 1BNA), see Fig. 17(a). The partial charges on the DNA atoms are obtained by converting the PDB file to the PQR format using PDB2PQR [55,56]. This PQR file is also used to generate the surface mesh using GAMer [57] followed by the full volumetric mesh through Gmsh [58]. The point charges inside the biomolecule are handled numerically as described in Section 3.3.
First, we discuss our results for a system containing 343 negatively-charged ions, which corresponds to a uniform initial concentration of 0.813 M. In our experiments with the DNA dodecamer, we always add 22 additional positively-charged ions to maintain electroneutrality (which corresponds an increase in the uniform initial concentration of 0.052 M). As in Experiment 4, we use the following parameters: εmol=2, εs=78 and εm=4, and D+=D–=2.27×10⁻⁹ m2/s. A potential drop of 180 mV is applied across the system along the z axis. The ion size parameter, a, is chosen to be 0.55 nm, which the smallest distance between the surface of the DNA and the surface of the nanopore. The volume occupied by the DNA was excluded from the solvent domain and the non-electrostatic potential U was set to zero throughout the system. Periodic boundary conditions were applied in all directions for all concentrations, except at the boundary of the pore (∂Ωs,n) and the molecular surface (∂Ωmol), where blocking conditions were applied. For the potential, we enforced periodic conditions in the x and y directions, along with the Dirichlet conditions at the top and bottom of the domain. That is, the top of the domain was set at a potential of –90 mV and the bottom at +90 mV.
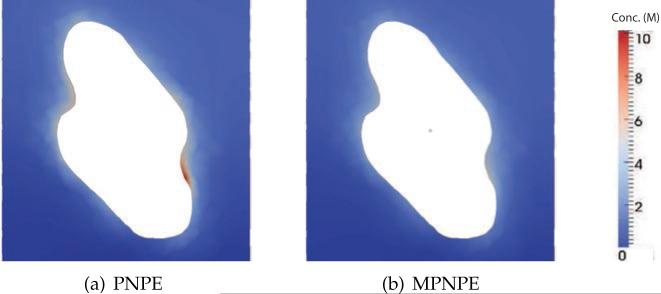
Fig. 18 shows 2D cross-sections of the total ion concentration, c=c++c–, in the steady-state solutions to the PNPE and MPNPE. In these calculations, we do not use the stabilized method as neither PNPE nor MPNPE develop solutions that feature negative concentration values. If compared to the MPNPE solution, the PNPE solution exhibits higher ion concentrations near the DNA surface. However, we do not observe a significant difference between the ionic currents: 3622.81 pA for PNPE and 3560.6 pA for MPNPE. This not uncommon since the current is an integral over a nanopore cross-section, so the difference in the local ion concentration near the DNA surface does not considerably alter the total current.
Figure 18.
The sum of ionic concentrations, c=c++c– near the DNA surface (Experiment 5). The 2D plot of ion concentration (in molar) is computed along the xz plane at y=0.8 nm, see Fig. 17(b).
(a) PNPE
(b) MPNPE
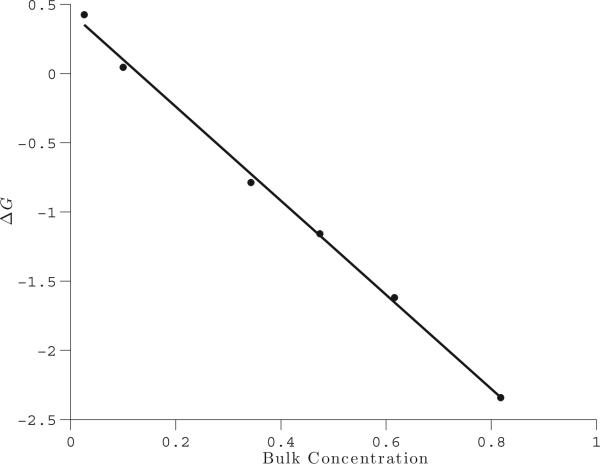
Finally, we compute the current through the nanopore in the presence and absence of the DNA molecule for several values of the ion concentration. Specifically, we perform four experiments using 10, 43, 140, 200, 260 and 343 negatively-charged ions, which correspond to the uniform initial concentration of 0.024, 0.102, 0.339, 0.474, 0.616 and 0.813 M, respectively. In the absence of the DNA molecule, the number of positively-charged ions equals that of the negatively-charged ions.
We characterize the outcome of these experiments by computing the conductance blockade ΔG = (JnoDNA –JDNA)/Δϕ, where JnoDNA is the current measured in the absence of DNA, JDNA is the current measured in the presence of DNA, and Δϕ is the total potential drop in the system, which is 180 mV. We measure the current across a circular cross-section of the nanopore within the xy plane at z = –2.8 nm (denoted as G in Fig. 17(b)). The results for the MPNPE calculations are plotted in Fig. 19, where we plot bulk concentration against the conductance blockade. We identify the bulk concentration with the value of the steady state concentration of the negative ions at the top of the domain. The conductance blockade changes its sign (from positive to negative) as the ion concentration increases, which is a hallmark of the DNA translocation experiments (cf. Fig. 4(a) of [59]).
Figure 19.
The conductance blockade amplitude DG (nS) versus the bulk concentration (M) in the nanopore system (Experiment 5). The solid line is a linear least-squares fit of the data.
5 Conclusions
The modified Poisson-Nernst-Planck equations account for steric effects and lead to physically realistic results. In this paper we develop a finite element method for the MPNPE, with a focus on computing steady state concentrations. We achieve this by evolving the system forward in time, thus ensuring that the number of ions in the system remains conserved. The presence of a high potential gradient near the wall of the membrane causes instabilities in the Galerkin finite element method, which is indicated by high Péclet number. In response, we stabilize the solution by employing a SUPG-type finite element method. Initially our SUPG method augments the Galerkin weak form with a strong form residual. However, this strong form residual is expensive to evaluate for the MPNPE. Thus, we design a new SUPG method for the MPNPE which is derived from the relationship between the weak Galerkin forms of the PNPE and the MPNPE. We highlight our finite element solver for a variety of experiments, first showing the utility of MPNPE in the case of flow between two oppositely charged plates. We then consider the flow of ions through a nanopore, where we determine the ion size using BD simulations. Finally, we explore the flow of ions around a DNA molecule. Our results indicate that the MPNPE account for steric effects, and yield more physically meaningful solutions.
Acknowledgments
The research is supported in part by a fellowship from the Computational Science and Engineering program at the University of Illinois at Urbana-Champaign and by the Department of Energy (DE-SC0005304), in part by NSF DMR 09-55959, NIH R01-HG005115, NIH P41-RR005969 and NSF DMS 07-46676.
Appendix A: Brownian dynamics
As we use Brownian Dynamics (BD) [22] to provide reference particle-based simulations, we briefly describe this method here. A detailed description of our BD simulation model can be found in Refs. [23, 24].
The interaction between each pair of ions consists of a short-range portion, which is computed from all-atom molecular dynamics simulations, and a long-range Coulomb portion. The Coulomb portion is calculated using a uniform dielectric constant of 92 for the solvent, which is close the bulk value of the TIP3P water model used in the molecular dynamics simulations [60].
The short-range portion of the interaction is calculated by the weighted histogram analysis method [61] using the results of many umbrella sampling molecular dynamics simulations. The umbrella sampling molecular dynamics simulations are performed using NAMD [62] and the protocols that have been described previously [24], including a 1 fs timestep, particle-mesh Ewald electrostatics, and a Langevin thermostat with a damping constant of 0.2 ps–1. Interactions between the atoms of the systems (TIP3P water and ions) are calculated using the CHARMM force field [63], which includes the ions parameters for K+ and Cl– described in [64]. The simulation systems consist of a periodic box of water that measures 5.8×5.8×5.9 nm3 after equilibration at 1 atm of pressure.
From the position distributions of the ions in these simulations, the weighted histogram analysis method [61] yields radial potentials for K+–K+, K+–Cl–, and Cl+–Cl+ having 0.01 nm resolutions. These potentials include water-mediated effects and have a form similar to those used in [13]. The potentials are shifted to match the Coulomb energies at an ion separation of 1.4 nm. Beyond 1.4 nm, the Coulomb energies are used. To make comparison between the results of the BD simulations and continuum calculations easier, we did not explicitly consider the effect of induced charge at the interface of the membrane material and electrolyte [24, 65].
In the Brownian dynamics simulations, the stochastic equation of motion is integrated using a 10 fs timestep [13]. The interaction between all pairs of ions is computed by cubic interpolation of the potentials constructed above, and the diffusivities are the same as those used in the continuum models. The potential energy due to the pore U is imparted by cubic interpolation from a uniform grid having a 0.03 nm resolution [66]. The exact shape of the potential used to model the pore wall is shown in Fig. 12(a).
A.1 The effect of ion size
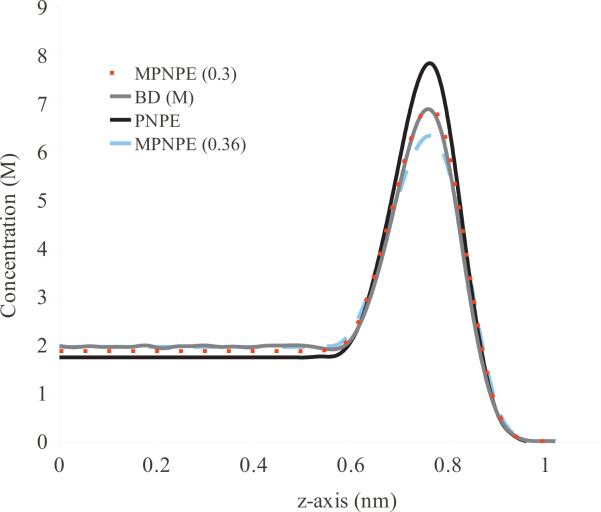
Here, we compare the results of our continuum calculations for the box domain described in Section 4 with the BD simulations of this system, which explicitly captures the effects of ion-ion interactions. The steady state concentrations obtained from BD, PNPE, and MPNPE are illustrated in Fig. 20, for the system containing 3 K+ and 3 Cl– ions. When using the ion size parameter a = 0.3 nm, the MPNPE concentration profile accurately matches the BD solution. As a comparison, we also plot the MPNPE profile obtained using a = 0.36 nm and a PNPE profile. Using a larger ion parameter in MPNPE lowers the concentration peak, whereas in PNPE, which ignores steric effects, the concentration peak is higher than in BD.
Figure 20.
Profile of concentration c+ for BD, PNPE, and MPNPE for the box domain (Experiment 1).
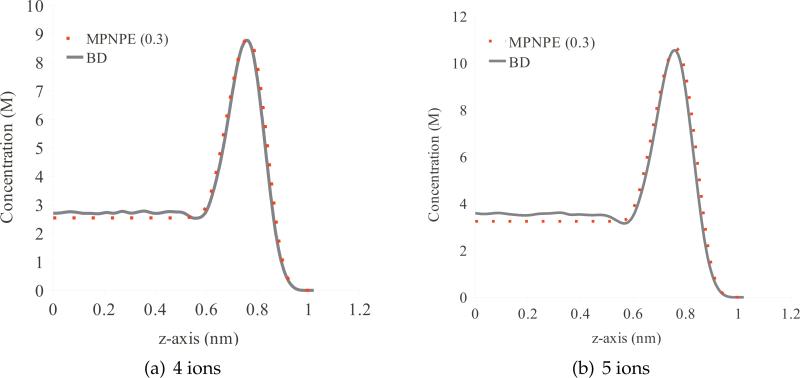
We repeat the same experiment using 4 and 5 ions of each K+ and Cl–. Similarly, the results shown in Fig. 21 demonstrate that an ion size of 0.3 nm captures the concentration profile from the corresponding BD simulations.
Figure 21.
Profile of concentration c+ for BD and MPNPE with the ion size parameter a=0.3 nm for the box domain (Experiment 1).
References
- 1.Neher E, Sakmann B, Steinbach J. The extracellular patch clamp: A method for resolving currents through individual open channels in biological membranes. Pflug. Arch. Eur. J. Physiol. 1978;375:219–228. doi: 10.1007/BF00584247. [DOI] [PubMed] [Google Scholar]
- 2.Sakmann B, Neher E. Patch clamp techniques for studying ionic channels in excitable membranes. Ann. Rev. Physiol. 1984;46:455–472. doi: 10.1146/annurev.ph.46.030184.002323. [DOI] [PubMed] [Google Scholar]
- 3.Mathé J, Visram H, Viasnoff V, Rabin Y, Meller A. Nanopore unzipping of individual DNA hairpin molecules. Biophys. J. 2004;87:3205–3212. doi: 10.1529/biophysj.104.047274. [DOI] [PMC free article] [PubMed] [Google Scholar]
- 4.Zhao Q, Sigalov G, Dimitrov V, Dorvel B, Mirsaidov U, Sligar S, Aksimentiev A, Timp G. Detecting SNPs using a synthetic nanopore. Nano Lett. 2007;7:1680–1685. doi: 10.1021/nl070668c. [DOI] [PMC free article] [PubMed] [Google Scholar]
- 5.Zhao Q, Comer J, Dimitrov V, Aksimentiev A, Timp G. Stretching and unzipping nucleic acid hairpins using a synthetic nanopore. Nucl. Acids Res. 2008;36:1532–1541. doi: 10.1093/nar/gkm1017. [DOI] [PMC free article] [PubMed] [Google Scholar]
- 6.Kang XF, Cheley S, Guan XY, Bayley H. Stochastic detection of enantiomers. J. Am. Chem. Soc. 2006;128:10684–10685. doi: 10.1021/ja063485l. [DOI] [PubMed] [Google Scholar]
- 7.Kasianowicz JJ, Brandin E, Branton D, Deamer DW. Characterization of individual polynucleotide molecules using a membrane channel. Proc. Natl. Acad. Sci. USA. 1996;93:13770–13773. doi: 10.1073/pnas.93.24.13770. [DOI] [PMC free article] [PubMed] [Google Scholar]
- 8.Akeson M, Branton D, Kasianowicz JJ, Brandin E, Deamer DW. Microsecond time-scale discrimination among polycytidylic acid, polyadenylic acid, and polyuridylic acid as homopolymers or as segments within singe RNA molecules. Biophys. J. 1999;77:3227–3233. doi: 10.1016/S0006-3495(99)77153-5. [DOI] [PMC free article] [PubMed] [Google Scholar]
- 9.Branton D, Deamer D, Marziali A, Bayley H, Benner S, Butler T, Di Ventra M, Garaj S, Hibbs A, Huang X, et al. The potential and challenges of nanopore sequencing. Nature Biotech. 2008;26(10):1146–1153. doi: 10.1038/nbt.1495. [DOI] [PMC free article] [PubMed] [Google Scholar]
- 10.Clarke J, Wu H, Jayasinghe L, Patel A, Reid S, Bayley H. Continuous base identification for single-molecule nanopore DNA sequencing. Nature Nanotech. 2009;4:265–270. doi: 10.1038/nnano.2009.12. [DOI] [PubMed] [Google Scholar]
- 11.Derrington I, Butler T, Collins M, Manrao E, Pavlenok M, Niederweis M, Gundlach J. Nanopore DNA sequencing with MspA. Proc. Natl. Acad. Sci. USA. 2010;107:16060. doi: 10.1073/pnas.1001831107. [DOI] [PMC free article] [PubMed] [Google Scholar]
- 12.Im W, Roux B. Ions and counterions in a biological channel: a molecular dynamics study of OmpF porin from Escherichia coli in an explicit membrane with 1 M KCl aqueous salt solution. J. Mol. Biol. 2002;319:1177–1197. doi: 10.1016/S0022-2836(02)00380-7. [DOI] [PubMed] [Google Scholar]
- 13.Im W, Roux B. Ion permeation and selectivity of OmpF porin: A theoretical study based on molecular dynamics, brownian dynamics, and continuum electrodiffusion theory. J. Mole. Bio. 2002;322:851–869. doi: 10.1016/s0022-2836(02)00778-7. [DOI] [PubMed] [Google Scholar]
- 14.Noskov SY, Im W, Roux B. Ion permeation through the α-hemolysin channel: Theoretical studies based on Brownian Dynamics and Poisson-Nernst-Plank electrodiffusion theory. Biophys. J. 2004;87:2299–2309. doi: 10.1529/biophysj.104.044008. [DOI] [PMC free article] [PubMed] [Google Scholar]
- 15.Aksimentiev A, Heng JB, Timp G, Schulten K. Microscopic kinetics of DNA translocation through synthetic nanopores. Biophys. J. 2004;87:2086–2097. doi: 10.1529/biophysj.104.042960. [DOI] [PMC free article] [PubMed] [Google Scholar]
- 16.Aksimentiev A, Schulten K. Imaging alpha-hemolysin with molecular dynamics: Ionic conductance, osmotic permeability and the electrostatic potential map. Biophys. J. 2005;88:3745–3761. doi: 10.1529/biophysj.104.058727. [DOI] [PMC free article] [PubMed] [Google Scholar]
- 17.Comer J, Dimitrov V, Zhao Q, Timp G, Aksimentiev A. Microscopic mechanics of hairpin DNA translocation through synthetic nanopores. Biophys. J. 2009;96:593–608. doi: 10.1016/j.bpj.2008.09.023. [DOI] [PMC free article] [PubMed] [Google Scholar]
- 18.Pezeshki S, Chimerel C, Bessonov AN, Winterhalter M, Kleinekathofer U. Understanding ion conductance on a molecular level: An all-atom modeling of the bacterial porin OmpF. Biophys. J. 2009;97:1898–1906. doi: 10.1016/j.bpj.2009.07.018. [DOI] [PMC free article] [PubMed] [Google Scholar]
- 19.Luo Y, Egwolf B, Walters D, Roux B. Ion selectivity of α-hemolysin with a β-cyclodextrin adapter. I. Single ion potential of mean force and diffusion coefficient. J. Phys. Chem. B. 2009:2035–2042. doi: 10.1021/jp906790f. [DOI] [PMC free article] [PubMed] [Google Scholar]
- 20.Aksimentiev A. Deciphering ionic current signatures of DNA transport through a nanopore. Nanoscale. 2010;2:468–483. doi: 10.1039/b9nr00275h. [DOI] [PMC free article] [PubMed] [Google Scholar]
- 21.Maffeo C, Bhattacharya S, Yoo J, Wells D, Aksimentiev A. Modeling and simulation of ion channels. Chem. Rev. 2012;112:6250–6284. doi: 10.1021/cr3002609. [DOI] [PMC free article] [PubMed] [Google Scholar]
- 22.Allen MP, Tildesley DJ. Computer Simulation of Liquids. Oxford University Press; New York: 1987. [Google Scholar]
- 23.Carr R, Comer J, Ginsberg M, Aksimentiev A. Atoms-to-microns model for small solute transport through sticky nanochannels. Lab Chip. 2011;11:3766–3773. doi: 10.1039/c1lc20697d. [DOI] [PMC free article] [PubMed] [Google Scholar]
- 24.Comer J, Aksimentiev A. Predicting the DNA sequence dependence of nanopore ion current using atomic-resolution Brownian dynamics. J. Phys. Chem. C. 2012;116:3376–3393. doi: 10.1021/jp210641j. [DOI] [PMC free article] [PubMed] [Google Scholar]
- 25.Davis ME, McCammon JA. Electrostatics in biomolecular structure and dynamics. Chem. Rev. 1990;90:509–521. [Google Scholar]
- 26.Barcilon V, Chen D-P, Eisenberg RS. Ion flow through narrow membrane channels. Part II. SIAM J. Appl. Math. 1992;52:1405–1425. [Google Scholar]
- 27.Kurnikova MG, Coalson RD, Graf P, Nitzan A. A lattice relaxation algorithm for three-dimensional Poisson-Nernst-Planck theory with application to ion transport through the gramicidin A channel. Biophys J. 1999;76:642–656. doi: 10.1016/S0006-3495(99)77232-2. [DOI] [PMC free article] [PubMed] [Google Scholar]
- 28.Lu B, Zhou Y, Huber GA, Bond SD, Holst MJ, McCammon JA. Electrodiffusion: A continuum modeling framework for biomolecular systems with realistic spatiotemporal resolution. J. Chem. Phys. 2007;127:135102. doi: 10.1063/1.2775933. (17 pages) [DOI] [PubMed] [Google Scholar]
- 29.Kilic MS, Bazant MZ, Ajdari A. Steric effects in the dynamics of electrolytes at large applied voltages. II. Modified Poisson-Nernst-Planck equations. Phys. Rev. E. 2007;75:021503. doi: 10.1103/PhysRevE.75.021503. [DOI] [PubMed] [Google Scholar]
- 30.Bolintineanu DS, Sayyed-Ahmad A, Davis HT, Kaznessis YN. Poisson-Nernst-Planck models of nonequilibrium ion electrodiffusion through a protegrin transmembrane pore. PLoS Comput. Biol. 2009;5(1):e1000277. doi: 10.1371/journal.pcbi.1000277. [DOI] [PMC free article] [PubMed] [Google Scholar]
- 31.Cardenas AE, Coalson RD, Kurnikova MG. Three-dimensional Poisson-Nernst-Planck theory studies: Influence of membrane electrostatics on gramicidin A channel conductance. Biophys. J. 2000;79(1):80–93. doi: 10.1016/S0006-3495(00)76275-8. [DOI] [PMC free article] [PubMed] [Google Scholar]
- 32.Cohen H, Cooley J. The numerical solution of the time-dependent Nernst-Planck equations. Biophys. J. 1965;5:145–162. doi: 10.1016/s0006-3495(65)86707-8. [DOI] [PMC free article] [PubMed] [Google Scholar]
- 33.Lu B, Zhou YC, Huber GA, Bond SD, Holst MJ, McCammon JA. Electrodiffusion: A continuum modeling framework for biomolecular systems with realistic spatiotemporal resolution. J. Chem. Phys. 2007;127:135102. doi: 10.1063/1.2775933. [DOI] [PubMed] [Google Scholar]
- 34.Lu B, Holst MJ, Andrew McCammon J, Zhou YC. Poisson-Nernst-Planck equations for simulating biomolecular diffusion-reaction processes I: Finite element solutions. J. Comput. Phys. 2010;229:6979–6994. doi: 10.1016/j.jcp.2010.05.035. [DOI] [PMC free article] [PubMed] [Google Scholar]
- 35.Lu B, Zhou Y. Poisson-Nernst-Planck equations for simulating biomolecular diffusion-reaction processes II: Size effects on ionic distributions and diffusion-reaction rates. Biophys. J. 2011;100:2475–2485. doi: 10.1016/j.bpj.2011.03.059. [DOI] [PMC free article] [PubMed] [Google Scholar]
- 36.Zheng Q, Chen D, Wei G-W. Second-order Poisson-Nernst-Planck solver for ion transport. J. Comput. Phys. 2011;230:5239–5262. doi: 10.1016/j.jcp.2011.03.020. [DOI] [PMC free article] [PubMed] [Google Scholar]
- 37.Logg A, Wells GN. DOLFIN: Automated finite element computing. ACM Trans. Math. Softw. 2010;37:20:1–20:28. [Google Scholar]
- 38.Braess D. Finite Elements: Theory, Fast Solvers, and Applications in Elasticity Theory. 3rd Edition Cambridge University Press; 2007. [Google Scholar]
- 39.Bochev PB, Gunzburger MD, Shadid JN. Stability of the SUPG finite element method for transient advection-diffusion problems. Comp. Meth. Appl. Mech. Engr. 2004;193(23-26):2301–2323. [Google Scholar]
- 40.Hughes TJR. Recent progress in the development and understanding of SUPG methods with special reference to the compressible Euler and Navier-Stokes equations. Int. J. Numer. Meth. Fluids. 1987;7:1261–1275. [Google Scholar]
- 41.Hughes TJR, Franca LP, Hulbert GM. A new finite element formulation for computational fluid dynamics: VIII. The galerkin/least-squares method for advective-diffusive equations. Comp. Meth. Appl. Mech. Engr. 1989;73:173–189. [Google Scholar]
- 42.Franca LP, Frey SL, Hughes TJR. Stabilized finite element methods: I. Application to the advective-diffusive model. Comp. Meth. Appl. Mech. Engr. 1992;95:253–276. [Google Scholar]
- 43.T. T. E. Stabilized finite element formulations for incompressible flow computations. Adv. Appl. Mech. 1991;28:1–44. [Google Scholar]
- 44.Hughes TJ, Mallet M, Akira M. A new finite element formulation for computational fluid dynamics: II. Beyond SUPG. Comp. Meth. Appl. Mech. Engr. 1986;54:341–355. [Google Scholar]
- 45.Gilson MK, Davis ME, Luty BA, McCammon JA. Computation of electrostatic forces on solvated molecules using the poisson-boltzmann equation. J. Phys. Chem. 1993;97:3591–3600. doi: 10.1063/1.1924448. [DOI] [PubMed] [Google Scholar]
- 46.Zhou Z, Payne P, Vasquez M, Kuhn N, Levitt M. Finite-difference solution of the Poisson-Boltzmann equation: Complete elimination of self-energy. J. Comput. Chem. 1996;17:1344–1351. doi: 10.1002/(SICI)1096-987X(199608)17:11<1344::AID-JCC7>3.0.CO;2-M. [DOI] [PubMed] [Google Scholar]
- 47.Chaudhry J, Bond S, Olson L. Finite element approximation to a finite-size modified Poisson-Boltzmann equation. J. Sci. Comput. 2011;47:347–364. 10.1007/s10915-010-9441-7. [Google Scholar]
- 48.Bond SD, Chaudhry JH, Cyr EC, Olson LN. A first-order system least-squares finite element method for the Poisson-Boltzmann equation. J. Comput. Chem. 2010;31(8):1625–1635. doi: 10.1002/jcc.21446. [DOI] [PubMed] [Google Scholar]
- 49.Chern I-L, Liu J-G, Wang W-C. Accurate evaluation of electrostatics for macromolecules in solution. Meth. Appl. Anal. 2003;10:309–328. [Google Scholar]
- 50.Aksoylu B, Bond SD, Cyr EC, Holst MJ. Goal-oriented adaptivity and multilevel preconditioning for the Poisson-Boltzmann equation. J. Sci. Comput. 2012;52:202–225. [Google Scholar]
- 51.Bazant MZ, Kilic MS, Storey BD, Ajdari A. Towards an understanding of induced-charge electrokinetics at large applied voltages in concentrated solutions. Adv. Colloid Interface Sci. 2009;152(1-2):48–88. doi: 10.1016/j.cis.2009.10.001. [DOI] [PubMed] [Google Scholar]
- 52.Heng J, Aksimentiev A, Ho C, Marks P, Grinkova Y, Sligar S, Schulten K, Timp G. The electromechanics of dna in a synthetic nanopore. Biophys. J. 2006;90:1098–1106. doi: 10.1529/biophysj.105.070672. [DOI] [PMC free article] [PubMed] [Google Scholar]
- 53.Drew HR, Wing RM, Takano T, Broka C, Tanaka S, Itakura K, Dickerson RE. Structure of a b-dna dodecamer: Conformation and dynamics. Proc. Natl. Acad. Sci. USA. 1981;78:2179–2183. doi: 10.1073/pnas.78.4.2179. [DOI] [PMC free article] [PubMed] [Google Scholar]
- 54. URL http://www.rcsb.org/pdb/
- 55.Dolinsky T, Czodrowski P, Li H, Nielsen J, Jensen J, Baker GKN. Pdb2pqr: Expanding and upgrading automated preparation of biomolecular structures for molecular simulations. Nucleic Acids Res. 2007;35:W522–W525. doi: 10.1093/nar/gkm276. [DOI] [PMC free article] [PubMed] [Google Scholar]
- 56.Dolinsky T, Nielsen J, McCammon J, Baker N. Pdb2pqr: An automated pipeline for the setup, execution, and analysis of Poisson-Boltzmann electrostatics calculations. Nucleic Acids Res. 2004;35:W665–W667. doi: 10.1093/nar/gkh381. [DOI] [PMC free article] [PubMed] [Google Scholar]
- 57.Yu Z, Holst MJ, Cheng Y, McCammon JA. Feature-preserving adaptive mesh generation for molecular shape modeling and simulation. J. Mol. Graph. Model. 2008;26:1370–1380. doi: 10.1016/j.jmgm.2008.01.007. [DOI] [PubMed] [Google Scholar]
- 58.Geuzaine C, Remacle J-F. Gmsh: A 3-d finite element mesh generator with built-in preand post-processing facilities. Int. J. Numer. Meth. Engr. 2009;79:1309–1331. [Google Scholar]
- 59.Smeets RMM, Keyser UF, Krapf D, Wu M-Y, Dekker NH, Dekker C. Salt dependence of ion transport and dna translocation through solid-state nanopores. Nano Letters. 2006;6:89–95. doi: 10.1021/nl052107w. [DOI] [PubMed] [Google Scholar]
- 60.Young M, Jayaram B, Beveridge D. Local dielectric environment of B-DNA in solution: Results from a 14 ns molecular dynamics trajectory. J. Phys. Chem. B. 1998;102:7666–7669. [Google Scholar]
- 61.Roux B. The calculation of the potential of mean force using computer simulations. Comp. Phys. Commun. 1995;91:275–282. [Google Scholar]
- 62.Phillips JC, Braun R, Wang W, Gumbart J, Tajkhorshid E, Villa E, Chipot C, Skeel RD, Kale L, Schulten K. Scalable molecular dynamics with NAMD. J. Comp. Chem. 2005;26:1781–1802. doi: 10.1002/jcc.20289. [DOI] [PMC free article] [PubMed] [Google Scholar]
- 63.MacKerell AD, Jr., Bashford D, Bellott M, Dunbrack RL, Jr., Evanseck J, Field MJ, Fischer S, Gao J, Guo H, Ha S, Joseph D, Kuchnir L, Kuczera K, Lau FTK, Mattos C, Michnick S, Ngo T, Nguyen DT, Prodhom B, Reiher IWE, Roux B, Schlenkrich M, Smith J, Stote R, Straub J, Watanabe M, Wiorkiewicz-Kuczera J, Yin D, Karplus M. All-atom empirical potential for molecular modeling and dynamics studies of proteins. J. Phys. Chem. B. 1998;102:3586–3616. doi: 10.1021/jp973084f. [DOI] [PubMed] [Google Scholar]
- 64.Beglov D, Roux B. Finite representation of an infinite bulk system: Solvent boundary potential for computer simulations. J. Chem. Phys. 1994;100:9050–9063. [Google Scholar]
- 65.Im W, Roux B. Brownian dynamics simulations of ions channels: A general treatment of electrostatic reaction fields for molecular pores of arbitrary geometry. J. Chem. Phys. 2001;115:4580. [Google Scholar]
- 66.Wells DB, Abramkina V, Aksimentiev A. Exploring transmembrane transport through α-hemolysin with grid-steered molecular dynamics. J. Chem. Phys. 2007;127:125101. doi: 10.1063/1.2770738. [DOI] [PMC free article] [PubMed] [Google Scholar]


