

Abstract
Acoustic trauma, a leading cause of sensorineural hearing loss in adults, induces a complex degenerative process in the cochlea. Although previous investigations have identified multiple stress pathways, a comprehensive analysis of cochlear responses to acoustic injury is still lacking. In the current study, we used the next-generation RNA-sequencing (RNA-seq) technique to sequence the whole transcriptome of the normal and noise-traumatized cochlear sensory epithelia (CSE). CSE tissues were collected from rat inner ears 1 d after the rats were exposed to a 120-dB (sound pressure level) noise for 2 h. The RNA-seq generated over 176 million sequence reads for the normal CSE and over 164 million reads for the noise-traumatized CSE. Alignment of these sequences with the rat Rn4 genome revealed the expression of over 17000 gene transcripts in the CSE, over 2000 of which were exclusively expressed in either the normal or noise-traumatized CSE. Seventy-eight gene transcripts were differentially expressed (70 upregulated and 8 downregulated) after acoustic trauma. Many of the differentially expressed genes are related to the innate immune system. Further expression analyses using qRT-PCR confirmed the constitutive expression of multiple complement genes in the normal organ of Corti and the changes in the expression levels of the complement factor I (Cfi) and complement component 1, s subcomponent (C1s) after acoustic trauma. Moreover, protein expression analysis revealed strong expression of Cfi and C1s proteins in the organ of Corti. Importantly, these proteins exhibited expression changes following acoustic trauma. Collectively, the results of the current investigation suggest the involvement of the complement components in cochlear responses to acoustic trauma.
Keywords: RNA-seq, noise, cochlea, sensory cells, complement components, rat
One of the leading causes of sensorineural hearing loss in adults is acoustic overstimulation, which can cause mechanical and metabolic stresses to the cochlear structure and consequently induce sensory cell degeneration (Lim, 1986, Bohne and Harding, 2000, Cheng et al., 2005, Henderson et al., 2006). Currently, there are no effective therapies available for preventing sensorineural hearing loss. To minimize cochlear damage, numerous pharmacological therapies have been studied (Abi-Hachem et al., 2010, Bielefeld et al., 2011, Clifford et al., 2011, Guthrie et al., 2011, Oishi and Schacht, 2011). Moreover, the development of gene therapies is also underway (Kesser and Lalwani, 2009, Di Domenico et al., 2011, Zhai et al., 2011). Further progress toward these therapies requires a better understanding of the molecular pathways responsible for controlling the cochlear degenerative process.
Noise-induced cochlear damage involves complex molecular events. To decipher these complex signaling pathways, several high throughput techniques, including microarrays and PCR array, have been employed in large-scale analyses of noise-induced differential expression of cochlear genes. Microarrays can be used to simultaneously quantify a large number of genes, thus producing a wealth of information (Kaminski and Friedman, 2002, Aittokallio et al., 2003, Weeraratna et al., 2004). However, this technique suffers from intrinsic limitations (Shi et al., 2004, Larkin et al., 2005, Kawasaki, 2006, Shi et al., 2008), including the inability to identify novel genes and to define a large dynamic change in gene expression levels. Furthermore, due to hybridization artifacts and high background noise signals, microarray techniques are often unable to detect low-abundance genes. In contrast, the PCR array technique has an excellent sensitivity and a large dynamic range. However, its throughput is limited.
Recently, the technique of RNA-sequencing (RNA-seq), which was developed as a deep-sequencing platform, has enabled whole-transcriptome sequencing in a comprehensive way (Mortazavi et al., 2008, Wang et al., 2009, Wilhelm and Landry, 2009, Marguerat and Bahler, 2010). This ultra-high-throughput technology detects both known and unknown gene transcripts. It features a large dynamic range, contributing to its ability to accurately quantify a broader number of differentially expressed gene transcripts (Sengupta et al., 2010, Tang et al., 2010, Tariq et al., 2011). Moreover, it is possible to obtain whole-transcriptome sequencing with high reproducibility. Recently, RNA-seq has been utilized to compare the transcriptome differences between various normal and pathological conditions in non-cochlear tissues (Beane et al., 2011, Bottomly et al., 2011, Huang et al., 2011, Jager et al., 2011). This technique has the potential to identify novel signaling pathways involved in noise-induced cochlear damage.
In the current study, we applied RNA-Seq to sequence the whole transcriptome of the cochlear sensory epithelium (CSE) and to identify transcriptome changes after acoustic trauma. A bioinformatic pathway analysis revealed the involvement of five signaling pathways in noise-induced cochlear degeneration. The involvement of the complement components was further confirmed through transcriptional analysis of sensory-cell-enriched samples and posttranscriptional analysis of the cochlear sensory epithelium. This is the first time that complement components have been implicated in noise-induced cochlear degeneration.
2.0 Experimental Procedures
2.1 Animals and acoustic overstimulation
Sprague Dawley rats, (220–300 g, 2–3 months old, male and female, Charles River Laboratories, Wilmington, MA) were used. For the RNA-seq analysis, eight rats were divided equally into two groups (normal and noise-traumatized). For the qRT-PCR analysis, six rats were divided equally into two groups (normal and noise-traumatized). For an immunohistochemistry analysis, eight rats were divided equally into two groups (normal and noise-traumatized). For a western blot analysis, three rats from the normal group were used. For the qRT-PCR array analysis, six rats from the normal group were used. In addition, three C57BL/6J (4–6 weeks old, male and female, The Jackson Laboratory, Bar Harbor, Maine) were used to determine the constitutive expression of complement genes under normal conditions.
Awake animals from the noise-traumatized group were exposed to a broadband continuous noise (1–7 kHz) at the level of 120 dB (sound pressure level, re 20 μPa) for 2 h. This level of noise was chosen because it is capable of inducing permanent hearing loss and sensory cell apoptosis (Hu et al., 2009, Hu and Cai, 2010). The noise signal was generated with a real-time signal processor (RP2.1, Tucker-Davis technologies (TDT), Alachua, Fl), routed through an attenuator (PA5, TDT) and a power amplifier (Crown XLS 202, Harman International Company) connected to a loud speaker (NSD2005–8, Eminence). The speaker was suspended directly above the animal holding cage. The noise level at the position of the animal’s head in the sound field was calibrated using a sound level meter (Larson and Davis 800 B, Depew, NY), a preamplifier (Larson and Davis, model 825) and a ½” condenser microphone (Larson and Davis, LDL 2559). Rats were individually exposed to the noise in the holding cage.
2.2 Auditory brainstem response test
Auditory brainstem responses (ABR) were measured before and 1 d after the noise exposure to determine the hearing sensitivity of the animals. The animals were lightly anesthetized by an intraperitoneal injection of a mixture of ketamine (87 mg/kg) and xylazine (3 mg/kg). ABRs were recorded using stainless steel needle electrodes subdermally placed over the vertex (noninverting electrode) and posterior to the stimulated and non-stimulated ear (inverting electrode and ground electrode) of the animal. The acoustic stimuli were 5, 10, 20, 30 and 40 kHz tone bursts (0.5 msec rise/fall Blackman ramp, 1 msec duration, alternating phase) at the rate of 21/second, which were generated digitally using a D/A converter (RP2.1, TDT, 100 kHz sampling rate) and fed to a programmable attenuator (PA5, TDT), an amplifier (SA1, TDT) and a closed-field loudspeaker (CF1, TDT). The electrode outputs were delivered to an amplifier (RA4LI and RA4PA; TDT) and then to a medusa base station (RA16BA, TDT). TDT software (BioSig) controlled the auditory evoked response averaging system. Responses were filtered (100–3000 Hz), amplified and averaged using TDT hardware and software. These responses were then stored and displayed on a computer. Stimulus levels were decreased in 5-dB steps. The lowest intensity that reliably elicited a detectable waveform of the response was defined as the ABR threshold.
ABR thresholds obtained pre and 1 d post-noise exposure at the five tested frequencies (5, 10, 20, 30 and 40 kHz) were compared using a repeated measures two-way analysis of variance (ANOVA) with post hoc Tukey’s test to compare the means.
2.3 Euthanasia of animals and harvesting of cochlear tissues
Following the final ABR testing at 1 d after noise exposure, the animals were decapitated under CO2 gas anesthesia and cochlear tissues were harvested. The cochleae to be used for RNA-seq and qRT-PCR analysis were immediately perfused through the round window with an RNA stabilization reagent (RNAlater, Qiagen, Valencia, CA). The cochlea was then carefully dissected to collect cochlear tissues in the RNAlater reagent under a dissection microscope. For RNA-seq analysis, the CSE tissues were isolated, and the tissues from the two cochleae of one animal were pooled together to generate one sample. For qRT-PCR analysis, the CSE tissue was collected from one cochlea and the sensory cell-enriched tissues from the other cochlea. The CSE tissues contained all the cells on the basilar membrane, whereas the sensory cell-enriched tissues contained only the cells belonging to the organ of Corti, which include the sensory cells, Deiters cells, pillar cells, inner phalangeal cells and inner border cells.
The sensory cell-enriched tissues were obtained by micro-dissection of the cochlea using a two-step process. The first step was performed in ice-cold Dulbecco’s phosphate buffer saline solution (DPBS, GIBCO) and was completed within a few minutes. The modiolus was removed along with the tissues of the lateral wall and the sensory epithelium; however, the section that was designated for sample collection in the upper first cochlear turn was left behind. Then, the cochlea was transferred into the RNA-stabilizing reagent. The second step involved separating the sensory cell-enriched tissue from the basilar membrane using a custom-made micro-knife. Specifically, we gently scraped the reticular laminar at the junction between the Deiters cells and the Hensen cells and then pushed the tissue away from the basilar membrane. The collected tissues were stored in the RNAlater medium at 4 °C until RNA extraction, which was performed within a few days after the dissection.
For immunohistochemistry analysis, the cochleae from both normal and noise-traumatized animals were quickly removed from the skull and fixed overnight with 10% buffered formalin. The cochleae were dissected in 10 mM PBS to collect the sensory epithelium for subsequent immunostaining. For western blot analysis, the cochlear tissues containing the sensory epithelia and lateral walls from both ears were collected. The collected tissues were immediately frozen in liquid nitrogen and used for subsequent protein isolation.
2.4 Isolation and quantification of total RNA
Total RNA was isolated using an RNA isolation kit (RNeasy Micro Kit or Mini Kit, Qiagen) for the RNA-seq samples and the qRT-PCR samples. The cochlear tissue was physically disrupted using a rotor-stator homogenizer in 150 μl Qiazol lysis buffer for 30 seconds. The solution was incubated for 10 min at room temperature and then 50 μl of chloroform was added. The mixture was shaken vigorously for 15 seconds, incubated for 5 min at room temperature, and then centrifuged (12,000 rpm) for 15 min at 4 °C. The upper clear aqueous layer was transferred into a centrifuge tube and combined with 175 μl of 75% ethanol, mixed and passed through a spin column (provided in the RNeasy Micro / Mini Kit) and centrifuged at 8000 rpm for 20 seconds. The solution was washed with the manufacturer-provided buffer three times. Finally, total RNA was collected in either 12 μl of RNase free water (RNeasy Micro Kit) or 50 μl of RNase free water (RNeasy Mini Kit). The quality and quantity of collected total RNA for the RNA-seq samples was evaluated using the Agilent Bioanalyzer 2100 (Agilent Technologies, Santa Clara, CA) and the RiboGreen Quantification assay (Life Technologies, Grand Island, NY). The quality and quantity of collected total RNA for the qRT-PCR samples was evaluated using a Nanodrop 2000 Spectrophotometer (Thermo Scientific, Wilmington, DE).
2.5 Illumina sequencing and analysis
For the RNA-seq samples, synthesis of cDNA from 8–11 ng of total RNA was performed with the Clontech SMARTer™ Ultra Low RNA Kit (Clontech Laboratories Inc, Mountain View, CA). From each cDNA sample, a sequencing library was prepared using the Illumina Paired End Sample Prep Kit (Illumina Inc, San Diego, CA) according to Illumina’s Ultra Low Input mRNA-Seq protocol. The average insert size of the libraries was 124 bp. Each cDNA library was sequenced for 50 cycles, which generated 50 base pair reads, in a single flow-cell lane on the Illumina HiSeq 2000 (Illumina). Thus, each read consists of a 50-base-pair sequence of a DNA fragment. The total number of reads was obtained from sequencing all the DNA fragments of each individual cDNA library. To evaluate the difference in the average number of reads between the normal and noise-traumatized groups, Student’s t-test was performed.
The sequence reads were aligned to the rat reference genome sequence (USCS Genome Browser, Rn4) (Karolchik et al., 2011) using TopHat (version 1.3.2)(Trapnell et al., 2009) and Bowtie (Langmead et al., 2009) to generate sequence alignments. The resulting alignments were further assembled and annotated using Cufflinks (Trapnell et al., 2010). Cuffdiff was used to detect differentially expressed gene transcripts between the normal and the noise groups. A two-tailed Student’s t-test was used to evaluate the differences in expression levels between the two groups. Estimated normalized expression levels were reported in fragments per kilobase of transcripts per million fragments mapped (FPKM). Measurements in FPKM incorporates a normalization step that enables expression levels for different genes and transcripts to be compared. The fragments mapped to each transcript are counted and then the counts are normalized to each transcripts length. A cut-off value of FPKM ≥ 0.1 was applied to reduce false positive identification of gene transcripts. To evaluate the change in individual variation in the expression levels of the genes between the two groups, the coefficient of variance (CV) was calculated from the FPKM values of each gene transcript in each group, and the mean CV differences between the two groups were compared using a Student’s t-test. To evaluate individual variation among samples within either the normal or noise-traumatized group, a Pearson’s correlation analysis was performed. An α level of 0.05 was selected for significance for all statistical tests.
2.6 Pathway analysis
The database DAVID (the database of annotation, visualization and integrated discovery) (Song et al., 2009, Granath et al., 2011, Li et al., 2011) was used for pathway analysis. The differentially expressed gene transcripts (q <0.05) identified from the RNA-Seq data were input into DAVID, which identified enriched biological pathways and associated gene transcripts.
2.7 qRT-PCR analysis
To verify the quality of the expression analysis of the RNA-seq, we compared gene expression levels identified using RNA-seq with those shown by the qRT-PCR array. A set of genes known to participate in apoptotic activity was used because apoptosis has been linked to acute cochlear responses to acoustic trauma (Hu et al., 2006, Hu and Zheng, 2008). The qRT-PCR array method has previously been described(Hu et al., 2009). Briefly, the isolated total RNAs from the normal rats were reverse transcribed using the oligo-dT primed reverse transcriptase supplied with the RT2 first strand kit (Qiagen). The resulting cDNA template was loaded onto the RT2 Profiler™ PCR Array (Qiagen), and qRT-PCR was performed on a MyIQ-single color real time PCR detection system (Bio-Rad, Hercules, CA). The array included endogenous controls, Hprt1, Rplp1, Rpl13a and Ldha. We then performed a Pearson’s correlation analysis to determine the strength of the correlation between RNA-seq and qRT-PCR data. An α level of 0.05 was selected for significance for the statistical tests.
To confirm the constitutive expression and the noise-induced changes in the expression of complement pathway gene transcripts (see the Results section for the genes examined), we repeated transcriptional analyses using qRT-PCR. The total RNA isolated from both the CSE tissues and the sensory cell-enriched tissues were reverse transcribed using a High Capacity cDNA Reverse Transcription Kit (Life Technologies). The cDNA samples were used for qRTPCR on the MyIQ-single color real-time PCR detection system (Bio-Rad). The Hprt1, Actb and Rplp1 pre-developed TaqMan assays were used as endogenous controls (Life Technologies). For mRNA data analysis, the cycle threshold (CT) value of each mRNA was normalized to the average value of the endogenous gene transcripts (Hprt1, Rplp1 and Actb). Relative expression was calculated using the comparative CT (2–ΔΔCT) method. To evaluate the fold differences between groups, Student’s t-test was performed. An α level of 0.05 was selected for significance for all statistical tests.
2.8 Immunohistochemistry
Immunohistochemistry was used to determine the changes in the protein expression patterns of Cfi and C1s in the sensory epithelium. The harvested cochleae were permeabilized with 0.2% Triton X-100 in PBS for 30 min. The tissues were blocked with 10% donkey serum in PBS, and incubated overnight at 4°C in a solution containing a primary antibody (Cfi, sc-69465 or C1s, sc-99196; Santa Cruz Biotechnology, Inc., Santa Cruz, CA) at the concentration recommended by the manufacturer. After incubation, the tissues were rinsed with PBS (3 ×), incubated with a secondary antibody (Alexa Fluor 488-labeled donkey anti-goat antibody for Cfi and Alexa Fluor 488-labeled donkey anti-rabbit antibody for C1s) for 2 h, and counterstained with propidium iodide (5 μg/ml in PBS) for 10 min. Propidium iodide stains the cell nuclei. Nuclei with increased intensity of propidium iodide staining were defined as condensed nuclei regardless whether the nucleus decreased in size (Yang et al., 2004, Hu et al., 2006). The cochleae from the animals that did not undergo noise exposure were used as the normal control. Images of immunolabeled tissues were taken with confocal microscopy (Zeiss LSM510, Carl Zeiss Microscopy, Thornwood, NY) using a method that has been reported previously (Hu and Cai, 2010; Cai et al., 2012). Quantification of C1s fluorescence was performed as previously described (Kirkeby and Thomsen, 2005). To evaluate the difference in C1s immunolabeling intensities between groups, Student’s t-test was performed. As a negative control, tissue samples from both normal and noise-traumatized cochleae were incubated with only the secondary antibody during the tissue processing to evaluate non-specific staining.
2.9 Western blot
For C1s total protein extraction, the harvested cochlear tissues from the normal animals were homogenized on ice in 100 μl RIPA lysis buffer (Santa Cruz Biotechnology, Inc.). Centrifugation at 12,000 rpm for 20 min at 4°C pelleted the nuclei and cell debris, leaving the supernatant which was used for western blotting. For Cfi nuclear protein extraction, the harvested cochlear tissues from the normal animals were processed using the NE-PER Nuclear and Cytoplasmic Extraction Reagents according to the manufacturer’s instructions (Pierce, Biotechnology, Inc., Rockford, IL). Both C1s and Cfi protein samples were then denatured and separated under reducing conditions by electrophoresis in a NuPAGE Novex 4–12% Bus-Tris Gel (Life Technologies) at 125 V for 2 h. The SeeBlue Plus2 Pre-stained standard and MagicMark XP were used as protein markers (Life Technologies). After electrophoresis, the proteins were transferred onto a 0.2 μm PVDF transfer membrane (Life Technologies) for 2 h at 30 V. Once the proteins were transferred onto the membranes, they were blocked using 5% non-fat powdered milk in 1x Tris-buffered saline (TBS) with 0.05% TWEEN-20 (TBSt) followed by incubation with the primary antibody (Cfi, sc-69465 or C1s, sc-99196; Santa Cruz Biotechnology, Inc.) or the tissue-specific loading control primary antibody (Gapdh, ABS16, EMD Millipore, Billerica, MA) at 4°C overnight. The next day, membranes were washed in 1xTBSt (3×), incubated with secondary antibody (donkey anti-goat-IgG-horseradish peroxidase (HRP) and donkey anti-rabbit-IgG- (HRP), Santa Cruz Biotechnology Inc.) and visualized using the chemiluminescent substrate for HRP (Thermo Fisher Scientific, Waltham, MA).
Results
3.1 Noise-induced hearing loss
To provide a context for the interpretation of the RNA-Seq data, we examined the impact of acoustic overstimulation on cochlear function. ABR thresholds were measured before (n = 4) and 1 d post-noise exposure (n = 4) to determine the change of the cochlear function. Relative to pre-noise thresholds, there was an average threshold shift of 44.7 ± 3.2 dB (mean ± SD) at 1 d post-noise exposure (Fig. 1). A repeated measures two-way ANOVA (time × frequency) revealed that the shifts were statistically significant for the time factor (F = 2363; df = 1, 30; p < 0.0001), but not significant for the interaction between the frequency factor and the time factor (F = 2.450; df = 4, 30; p = 0.06), suggesting that the noise exposure used in the current investigation induced significant hearing loss over the five tested frequencies. This level of cochlear dysfunction is consistent with that observed in our previous investigation using a similar noise paradigm (Cai et al., 2012).
Figure 1. Loss of auditory function following noise exposure.
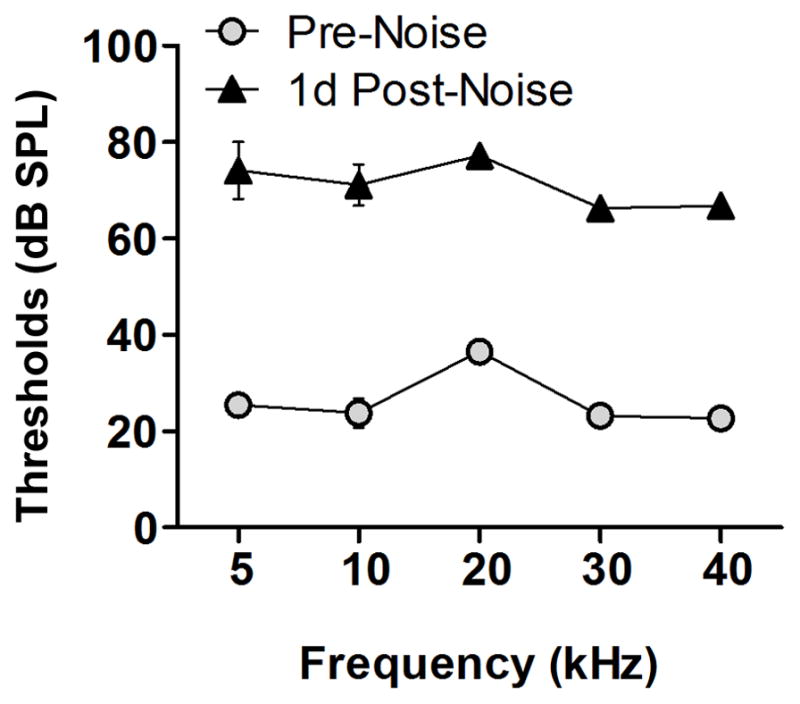
Comparison of the ABR thresholds (dB, mean ± SD) measured at two time points: pre-noise exposure and 1 d post-noise exposure. The thresholds at the five tested frequencies, 5, 10, 20, 30 and 40 kHz, are presented. Relative to pre-noise thresholds, there is an average threshold shift of 44.7 ± 3.2 dB (mean ± SD) at 1 d post-noise exposure. A repeated measures two-way ANOVA (time × frequency) reveals that the shifts are statistically significant for the time factor (F = 2363; df = 1, 30; p < 0.0001), but not significant for the interaction between the frequency factor and time factor (F = 2.450; df = 4, 30; p = 0.06), suggesting that the noise level used in the current investigation induced significant hearing loss over the five tested frequencies.
3.2 RNA-Seq data set
For the Illumina library preparation, two samples, one from the noise group and the other from the normal group, did not pass the quality control test and were excluded from the RNA-Seq sequencing. Sequencing of the remaining cochlear cDNA samples (n = 3 for the noise-traumatized and n = 3 for the normal group, collected from six individual animals) generated an average of 176 ± 21 million reads (159 to 201 million) for the normal group and 164 ± 47 million reads (113 to 208 million) for the noise-traumatized group (Table 1). A read is defined as a short 50 base pair sequence of a DNA fragment. The read number reflects the total number of short reads obtained from sequencing each individual cDNA library. There was no significant difference in the average numbers of reads between the two groups (Student’s t-test, p = 0.7). In all these samples, 89–96% of reads passed quality filtering, an indication of the overall quality of the sequencing runs that was performed using the standard Illumina chastity filter. The filter assigns each base a quality score based on the Sanger format phred+33 scale (Casava 1.8) (Pomraning et al., 2012).
Table 1.
RNA-seq reads of the normal (N1-3) and noise-traumatized cochlear sensory epithelium samples (E1-3)
| Sample | Raw Read Number | The rate of passing the Filtering (%) |
|---|---|---|
| N1 | 201,036,188 | 96.08 |
| N2 | 167,940,585 | 89.51 |
| N3 | 159,901,482 | 92.79 |
| E1 | 113,467,961 | 91.16 |
| E2 | 208,180,678 | 93.56 |
| E3 | 170,872,626 | 93.90 |
The sequence reads were mapped to the rat reference genome sequence (Rn4) using TopHat (Trapnell et al., 2009) and Bowtie (Langmead et al., 2009). The resulting alignments were further assembled and annotated using Cufflinks (Trapnell et al., 2010). Over 17000 gene transcripts were mapped to annotated areas of the Rn4 genome. These gene transcripts were used for subsequent analyses.
3.3 Expression profile of gene transcripts in the normal cochlear sensory epithelium
The expression profile of mRNAs in the rat CSE has not been previously reported. Therefore, we sought to examine the CSE transcriptome of rats with normal hearing sensitivity. The annotated sequences were refined using a cut-off value of FPKM ≥ 0.1 to reduce false positive identification because FPKM values below 0.1 represent low to undetectable gene transcript levels (Lundberg et al., 2010, Costa et al., 2011). With this cut-off value, we identified 12040 gene transcripts that were expressed in all three biological replicates.
3.4 Correlation of RNA-Seq data and qRT-PCR data of selected genes
To verify the quality of the RNA-seq expression analysis, we first analyzed the expression levels of 69 apoptosis-related gene transcripts with both RNA-seq and qRT-PCR and then compared the results. These genes were selected because apoptosis has been implicated in cochlear pathogenesis (Hu et al., 2002, 2006) and because the qRT-PCR data had already been collected (Hu et al., 2009). Correlation analysis of the RNA-seq data and the qRT-PCR data revealed a negative value for the correlation coefficient (r = −6.9, Pearson’s correlation, p < 0.0001, Fig. 2). Because a higher CT value corresponds to a lower expression level, the negative r value indicates a positive correlation between the expression levels assessed by RNA-seq and qRT-PCR. This analysis indicates a high degree of consistency between the RNA-Seq and the qRT-PCR array data sets.
Figure 2. The RNA-Seq data are correlated with qRT-PCR array data for apoptosis-related genes.
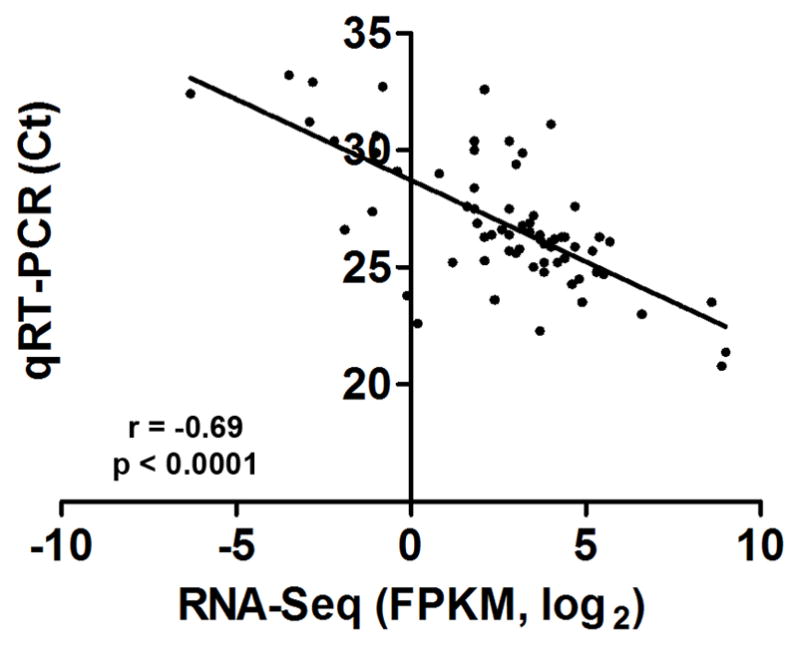
A correlation analysis of the expression levels of 69 apoptosis-related genes measured with RNA-seq and qRT-PCR array techniques was performed for normal cochlear tissues. The CT values are used to indicate the expression levels for qRT-PCR data and the FPKM (fragments per kilobase of transcripts per million fragments mapped) values are used to indicate the expression levels for RNA-seq data. The qRT-PCR array data (n = 6) are significantly correlated with the log2 FPKM data (r = − 0.69, p < 0.0001). As a higher CT value corresponds to a lower expression level, the negative r value indicates a positive correlation between the expression levels assessed by RNA-seq and qRT-PCR.
3.5 Acoustic trauma causes differential changes in gene expression in the cochlear sensory epithelium
Using the same strategy as for the analysis of normal cochlear samples, we refined the annotated sequences for the noise-traumatized samples and identified 11873 gene transcripts that were present in all three biological replicates. This number of gene transcripts is similar to the number (12040) observed in the normal cochlear samples. However, the analysis of the distribution of the mean FPKM values revealed that 75% of gene transcripts had FPKM values ≥ 6 in the noise-traumatized cochlear samples, compared with only 53% of gene transcripts with FPKM values ≥ 6 in the normal cochlear samples (Fig. 3). This shift of gene transcript distribution suggests an increase in the copy numbers of many gene transcripts following acoustic trauma.
Figure 3. Comparison of the numbers of gene transcripts between the normal and noise samples.

The histogram illustrates the distribution of the numbers of gene transcripts based on their FPKM values. The number of low-abundance genes in the normal control samples was greater than those in the noise samples, whereas the number of the moderate- and high-abundance genes was less in the normal samples. This analysis shows that acoustic trauma causes an overall increase in the gene expression level. The solid and dotted lines are the trend lines of the data.
We then compared the differential expression levels of the gene transcripts that were expressed in both normal and noise-traumatized cochleae. A total of 70 gene transcripts were significantly upregulated (p < 0.05, 2-tailed Student’s t-test), and 8 gene transcripts were significantly downregulated following acoustic trauma (Table 2). In addition, we found 2776 gene transcripts that were not expressed in the normal cochleae became detectable in the noise-traumatized cochleae. Conversely, 2951 gene transcripts that were constitutively expressed in the normal cochleae became undetectable after acoustic trauma. Together, these analyses indicate that acoustic overstimulation induces a widespread gene expression change in the CSE.
Table 2.
Differentially Expressed Genes in the Cochlear Sensory Epithelium Following Acoustic Trauma
| Gene Symbol | Gene Description | Fold Change |
|---|---|---|
| Upregulated | ||
| A3galt2 | alpha 1,3-galactosyltransferase 2 | 4.19 |
| Aebp1 | AE binding protein 1 | 4.76 |
| Akr1b8 | aldo-keto reductase family 1, B8 | 6.77 |
| C1s | complement component 1, s subcomponent | 5.88 |
| Calcb | calcitonin-related polypeptide, beta | 391.92 |
| Ccl12 | chemokine (C-C motif) ligand 12 | 22.09 |
| Ccl20 | chemokine (C-C motif) ligand 20 | 74.65 |
| Ccr7 | chemokine (C-C motif) receptor 7 | 16.56 |
| Cd177 | CD177 molecule | 70.78 |
| Cd300a | Cd300a molecule | 16.24 |
| Cfi | complement factor I | 8.13 |
| Clca4l | chloride channel calcium activated 4-like | 2119.98 |
| Cxcl11 | chemokine (C-X-C motif) ligand 11 | 32.88 |
| Cxcl9 | chemokine (C-X-C motif) ligand 9 | 32.11 |
| Cym | chymosin | 43.71 |
| Dapl1 | death associated protein-like 1 | 17.79 |
| Derl3 | Der1-like domain family, member 3 | 8.12 |
| Dhrs9 | dehydrogenase/reductase (SDR family) member 9 | 50.89 |
| Eml2 | echinoderm microtubule associated protein like 2 | 5.21 |
| Expi | extracellular proteinase inhibitor | 37.16 |
| Extl1 | exostoses (multiple)-like 1 | 5.19 |
| Fabp4 | fatty acid binding protein 4 | 60.86 |
| Fkbp6 | FK506 binding protein 6 | 5.53 |
| Glycam1 | glycosylation dependent cell adhesion molecule 1 | 35.39 |
| Gpnmb | glycoprotein (transmembrane) nmb | 10.12 |
| Hamp | hepcidin antimicrobial peptide | 15.49 |
| Hpx | hemopexin | 59.01 |
| Ifitm1 | interferon-induced protein with tetratricopeptide repeats 1 | 15.50 |
| Igfbp4 | insulin-like growth factor binding protein4 | 13.22 |
| Il17rb | interleukin 17 receptor B | 28.51 |
| Jak3 | Janus kinase 3 | 5.05 |
| Kcnj15 | potassium inwardly-rectifying channel, subfamily J, member 15 | 24.92 |
| Kng1 | kininogen 1 | 13.65 |
| Kng1l1 | kininogen 1-like 1 | 14.77 |
| Lbp | lipopolysaccharide binding protein | 17.76 |
| Lgals3 | lectin, galactoside-binding, soluble, 3 | 7.39 |
| Lcn2 | lipocalin 2 | 148.20 |
| LOC298795 | similar to 14-3-3 protein sigma | 5.62 |
| LOC299282 | Serine protease inhibitor | 45.41 |
| Mcm5 | minichromosome maintenance complex component 5 | 5.36 |
| Mgp | matrix Gla protein | 8.36 |
| Mt1a | metallothionein 1a | 4.49 |
| Mt2A | metallothionein 2A | 6.48 |
| Myh1 | myosin, heavy polypeptide 1 | 5.09 |
| Myh2 | myosin, heavy chain 2 | 5.46 |
| Myh3 | myosin, heavy chain 3 | 6.13 |
| Myh4 | myosin, heavy chain 4 | 5.37 |
| Myh8 | myosin, heavy chain 8 | 5.76 |
| Oc90 | otoconin 90 | 4.48 |
| Osmr | oncostatin M receptor | 5.64 |
| P2rx1 | purinergic receptor P2X, ligand-gated ion channel, 1 | 3.94 |
| Pmch | pro-melanin-concentrating hormone | 5.81 |
| Pmp2 | peripheral myelin protein 2 | 5.53 |
| Prg4 | proteoglycan 4 | 113.31 |
| Rbp4 | retinol binding protein 4 | 7.31 |
| Rbp7 | retinol binding protein 7 | 8.71 |
| Rrm2 | ribonucleotide reductase M2 | 10.44 |
| S100a5 | S100 calcium binding protein A5 | 174.98 |
| Serpina3n | serine (or cysteine) peptidase inhibitor, clade A, member 3N | 42.62 |
| Sfrp4 | secreted frizzled-related protein 4 | 10.29 |
| Slpi | secretory leukocyte peptidase inhibitor | 223.65 |
| Slpil2 | antileukoproteinase-like 2 | 176.23 |
| Timp1 | TIMP metallopeptidase inhibitor 1 | 111.71 |
| Tmem33 | transmembrane protein 33 | 1.58 |
| Tmprss9 | transmembrane protease, serine 9 | 4.08 |
| Tns4 | tensin 4 | 4.30 |
| Trim25 | tripartite motif-containing 25 | 3.66 |
| Tspan4 | tetraspanin 4 | 5.25 |
| Vmo1 | vitelline membrane outer layer 1 homolog | 51.77 |
| Vtcn1 | V-set domain containing T cell activation inhibitor 1 | 16.45 |
| Downregulated | ||
| Fgf21 | fibroblast growth factor 21 | 67.52 |
| Ifit1 | interferon-induced protein with tetratricopeptide repeats 1 | 28.92 |
| LOC690326 | hypothetical protein LOC690326 | 82.14 |
| Pcdhac2 | protocadherin alpha subfamily C, 2 | 1.39 |
| Rnase1l1 | ribonuclease, RNase A family, 1-like 1 | 3.91 |
| Spock2 | sparc/osteonectin, cwcv and kazal-like domains proteoglycan 2 | 4.56 |
| Spon2 | spondin 2, extracellular matrix protein | 5.16 |
| Vegfa | vascular endothelial growth factor A | 2.22 |
NOTE: q value < 0.05 for all differentially expressed genes
3.6 Acoustic trauma increases individual variation in gene transcript expression levels
Previous investigations have demonstrated significant individual variation in the level of cochlear damage following acoustic trauma (Cody and Robertson, 1983, Luebke and Foster, 2002). We therefore sought to determine whether individual variation exists in gene expression responses to acoustic trauma. To this end, we calculated the CV from the mean FPKM values for the transcripts of each individual gene belonging to either the normal or noise-traumatized samples. The mean CV value for noise-traumatized samples was significantly higher than that for the normal samples (Fig. 4, p < 0.0001, Student’s t-test), suggesting an increase in the level of individual variation after acoustic trauma.
Figure 4. Increase in individual variation in the gene transcript expression levels following acoustic trauma.
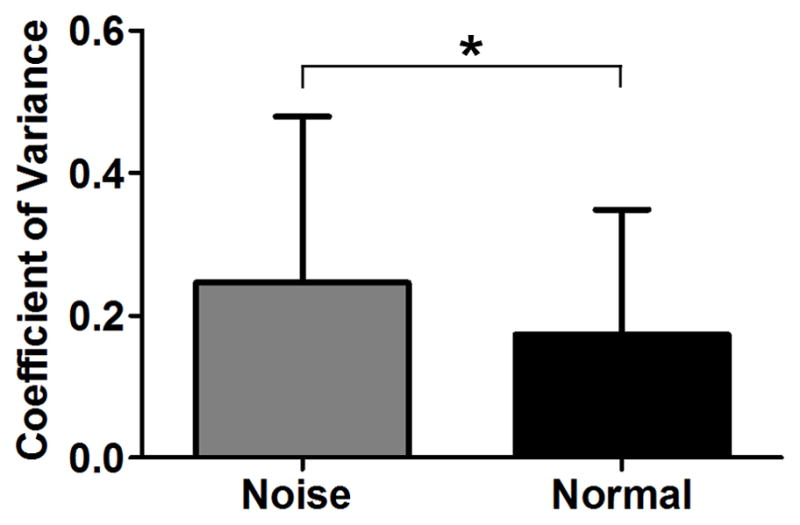
The values of coefficient of variance (CV) were calculated from the mean FPKM values for the transcripts of each individual gene belonging to either the normal or the noise-traumatized samples. The mean CV for the noise-traumatized samples was higher than that for the normal samples (p < 0.0001, Student’s t-test), suggesting that acoustic trauma induces individual variation in gene transcript expression levels across samples. The bars represent standard deviation.
To further illustrate this increase in individual variation following acoustic trauma, we examined the correlation of the expression levels of the genes between individual samples within a group (the noise-traumatized and the normal group) and found that the samples from the normal group had a more stringent correlation (Figs. 5A, 5B and 5C, r = 0.98, p < 0.0001) than the noise-traumatized group (Figs. 5D, 5E and 5F, r = 0.95–0.98, p < 0.0001). Together, these analyses indicate that acoustic trauma increases the individual variation in the expression pattern of cochlear gene transcripts.
Figure 5. Correlation of normal and noise-traumatized FPKM values.

(A, B, C) Correlation of FPKM values between individual samples of the normal cochleae (N1, N2, N3). (D, E, F) Correlation of FPKM values between individual samples of the noise-traumatized cochleae (E1, E2, E3). Pearson’s correlation analysis shows that FPKM values are more stringently correlated within biological replicates for the normal samples (r = 0.98, p < 0.0001) than for the noise-traumatized samples (r = 0.95 – 0.98, p < 0.0001).
3.7 Identification of enriched biological pathways from differentially expressed gene transcripts
The current RNA-seq analysis revealed multiple gene transcripts that are differentially expressed after exposure to intense noise (Table 2). To obtain meaningful information about the involvement of biological responses to acoustic trauma, we sought to identify enriched biological pathways based on the gene transcripts that showed significant expression changes after exposure to noise. Using DAVID, we found five enriched biological pathways that were associated with 17 of the differentially expressed gene transcripts (Table 3). These enriched biological pathways included the following: 1) the chemokine signaling pathway, 2) the cytokine-cytokine receptor interaction pathway, 3) the toll-like receptor signaling pathway, 4) the complement pathway and 5) the viral myocarditis / tight junction (myosin) pathways.
Table 3.
Enriched biological pathways and associated gene transcripts
| Pathway | Gene symbol |
|---|---|
| Myosin Pathway | Myh3 |
| Myh4 | |
| Myh8 | |
| Myh2 | |
| Myh1 | |
| Chemokine | Jax3 |
| Signaling | Ccl12 |
| Pathway | Ccl20 |
| Ccr7 | |
| Cxcl11 | |
| Cytokine-Cytokine | Ccr7 |
| Receptor Pathway | Cxcl11 |
| Cxcl9 | |
| Ill7rb | |
| Osmr | |
| Toll-Receptor | Cxcl11 |
| Signaling Pathway | Cxcl9 |
| Lbp | |
| Complement | Cfi |
| Pathway | C1s |
Among the five enriched biological pathways, the first four are related to the innate immune system. Previous investigations have implicated the chemokine signaling and toll-like receptor signaling pathways in cochlear pathogenesis due to acoustic trauma (Holme and Steel, 2004, Fujioka et al., 2006, Sautter et al., 2006). To the best of our knowledge, the complement pathway (Schlag and Redl, 1987, Bengtsson, 1993, Amour et al., 2004) has not been linked to inner ear pathogenesis. We therefore focused on defining this pathway.
3.8 Confirmation of the complement components in cochlear pathogenesis
To confirm the changes in Cfi and C1s expression revealed by the RNA-seq analysis, we examined the expression levels of these genes using qRT-PCR with three biological repetitions for each experimental condition. In the normal CSE samples, both gene transcripts were identified. One day after the noise exposure, these gene transcripts were upregulated (Fig. 6A, Student’s t-test, p < 0.01), which is consistent with the results of the RNA-seq analysis (Fig. 6B).
Figure 6. Assessment of the expression levels of Cfi and C1s gene transcripts.

(A) Comparison of the expression levels of Cfi and C1s gene transcripts between the normal and noise-traumatized sensory epithelium samples (asterisks indicate p < 0.01, Student’s t-test) (B) The comparison of the changes in the expression levels shown by qRT-PCR and RNA-seq for Cfi and C1s. Both approaches revealed upregulated expression, with similar levels of fold changes. (C) Comparison of the expression levels of Cfi and C1s gene transcripts between the normal and noise-traumatized organ of Corti samples (the asterisk indicates p < 0.01, Student’s t-test). Delta CT value is used to illustrate the gene expression level, with a higher CT value representing a lower expression level. (D) Correlation of the expression levels of 10 complement-related genes between rat samples measured with RNA-seq and mouse samples measured with qRT-PCR.
The CSE contains the cells of the organ of Corti as well as the cells of the non-organ of Corti structure. The organ of Corti, housing the sensory cells, is the major site of acoustic trauma (Brunner, 1976, Rydmarker and Nilsson, 1987, Bohne and Harding, 2000, Nordmann et al., 2000). We therefore wanted to determine whether the change observed in the CSE samples indeed occurs in the cells of the organ of Corti. To this end, we collected sensory-cell-enriched samples containing only the cells belonging to the organ of Corti to re-examine the expression levels of Cfi and C1s. Again, normal samples exhibited strong constitutive expression of Cfi and C1s (Fig. 6C). Cfi was significantly upregulated in the noise-traumatized organ of Corti samples (Student’s t-test, p < 0.01). C1s was also upregulated but not to a statistically significant level (Student’s t-test, p > 0.05).
To provide evidence for the expression of the genes related to the complement system in the sensory cell-enriched samples of other rodent species, we examined the expression of complement-pathway genes in C57BL/6J mice using qRT-PCR. Ten genes were selected (Cr2, Cr4, C6, C9 CD14, C1qbp, C1qb, C1s, C1ra and C2). Among these genes, four (Cr2, Cr4, C6 and C9) that were undetectable or expressed at low levels in rat cochleae examined using RNA-seq were undetectable in mouse cochleae. The remaining genes (CD14, C1qbp, C1qb, C1s, C1ra and C2) that were detectable in the rat cochlea were also detectable in the mouse cochlea. Pearson’s correlation analysis revealed a significant correlation between the rat and mouse models (Fig. 6D; r = −0.67, p = 0.034). The finding that complement system-related genes are constitutively expressed in the cochlea provides additional evidence for the possible involvement of complement genes in the maintenance of cochlear function.
3.9 The protein expression of the complement pathway gene transcripts in the organ of Corti
To further confirm that the complement components are implicated in sensory cell responses to acoustic trauma, we examined the protein expression pattern of Cfi and C1s in the organ of Corti using immunohistochemistry.
In the normal cochleae, Cfi immunoreactivity was found in the nuclei of both the outer and inner hair cells (Figs. 7A, 7B and 7C). The immunoreactivity was homogenous across the cells. The supporting cell nuclei also displayed Cfi immunoreactivity with a staining intensity similar to that observed in the sensory cell nuclei (data not shown). Further inspection of the staining pattern revealed that the immunoreactivity was localized in the peri-nucleolus structure (Fig. 7C inset). To provide additional evidence for the nuclear distribution of the Cfi protein, we extracted the nuclear partition from the cochlear tissues. Western blot analysis showed stronger Cfi reactivity at the 88, 50 and 39 kDa bands in the nuclear extracts than in the cytoplasmic extract from the same tissue (Fig. 7D). The detection of Cfi protein in the nuclear extract of cochlear tissue is consistent with our immunohistochemistry data for Cfi nuclear protein localization.
Figure 7. Immunoreactivity for Cfi in the normal organ of Corti.
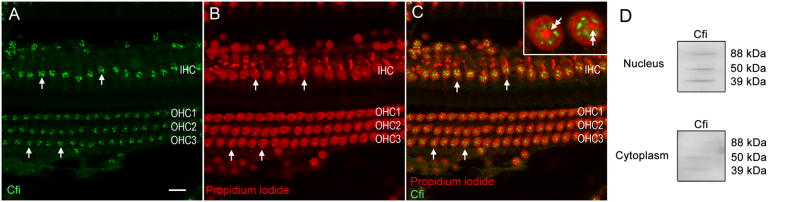
Typical images taken using confocal microscopy showing Cfi immunoreactivity (A), nuclear staining with propidium iodide (B), and the merged images (C) of the Cfi and propidium iodide staining in the normal organ of Corti. Arrows indicate strong Cfi immunoreactivity in the nuclei of three rows of outer hair cells (OHC) and inner hair cells (IHC). The inset image displays staining in the structures surrounding the nucleolus (double arrows), with staining absent in the nucleolus itself. Bar: 10 μm. OHC1, OHC2, and OHC3 mark the first, second and third rows of outer hair cells, respectively. IHC marks the row of inner hair cells. (D).Western blot analysis of Cfi protein in nuclear and cytoplasmic extracts from rat cochlear tissue. The three Cfi bands at 88, 50 and 39 kDa are stronger in the nuclear extract than in the cytoplasmic extract from the same tissue.
The basic pattern of Cfi immunoreactivity in nuclei remained unchanged after the acoustic trauma. However, the homogenous staining intensity that was observed in normal cochleae became heterogeneous in the noise-traumatized cochleae. Certain hair cells showed signs of nuclear condensation (the increase in propidium iodide fluorescence with or without the reduction in the nuclear size), indicating cell degeneration. These cells exhibited either reduced or strong Cfi nuclei staining (Fig. 8). Certain outer hair cell nuclei having a relatively-normal nuclear morphology also displayed reduced Cfi immunoreactivity (Fig. 8). These observations suggest that acoustic overstimulation alters the expression of the Cfi protein and that this change is likely to be associated with the progression of cochlear degeneration.
Figure 8. Cfi immunoreactivity in the organ of Corti following acoustic overstimulation.

Typical images taken using confocal microscopy show Cfi immunoreactivity (A, D), nuclear staining with propidium iodide (B, E) and the merged images of the Cfi and propidium iodide staining (C, F) from two organs of Corti examined 1 day after acoustic trauma. The overall nuclear distribution of Cfi immunoreactivity is preserved. However, a decrease in Cfi immunoreactivity is present in certain hair cells having either a condensed nucleus (double-arrow), which is a sign of degeneration, or normal nuclei (arrows). Cells having condensed nuclei can also display preserved Cfi immunoreactivity (double arrows in D, E and F). Bar: 10 μm. OHC1, OHC2, and OHC3 mark the first, second and third rows of outer hair cells.
Strong C1s immunoreactivity was observed in the junctions between the outer hair cells and Deiters cells and in the pillar cells in the normal organ of Corti (Figs. 9A, 9B and 9C). After the noise exposure, the C1s immunoreactivity increased in the cuticular plates of hair cells with condensed nuclei, a sign of degeneration (Figs. 9D, 9E and 9F). To confirm this observation, we conducted a quantitative analysis for C1s immunostaining using a published image analysis method (Kirkeby and Thomsen, 2005). We first compared the staining intensities of C1s in hair cells and their neighboring supporting cells in each normal cochlea, and then compared the staining intensities in the damaged hair cells and their neighboring supporting cells for each noise-damaged cochlea (Fig. 9G). This analysis revealed that normal hair cells displayed weaker C1s immunoreactivity than their neighboring supporting cells. By contrast, noise-damaged hair cells showed stronger C1s immunoreactivity than their neighbors. This observation suggests that the expression change in C1s protein is associated with sensory cell degeneration.
Figure 9. Immunolabeling of C1s protein in the organ of Corti from normal and noisedamaged cochleae.
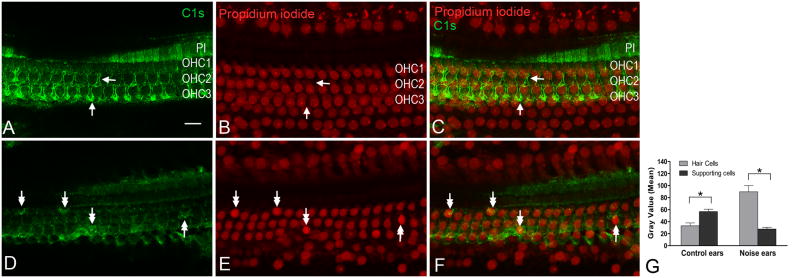
(A, B and C)Typical images taken using confocal microscopy show C1s immunoreactivity (A), nuclear staining with propidium iodide (B) and the merged images (C) of (A) and (B) of the normal organ of Corti. Strong C1s immunoreactivity appears in the pillar cells (PI) and along the contour of Deiters cells (arrows in A and C). (D, E and F) Typical images show C1s immunoreactivity (D), nuclear staining with propidium iodide (E) and the merged images (F) of (D) and (E) of the organ of Corti examined at 1 day after acoustic trauma. After the noise exposure, the staining intensity in the hair cells having condensed nuclei, a sign of degeneration, display increased C1s immunoreactivity in the cuticular plates (double arrows).(G) Comparison of the gray levels measured from hair cells and their neighboring Deiters cells. In the normal cochleae, Deiters cells display a stronger C1s immunoreactivity than their neighboring hair cells. In the noise-damaged ears, the C1s immunoreactivity in the damaged hair cells is stronger than in the Deiters cells. Bar: 10 μm. OHC1, OHC2, and OHC3 mark the first, second and third rows of outer hair cells. Asterisks in Fig. 9G indicate p < 0.01 (Student’s t test).
To confirm the specificity of the antibodies, we performed Western blots for the C1s and Cfi proteins. Cfi staining revealed three bands at 88, 50 and 39 kDa (Fig. 7D) and C1s showed one band at 88 kDa (data not shown), both consistent with the reported molecular weights of these proteins in non-cochlear tissues (Yasojima et al., 1999, Kavanagh et al., 2008). To exclude the possibility of false positive staining due to the secondary antibodies, we stained a few samples with the secondary antibody only. There was no clear fluorescence in these tissues (data not shown).
4.0 Discussion
Comprehensive transcriptome profiling is an important step toward obtaining a better understanding of the molecular mechanisms of acoustic trauma, a multi-factorial disorder. Using the RNA-Seq technique, we reveal multiple novel findings from the analysis of transcriptome sequencing of the normal and noise-traumatized CSE. First, we obtained whole-transcriptome sequencing data, which included over 176 million reads for the normal CSE and over 164 million reads for the noise-traumatized CSE. Second, we found that the levels of gene expression assessed by RNA-seq were comparable to those examined using qRT-PCR, consistent with previous observations using non-cochlear tissues (Gonzalez-Ballester et al., 2010, Xiong et al., 2010, Bonizzoni et al., 2011). Third, we reveal differentially expressed genes, many of which have not been previously implicated in noise-induced cochlear pathogenesis. Finally, we verified the constitutive expression and the expression change of complement genes in the cochlear sensory epithelium and the organ of Corti.
Our RNA-seq analysis revealed over 17000 annotated gene transcripts in the CSE tissue. Transcriptome analysis of rat tissues has previously revealed diverse numbers of transcribed genes, with 11,000 from liver tissue, 27,173 from kidney tissue and 11,963 from GABAergic neurons in the brain (Chen et al., 2011, Su et al., 2011, Wood et al., 2012). Although this diversity in identified gene transcripts may be attributed in part to the differences in experimental protocols, it may also represent the existence of tissue-specific expression profiles. As proposed in a study by Ramskold and colleagues (Ramskold et al., 2009), the more complex profile of the kidney transcriptome may be attributable to its heterogeneous populations of cell with diverse functions, whereas the liver has a less heterogeneous cell population with a specialized function. Here, we obtained over 17,000 annotated gene transcripts. This number is greater than those observed for the liver and brain neuron tissues, possibly due to the high diversity in the cell populations constituting the CSE.
RNA-seq has been previously used in gene expression profiling of rat sensory tissues (Chen et al., 2011, Enoch et al., 2012, Wood et al., 2012). An advantage of this technique over microarray analysis is its ability to provide a more accurate analysis of the abundance of mRNA expression. As demonstrated by our validation experiment, we were able to confirm the constitutive expression of apoptosis-related and complement-related gene transcripts by qRTPCR in the normal CSE. As RNA-seq is accurate and sensitive in detecting transcripts with both high and low abundance (Marguerat and Bahler, 2010, Sengupta et al., 2011, Schulz et al., 2012), it allows us to conduct a more comprehensive analysis of gene expression patterns as well as stress-associated pathways.
Using RNA-seq, we were able to quantify changes in the expression levels of gene transcripts in noise-traumatized CSE, revealing 70 upregulated gene transcripts and 8 downregulated gene transcripts. This upregulation-dominated change has been observed in a previous rat microarray study, in which 34 gene transcripts were upregulated and no gene transcripts were downregulated at 3 h after noise exposure (Kirkegaard et al., 2006). In the current study, from the 70 upregulated gene transcripts, we identified eight gene transcripts (Slpi, Timp1, Kng1, Cxcl9, Cxcl11, Lcn2, Serpina3n and Ccl20) that are associated with inflammatory responses (Nadziejko et al., 1995, Mercer et al., 2005, Sipione et al., 2006, Duchene and Ahluwalia, 2009, Liu et al., 2011, Asaoka et al., 2012, Berard et al., 2012, Meares et al., 2012). Specifically, these gene transcripts, Slpi, Timp1, Kng1 and Cxcl9, had previously been identified as involved in cochlear inflammatory responses to acoustic trauma (Kirkegaard et al., 2006). More recently, two gene transcripts involved in regulating immune responses, Lcn2 and Serpina3n, were also found to be significantly upregulated in the cochlear tissue after acoustic injury (Han et al., 2012). Furthermore, the upregulation of Timp1 identified in our current study was also observed in our previous study, in which we also found Timp1 protein expression in apoptotic sensory cells (Hu et al., 2012). Previously, Timp1 has been identified in multiple cellular processes including cell survival, wound healing and inflammation (Arihiro et al., 2001, Bloomston et al., 2002, Hornebeck, 2003). Together, these observations suggest that investigations of the differentially expressed gene transcripts involved in cochlear immune responses may be important for the development of treatments to reduce inflammation associated with sensory cell damage following acoustic trauma (Hirose et al., 2005, Tornabene et al., 2006).
The discovery that the innate system is involved in cochlear responses to acoustic trauma was further supported by the results of the expression analysis of two gene transcripts (Cfi and C1s) that participate in the complement pathway. Importantly, these expression changes were found not only in the CSE but also in the organ of Corti, the sensory cell-related structure. Previous studies have shown diverse expression levels of the C1 complex subcomponents depending upon the physiological state of the cell (Bensa et al., 1983, Ramadori et al., 1986, de Jonge et al., 2004). Although we observed significant upregulation of C1s following noise exposure, the remaining two subcomponents of the C1 complex, C1q and C1r, were not significantly upregulated. This result may reflect the biological reality. However, it may also be attributable to the small sample size. Moreover, cochlear sensory cell degeneration due to acoustic trauma is a rapid process. The gene transcript expression changes observed immediately following acoustic trauma vary considerably from those changes observed a day later (Taggart et al., 2001, Kirkegaard et al., 2006, Hu et al., 2009, Cai et al., 2012). Because the current investigation examined only one time point post-noise exposure, we were unable to assess whether more members of the complement pathway would be activated during the continuing progression of cochlear degeneration. Thus, future studies involving an increased sample size and additional time points following noise exposure may provide details regarding the participation of the complement pathway in cochlear pathogenesis.
Our current investigation reveals that one of the immediate reactions of the sensory cells following acoustic trauma is to regulate the expression levels of gene transcripts associated with innate immune responses. The functional roles of these gene transcripts in cochlear pathogenesis after acoustic injury are not clear. Several studies have suggested the presence of an innate immune response along with immune cell recruitment in the cochlea following acoustic trauma (Hirose et al., 2005, Tornabene et al., 2006, Miyao et al., 2008, Wakabayashi et al., 2010). Innate immunity is usually activated in the presence of pathogens but can also be activated under stressful conditions including tissue trauma (Paterson et al., 2003, Murphy et al., 2005, Hellewell and Morganti-Kossmann, 2012, Herold et al., 2012). It is important for future investigations to establish the functional relevance of these gene transcripts during the process of noise-induced cochlear degeneration.
In summary, using RNA-seq, we reveal a global view of gene transcript regulation in both the normal and noise-traumatized CSE. We identify differentially expressed genes associated with the innate system in both the CSE and the organ of Corti following acoustic trauma. These transcriptional changes are accompanied with the changes in the expression of the immune-system-associated complement proteins (Cfi and C1s) in the rat CSE. These findings provide new insides into cochlear innate responses following acoustic trauma.
Research Highlights.
RNA-seq reveals global expression profile of genes in cochlear sensory epithelium
RNA-seq data are consistent with qRT-PCR data
Acoustic trauma induces a widespread change in gene expression
Complement pathway is implicated in cochlear responses to acoustic trauma
Acknowledgments
This work was supported by NIH 1R01DC010154 (BHH).
Abbreviations
- CSE
cochlear sensory epithelium
- Cfi
complement factor I
- C1s
complement component 1, s subcomponent
- RNA-Seq
RNA sequencing
- ABR
auditory brainstem response
- TDT
Tucker Davis Technologies
- ANOVA
analysis of variance
- qRT-PCR
quantitative real time PCR
- FPKM
fragments per kilobase of transcripts per million fragments mapped
- CV
coefficient of variance
- DAVID
database for annotation, visualization and integrated discovery
- CT
cycle threshold
- TBS
tris-buffered saline
- TBSt
tris-buffered saline with 0.05% TWEEN-20
- HRP
horseradish peroxidase
Footnotes
Publisher's Disclaimer: This is a PDF file of an unedited manuscript that has been accepted for publication. As a service to our customers we are providing this early version of the manuscript. The manuscript will undergo copyediting, typesetting, and review of the resulting proof before it is published in its final citable form. Please note that during the production process errorsmaybe discovered which could affect the content, and all legal disclaimers that apply to the journal pertain.
Contributor Information
Minal Patel, Email: minalpat@buffalo.edu.
Zihua Hu, Email: zihuahu@ccr.buffalo.edu.
Jonathan Bard, Email: jbard@buffalo.edu.
Jennifer Jamison, Email: jjamison@buffalo.edu.
Qunfeng Cai, Email: qcai@buffalo.edu.
Bo Hua Hu, Email: bhu@buffalo.edu.
References
- Abi-Hachem RN, Zine A, Van De Water TR. The injured cochlea as a target for inflammatory processes, initiation of cell death pathways and application of related otoprotectives strategies. Recent Pat CNS Drug Discov. 2010;5:147–163. doi: 10.2174/157488910791213121. [DOI] [PubMed] [Google Scholar]
- Aittokallio T, Kurki M, Nevalainen O, Nikula T, West A, Lahesmaa R. Computational strategies for analyzing data in gene expression microarray experiments. J Bioinform Comput Biol. 2003;1:541–586. doi: 10.1142/s0219720003000319. [DOI] [PubMed] [Google Scholar]
- Amour A, Bird M, Chaudry L, Deadman J, Hayes D, Kay C. General considerations for proteolytic cascades. Biochem Soc Trans. 2004;32:15–16. doi: 10.1042/bst0320015. [DOI] [PubMed] [Google Scholar]
- Arihiro S, Ohtani H, Hiwatashi N, Torii A, Sorsa T, Nagura H. Vascular smooth muscle cells and pericytes express MMP-1, MMP-9, TIMP-1 and type I procollagen in inflammatory bowel disease. Histopathology. 2001;39:50–59. doi: 10.1046/j.1365-2559.2001.01142.x. [DOI] [PubMed] [Google Scholar]
- Asaoka T, Marubashi S, Kobayashi S, Hama N, Eguchi H, Takeda Y, Tanemura M, Wada H, Takemasa I, Takahashi H, Ruiz P, Doki Y, Mori M, Nagano H. Intragraft transcriptome level of CXCL9 as biomarker of acute cellular rejection after liver transplantation. J Surg Res. 2012 doi: 10.1016/j.jss.2012.07.016. [DOI] [PubMed] [Google Scholar]
- Beane J, Vick J, Schembri F, Anderlind C, Gower A, Campbell J, Luo L, Zhang XH, Xiao J, Alekseyev YO, Wang S, Levy S, Massion PP, Lenburg M, Spira A. Characterizing the impact of smoking and lung cancer on the airway transcriptome using RNA-Seq. Cancer Prev Res (Phila) 2011;4:803–817. doi: 10.1158/1940-6207.CAPR-11-0212. [DOI] [PMC free article] [PubMed] [Google Scholar]
- Bengtsson A. Cascade system activation in shock. Acta Anaesthesiol Scand Suppl. 1993;98:7–10. doi: 10.1111/j.1399-6576.1991.tb05065.x. [DOI] [PubMed] [Google Scholar]
- Bensa JC, Reboul A, Colomb MG. Biosynthesis in vitro of complement subcomponents C1q, C1s and C1 inhibitor by resting and stimulated human monocytes. Biochem J. 1983;216:385–392. doi: 10.1042/bj2160385. [DOI] [PMC free article] [PubMed] [Google Scholar]
- Berard JL, Zarruk JG, Arbour N, Prat A, Yong VW, Jacques FH, Akira S, David S. Lipocalin 2 is a novel immune mediator of experimental autoimmune encephalomyelitis pathogenesis and is modulated in multiple sclerosis. Glia. 2012;60:1145–1159. doi: 10.1002/glia.22342. [DOI] [PubMed] [Google Scholar]
- Bielefeld EC, Wantuck R, Henderson D. Postexposure treatment with a Src-PTK inhibitor in combination with N-l-acetyl cysteine to reduce noise-induced hearing loss. Noise Health. 2011;13:292–298. doi: 10.4103/1463-1741.82962. [DOI] [PubMed] [Google Scholar]
- Bloomston M, Shafii A, Zervos EE, Rosemurgy AS. TIMP-1 overexpression in pancreatic cancer attenuates tumor growth, decreases implantation and metastasis, and inhibits angiogenesis. J Surg Res. 2002;102:39–44. doi: 10.1006/jsre.2001.6318. [DOI] [PubMed] [Google Scholar]
- Bohne BA, Harding GW. Degeneration in the cochlea after noise damage: primary versus secondary events. Am J Otol. 2000;21:505–509. [PubMed] [Google Scholar]
- Bonizzoni M, Dunn WA, Campbell CL, Olson KE, Dimon MT, Marinotti O, James AA. RNA-seq analyses of blood-induced changes in gene expression in the mosquito vector species, Aedes aegypti. BMC Genomics. 2011;12:82. doi: 10.1186/1471-2164-12-82. [DOI] [PMC free article] [PubMed] [Google Scholar]
- Bottomly D, Walter NA, Hunter JE, Darakjian P, Kawane S, Buck KJ, Searles RP, Mooney M, McWeeney SK, Hitzemann R. Evaluating gene expression in C57BL/6J and DBA/2J mouse striatum using RNA-Seq and microarrays. PLoS One. 2011;6:e17820. doi: 10.1371/journal.pone.0017820. [DOI] [PMC free article] [PubMed] [Google Scholar]
- Brunner AW. Bronchioloalveolarcell carcinoma as a solitary nodule (15 cases); 1st part (author’s transl) Schweiz Rundsch Med Prax. 1976;65:1577–1585. [PubMed] [Google Scholar]
- Cai Q, Patel M, Coling D, Hu BH. Transcriptional changes in adhesion-related genes are site-specific during noise-induced cochlear pathogenesis. Neurobiol Dis. 2012;45:723–732. doi: 10.1016/j.nbd.2011.10.018. [DOI] [PMC free article] [PubMed] [Google Scholar]
- Chen H, Liu Z, Gong S, Wu X, Taylor WL, Williams RW, Matta SG, Sharp BM. Genome-Wide Gene Expression Profiling of Nucleus Accumbens Neurons Projecting to Ventral Pallidum Using both Microarray and Transcriptome Sequencing. Front Neurosci. 2011;5:98. doi: 10.3389/fnins.2011.00098. [DOI] [PMC free article] [PubMed] [Google Scholar]
- Cheng AG, Cunningham LL, Rubel EW. Mechanisms of hair cell death and protection. Curr Opin Otolaryngol Head Neck Surg. 2005;13:343–348. doi: 10.1097/01.moo.0000186799.45377.63. [DOI] [PubMed] [Google Scholar]
- Clifford RE, Coleman JK, Balough BJ, Liu J, Kopke RD, Jackson RL. Low-dose D-methionine and N-acetyl-L-cysteine for protection from permanent noise-induced hearing loss in chinchillas. Otolaryngol Head Neck Surg. 2011;145:999–1006. doi: 10.1177/0194599811414496. [DOI] [PubMed] [Google Scholar]
- Cody AR, Robertson D. Variability of noise-induced damage in the guinea pig cochlea: electrophysiological and morphological correlates after strictly controlled exposures. Hear Res. 1983;9:55–70. doi: 10.1016/0378-5955(83)90134-x. [DOI] [PubMed] [Google Scholar]
- Costa V, Angelini C, D’Apice L, Mutarelli M, Casamassimi A, Sommese L, Gallo MA, Aprile M, Esposito R, Leone L, Donizetti A, Crispi S, Rienzo M, Sarubbi B, Calabro R, Picardi M, Salvatore P, Infante T, De Berardinis P, Napoli C, Ciccodicola A. Massive-scale RNA-Seq analysis of non ribosomal transcriptome in human trisomy 21. PLoS One. 2011;6:e18493. doi: 10.1371/journal.pone.0018493. [DOI] [PMC free article] [PubMed] [Google Scholar]
- de Jonge RR, van Schaik IN, Vreijling JP, Troost D, Baas F. Expression of complement components in the peripheral nervous system. Hum Mol Genet. 2004;13:295–302. doi: 10.1093/hmg/ddh029. [DOI] [PubMed] [Google Scholar]
- Di Domenico M, Ricciardi C, Martone T, Mazzarella N, Cassandro C, Chiarella G, D’Angelo L, Cassandro E. Towards gene therapy for deafness. J Cell Physiol. 2011;226:2494–2499. doi: 10.1002/jcp.22617. [DOI] [PubMed] [Google Scholar]
- Duchene J, Ahluwalia A. The kinin B(1) receptor and inflammation: new therapeutic target for cardiovascular disease. Curr Opin Pharmacol. 2009;9:125–131. doi: 10.1016/j.coph.2008.11.011. [DOI] [PubMed] [Google Scholar]
- Enoch MA, Zhou Z, Kimura M, Mash DC, Yuan Q, Goldman D. GABAergic gene expression in postmortem hippocampus from alcoholics and cocaine addicts; corresponding findings in alcohol-naive P and NP rats. PLoS One. 2012;7:e29369. doi: 10.1371/journal.pone.0029369. [DOI] [PMC free article] [PubMed] [Google Scholar]
- Fujioka M, Kanzaki S, Okano HJ, Masuda M, Ogawa K, Okano H. Proinflammatory cytokines expression in noise-induced damaged cochlea. J Neurosci Res. 2006;83:575–583. doi: 10.1002/jnr.20764. [DOI] [PubMed] [Google Scholar]
- Gonzalez-Ballester D, Casero D, Cokus S, Pellegrini M, Merchant SS, Grossman AR. RNA-seq analysis of sulfur-deprived Chlamydomonas cells reveals aspects of acclimation critical for cell survival. Plant Cell. 2010;22:2058–2084. doi: 10.1105/tpc.109.071167. [DOI] [PMC free article] [PubMed] [Google Scholar]
- Granath A, Cardell LO, Uddman R, Harder H. Altered Toll- and Nod-like receptor expression in human middle ear mucosa from patients with chronic middle ear disease. J Infect. 2011;63:174–176. doi: 10.1016/j.jinf.2011.06.006. [DOI] [PubMed] [Google Scholar]
- Guthrie OW, Gearhart CA, Fulton S, Fechter LD. Carboxy alkyl esters of Uncaria tomentosa augment recovery of sensorineural functions following noise injury. Brain Res. 2011;1407:97–106. doi: 10.1016/j.brainres.2011.06.044. [DOI] [PubMed] [Google Scholar]
- Han Y, Hong L, Zhong C, Chen Y, Wang Y, Mao X, Zhao D, Qiu J. Identification of new altered genes in rat cochleae with noise-induced hearing loss. Gene. 2012;499:318–322. doi: 10.1016/j.gene.2012.02.042. [DOI] [PubMed] [Google Scholar]
- Hellewell SC, Morganti-Kossmann MC. Guilty molecules, guilty minds? The conflicting roles of the innate immune response to traumatic brain injury. Mediators Inflamm. 2012;2012:356494. doi: 10.1155/2012/356494. [DOI] [PMC free article] [PubMed] [Google Scholar]
- Henderson D, Bielefeld EC, Harris KC, Hu BH. The role of oxidative stress in noise-induced hearing loss. Ear Hear. 2006;27:1–19. doi: 10.1097/01.aud.0000191942.36672.f3. [DOI] [PubMed] [Google Scholar]
- Herold S, Ludwig S, Pleschka S, Wolff T. Apoptosis signaling in influenza virus propagation, innate host defense, and lung injury. J Leukoc Biol. 2012;92:75–82. doi: 10.1189/jlb.1011530. [DOI] [PubMed] [Google Scholar]
- Hirose K, Discolo CM, Keasler JR, Ransohoff R. Mononuclear phagocytes migrate into the murine cochlea after acoustic trauma. J Comp Neurol. 2005;489:180–194. doi: 10.1002/cne.20619. [DOI] [PubMed] [Google Scholar]
- Holme RH, Steel KP. Progressive hearing loss and increased susceptibility to noise-induced hearing loss in mice carrying a Cdh23 but not a Myo7a mutation. J Assoc Res Otolaryngol. 2004;5:66–79. doi: 10.1007/s10162-003-4021-2. [DOI] [PMC free article] [PubMed] [Google Scholar]
- Hornebeck W. Down-regulation of tissue inhibitor of matrix metalloprotease-1 (TIMP-1) in aged human skin contributes to matrix degradation and impaired cell growth and survival. Pathol Biol (Paris) 2003;51:569–573. doi: 10.1016/j.patbio.2003.09.003. [DOI] [PubMed] [Google Scholar]
- Hu BH, Cai Q. Acoustic overstimulation modifies Mcl-1 expression in cochlear sensory epithelial cells. J Neurosci Res. 2010;88:1812–1821. doi: 10.1002/jnr.22333. [DOI] [PMC free article] [PubMed] [Google Scholar]
- Hu BH, Cai Q, Hu Z, Patel M, Bard J, Jamison J, Coling D. Metalloproteinases and Their Associated Genes Contribute to the Functional Integrity and Noise-Induced Damage in the Cochlear Sensory Epithelium. The Journal of Neuroscience. 2012;32:14927–14941. doi: 10.1523/JNEUROSCI.1588-12.2012. [DOI] [PMC free article] [PubMed] [Google Scholar]
- Hu BH, Cai Q, Manohar S, Jiang H, Ding D, Coling DE, Zheng G, Salvi R. Differential expression of apoptosis-related genes in the cochlea of noise-exposed rats. Neuroscience. 2009;161:915–925. doi: 10.1016/j.neuroscience.2009.03.072. [DOI] [PMC free article] [PubMed] [Google Scholar]
- Hu BH, Henderson D, Nicotera TM. Involvement of apoptosis in progression of cochlear lesion following exposure to intense noise. Hear Res. 2002;166:62–71. doi: 10.1016/s0378-5955(02)00286-1. [DOI] [PubMed] [Google Scholar]
- Hu BH, Henderson D, Nicotera TM. Extremely rapid induction of outer hair cell apoptosis in the chinchilla cochlea following exposure to impulse noise. Hear Res. 2006;211:16–25. doi: 10.1016/j.heares.2005.08.006. [DOI] [PubMed] [Google Scholar]
- Hu BH, Zheng GL. Membrane disruption: an early event of hair cell apoptosis induced by exposure to intense noise. Brain Res. 2008;1239:107–118. doi: 10.1016/j.brainres.2008.08.043. [DOI] [PMC free article] [PubMed] [Google Scholar]
- Huang Q, Lin B, Liu H, Ma X, Mo F, Yu W, Li L, Li H, Tian T, Wu D, Shen F, Xing J, Chen ZN. RNA-Seq analyses generate comprehensive transcriptomic landscape and reveal complex transcript patterns in hepatocellular carcinoma. PLoS One. 2011;6:e26168. doi: 10.1371/journal.pone.0026168. [DOI] [PMC free article] [PubMed] [Google Scholar]
- Jager M, Ott CE, Grunhagen J, Hecht J, Schell H, Mundlos S, Duda GN, Robinson PN, Lienau J. Composite transcriptome assembly of RNA-seq data in a sheep model for delayed bone healing. BMC Genomics. 2011;12:158. doi: 10.1186/1471-2164-12-158. [DOI] [PMC free article] [PubMed] [Google Scholar]
- Kaminski N, Friedman N. Practical approaches to analyzing results of microarray experiments. Am J Respir Cell Mol Biol. 2002;27:125–132. doi: 10.1165/ajrcmb.27.2.f247. [DOI] [PubMed] [Google Scholar]
- Karolchik D, Hinrichs AS, Kent WJ. The UCSC Genome Browser. Curr Protoc Hum Genet. 2011;Chapter 18(Unit18):16. doi: 10.1002/0471142905.hg1806s71. [DOI] [PMC free article] [PubMed] [Google Scholar]
- Kavanagh D, Richards A, Noris M, Hauhart R, Liszewski MK, Karpman D, Goodship JA, Fremeaux-Bacchi V, Remuzzi G, Goodship TH, Atkinson JP. Characterization of mutations in complement factor I (CFI) associated with hemolytic uremic syndrome. Mol Immunol. 2008;45:95–105. doi: 10.1016/j.molimm.2007.05.004. [DOI] [PubMed] [Google Scholar]
- Kawasaki ES. The end of the microarray Tower of Babel: will universal standards lead the way? J Biomol Tech. 2006;17:200–206. [PMC free article] [PubMed] [Google Scholar]
- Kesser BW, Lalwani AK. Gene therapy and stem cell transplantation: strategies for hearing restoration. Adv Otorhinolaryngol. 2009;66:64–86. doi: 10.1159/000218208. [DOI] [PubMed] [Google Scholar]
- Kirkeby S, Thomsen CE. Quantitative immunohistochemistry of fluorescence labelled probes using low-cost software. J Immunol Methods. 2005;301:102–113. doi: 10.1016/j.jim.2005.04.006. [DOI] [PubMed] [Google Scholar]
- Kirkegaard M, Murai N, Risling M, Suneson A, Jarlebark L, Ulfendahl M. Differential gene expression in the rat cochlea after exposure to impulse noise. Neuroscience. 2006;142:425–435. doi: 10.1016/j.neuroscience.2006.06.037. [DOI] [PubMed] [Google Scholar]
- Langmead B, Trapnell C, Pop M, Salzberg SL. Ultrafast and memory-efficient alignment of short DNA sequences to the human genome. Genome Biol. 2009;10:R25. doi: 10.1186/gb-2009-10-3-r25. [DOI] [PMC free article] [PubMed] [Google Scholar]
- Larkin JE, Frank BC, Gavras H, Sultana R, Quackenbush J. Independence and reproducibility across microarray platforms. Nat Methods. 2005;2:337–344. doi: 10.1038/nmeth757. [DOI] [PubMed] [Google Scholar]
- Li SL, Zhang MY, Li BY, Zheng QY, Zhu HL. Toll-like receptor 2 and Toll-like receptor 4 participates in mediation of acute otitis media and mortality in pneumococcal infections in mice. Zhonghua Er Bi Yan Hou Tou Jing Wai Ke Za Zhi. 2011;46:1009–1018. [PubMed] [Google Scholar]
- Lim DJ. Effects of noise and ototoxic drugs at the cellular level in the cochlea: a review. Am J Otolaryngol. 1986;7:73–99. doi: 10.1016/s0196-0709(86)80037-0. [DOI] [PubMed] [Google Scholar]
- Liu Z, Chen X, Wang X, Song CH, Du Y, Su J, Yaseen SA, Yang PC. Chemokine CXCL11 links microbial stimuli to intestinal inflammation. Clin Exp Immunol. 2011;164:396–406. doi: 10.1111/j.1365-2249.2011.04382.x. [DOI] [PMC free article] [PubMed] [Google Scholar]
- Luebke AE, Foster PK. Variation in inter-animal susceptibility to noise damage is associated with alpha 9 acetylcholine receptor subunit expression level. J Neurosci. 2002;22:4241–4247. doi: 10.1523/JNEUROSCI.22-10-04241.2002. [DOI] [PMC free article] [PubMed] [Google Scholar]
- Lundberg E, Fagerberg L, Klevebring D, Matic I, Geiger T, Cox J, Algenas C, Lundeberg J, Mann M, Uhlen M. Defining the transcriptome and proteome in three functionally different human cell lines. Mol Syst Biol. 2010;6:450. doi: 10.1038/msb.2010.106. [DOI] [PMC free article] [PubMed] [Google Scholar]
- Marguerat S, Bahler J. RNA-seq: from technology to biology. Cell Mol Life Sci. 2010;67:569–579. doi: 10.1007/s00018-009-0180-6. [DOI] [PMC free article] [PubMed] [Google Scholar]
- Meares GP, Ma X, Qin H, Benveniste EN. Regulation of CCL20 expression in astrocytes by IL-6 and IL-17. Glia. 2012;60:771–781. doi: 10.1002/glia.22307. [DOI] [PubMed] [Google Scholar]
- Mercer PF, Shute JK, Bhowmik A, Donaldson GC, Wedzicha JA, Warner JA. MMP-9, TIMP-1 and inflammatory cells in sputum from COPD patients during exacerbation. Respir Res. 2005;6:151. doi: 10.1186/1465-9921-6-151. [DOI] [PMC free article] [PubMed] [Google Scholar]
- Miyao M, Firestein GS, Keithley EM. Acoustic trauma augments the cochlear immune response to antigen. Laryngoscope. 2008;118:1801–1808. doi: 10.1097/MLG.0b013e31817e2c27. [DOI] [PMC free article] [PubMed] [Google Scholar]
- Mortazavi A, Williams BA, McCue K, Schaeffer L, Wold B. Mapping and quantifying mammalian transcriptomes by RNA-Seq. Nat Methods. 2008;5:621–628. doi: 10.1038/nmeth.1226. [DOI] [PubMed] [Google Scholar]
- Murphy TJ, Ni Choileain N, Zang Y, Mannick JA, Lederer JA. CD4+CD25+ regulatory T cells control innate immune reactivity after injury. J Immunol. 2005;174:2957–2963. doi: 10.4049/jimmunol.174.5.2957. [DOI] [PubMed] [Google Scholar]
- Nadziejko C, Finkelstein I, Balmes JR. Contribution of secretory leukocyte proteinase inhibitor to the antiprotease defense system of the peripheral lung: effect of ozone-induced acute inflammation. Am J Respir Crit Care Med. 1995;152:1592–1598. doi: 10.1164/ajrccm.152.5.7582300. [DOI] [PubMed] [Google Scholar]
- Nordmann AS, Bohne BA, Harding GW. Histopathological differences between temporary and permanent threshold shift. Hear Res. 2000;139:13–30. doi: 10.1016/s0378-5955(99)00163-x. [DOI] [PubMed] [Google Scholar]
- Oishi N, Schacht J. Emerging treatments for noise-induced hearing loss. Expert Opin Emerg Drugs. 2011;16:235–245. doi: 10.1517/14728214.2011.552427. [DOI] [PMC free article] [PubMed] [Google Scholar]
- Paterson HM, Murphy TJ, Purcell EJ, Shelley O, Kriynovich SJ, Lien E, Mannick JA, Lederer JA. Injury primes the innate immune system for enhanced Toll-like receptor reactivity. J Immunol. 2003;171:1473–1483. doi: 10.4049/jimmunol.171.3.1473. [DOI] [PubMed] [Google Scholar]
- Pomraning KR, Smith KM, Bredeweg EL, Connolly LR, Phatale PA, Freitag M. Library preparation and data analysis packages for rapid genome sequencing. Methods Mol Biol. 2012;944:1–22. doi: 10.1007/978-1-62703-122-6_1. [DOI] [PMC free article] [PubMed] [Google Scholar]
- Ramadori G, Heinz HP, Martin H, Meyer zum Buschenfelde KH, Loos M. Biosynthesis of the subcomponents C1q, C1r and C1s of the first component of complement (C1) by guinea pig hepatocyte primary cultures. Eur J Immunol. 1986;16:1137–1141. doi: 10.1002/eji.1830160918. [DOI] [PubMed] [Google Scholar]
- Ramskold D, Wang ET, Burge CB, Sandberg R. An abundance of ubiquitously expressed genes revealed by tissue transcriptome sequence data. PLoS Comput Biol. 2009;5:e1000598. doi: 10.1371/journal.pcbi.1000598. [DOI] [PMC free article] [PubMed] [Google Scholar]
- Rydmarker S, Nilsson P. Effects on the inner and outer hair cells. Acta Otolaryngol Suppl. 1987;441:25–43. doi: 10.3109/00016488709124799. [DOI] [PubMed] [Google Scholar]
- Sautter NB, Shick EH, Ransohoff RM, Charo IF, Hirose K. CC chemokine receptor 2 is protective against noise-induced hair cell death: studies in CX3CR1(+/GFP) mice. J Assoc Res Otolaryngol. 2006;7:361–372. doi: 10.1007/s10162-006-0051-x. [DOI] [PMC free article] [PubMed] [Google Scholar]
- Schlag G, Redl H. Mediators in trauma. Acta Anaesthesiol Belg. 1987;38:281–291. [PubMed] [Google Scholar]
- Schulz MH, Zerbino DR, Vingron M, Birney E. Oases: robust de novo RNA-seq assembly across the dynamic range of expression levels. Bioinformatics. 2012;28:1086–1092. doi: 10.1093/bioinformatics/bts094. [DOI] [PMC free article] [PubMed] [Google Scholar]
- Sengupta S, Bolin JM, Ruotti V, Nguyen BK, Thomson JA, Elwell AL, Stewart R. Single read and paired end mRNA-Seq Illumina libraries from 10 nanograms total RNA. J Vis Exp. 2011:e3340. doi: 10.3791/3340. [DOI] [PMC free article] [PubMed] [Google Scholar]
- Sengupta S, Ruotti V, Bolin J, Elwell A, Hernandez A, Thomson J, Stewart R. Highly consistent, fully representative mRNA-Seq libraries from ten nanograms of total RNA. Biotechniques. 2010;49:898–904. doi: 10.2144/000113556. [DOI] [PubMed] [Google Scholar]
- Shi L, Perkins RG, Fang H, Tong W. Reproducible and reliable microarray results through quality control: good laboratory proficiency and appropriate data analysis practices are essential. Curr Opin Biotechnol. 2008;19:10–18. doi: 10.1016/j.copbio.2007.11.003. [DOI] [PubMed] [Google Scholar]
- Shi L, Tong W, Goodsaid F, Frueh FW, Fang H, Han T, Fuscoe JC, Casciano DA. QA/QC: challenges and pitfalls facing the microarray community and regulatory agencies. Expert Rev Mol Diagn. 2004;4:761–777. doi: 10.1586/14737159.4.6.761. [DOI] [PubMed] [Google Scholar]
- Sipione S, Simmen KC, Lord SJ, Motyka B, Ewen C, Shostak I, Rayat GR, Dufour JM, Korbutt GS, Rajotte RV, Bleackley RC. Identification of a novel human granzyme B inhibitor secreted by cultured sertoli cells. J Immunol. 2006;177:5051–5058. doi: 10.4049/jimmunol.177.8.5051. [DOI] [PubMed] [Google Scholar]
- Song JJ, Cho JG, Woo JS, Lee HM, Hwang SJ, Chae SW. Differential expression of toll-like receptors 2 and 4 in rat middle ear. Int J Pediatr Otorhinolaryngol. 2009;73:821–824. doi: 10.1016/j.ijporl.2009.02.017. [DOI] [PubMed] [Google Scholar]
- Su Z, Li Z, Chen T, Li QZ, Fang H, Ding D, Ge W, Ning B, Hong H, Perkins RG, Tong W, Shi L. Comparing next-generation sequencing and microarray technologies in a toxicological study of the effects of aristolochic acid on rat kidneys. Chem Res Toxicol. 2011;24:1486–1493. doi: 10.1021/tx200103b. [DOI] [PubMed] [Google Scholar]
- Taggart RT, McFadden SL, Ding DL, Henderson D, Jin X, Sun W, Salvi R. Gene Expression Changes in Chinchilla Cochlea from Noise-Induced Temporary Threshold Shift. Noise Health. 2001;3:1–18. [PubMed] [Google Scholar]
- Tang F, Barbacioru C, Nordman E, Li B, Xu N, Bashkirov VI, Lao K, Surani MA. RNA-Seq analysis to capture the transcriptome landscape of a single cell. Nat Protoc. 2010;5:516–535. doi: 10.1038/nprot.2009.236. [DOI] [PMC free article] [PubMed] [Google Scholar]
- Tariq MA, Kim HJ, Jejelowo O, Pourmand N. Whole-transcriptome RNAseq analysis from minute amount of total RNA. Nucleic Acids Res. 2011;39:e120. doi: 10.1093/nar/gkr547. [DOI] [PMC free article] [PubMed] [Google Scholar]
- Tornabene SV, Sato K, Pham L, Billings P, Keithley EM. Immune cell recruitment following acoustic trauma. Hear Res. 2006;222:115–124. doi: 10.1016/j.heares.2006.09.004. [DOI] [PubMed] [Google Scholar]
- Trapnell C, Pachter L, Salzberg SL. TopHat: discovering splice junctions with RNA-Seq. Bioinformatics. 2009;25:1105–1111. doi: 10.1093/bioinformatics/btp120. [DOI] [PMC free article] [PubMed] [Google Scholar]
- Trapnell C, Williams BA, Pertea G, Mortazavi A, Kwan G, van Baren MJ, Salzberg SL, Wold BJ, Pachter L. Transcript assembly and quantification by RNA-Seq reveals unannotated transcripts and isoform switching during cell differentiation. Nat Biotechnol. 2010;28:511–515. doi: 10.1038/nbt.1621. [DOI] [PMC free article] [PubMed] [Google Scholar]
- Wakabayashi K, Fujioka M, Kanzaki S, Okano HJ, Shibata S, Yamashita D, Masuda M, Mihara M, Ohsugi Y, Ogawa K, Okano H. Blockade of interleukin-6 signaling suppressed cochlear inflammatory response and improved hearing impairment in noise-damaged mice cochlea. Neurosci Res. 2010;66:345–352. doi: 10.1016/j.neures.2009.12.008. [DOI] [PubMed] [Google Scholar]
- Wang Z, Gerstein M, Snyder M. RNA-Seq: a revolutionary tool for transcriptomics. Nat Rev Genet. 2009;10:57–63. doi: 10.1038/nrg2484. [DOI] [PMC free article] [PubMed] [Google Scholar]
- Weeraratna AT, Nagel JE, de Mello-Coelho V, Taub DD. Gene expression profiling: from microarrays to medicine. J Clin Immunol. 2004;24:213–224. doi: 10.1023/B:JOCI.0000025443.44833.1d. [DOI] [PMC free article] [PubMed] [Google Scholar]
- Wilhelm BT, Landry JR. RNA-Seq-quantitative measurement of expression through massively parallel RNA-sequencing. Methods. 2009;48:249–257. doi: 10.1016/j.ymeth.2009.03.016. [DOI] [PubMed] [Google Scholar]
- Wood SH, Craig T, Li Y, Merry B, de Magalhaes JP. Whole transcriptome sequencing of the aging rat brain reveals dynamic RNA changes in the dark matter of the genome. Age (Dordr) 2012 doi: 10.1007/s11357-012-9410-1. [DOI] [PMC free article] [PubMed] [Google Scholar]
- Xiong Y, Chen X, Chen Z, Wang X, Shi S, Zhang J, He X. RNA sequencing shows no dosage compensation of the active X-chromosome. Nat Genet. 2010;42:1043–1047. doi: 10.1038/ng.711. [DOI] [PubMed] [Google Scholar]
- Yang WP, Henderson D, Hu BH, Nicotera TM. Quantitative analysis of apoptotic and necrotic outer hair cells after exposure to different levels of continuous noise. Hear Res. 2004;196:69–76. doi: 10.1016/j.heares.2004.04.015. [DOI] [PubMed] [Google Scholar]
- Yasojima K, Schwab C, McGeer EG, McGeer PL. Up-regulated production and activation of the complement system in Alzheimer’s disease brain. Am J Pathol. 1999;154:927–936. doi: 10.1016/S0002-9440(10)65340-0. [DOI] [PMC free article] [PubMed] [Google Scholar]
- Zhai SQ, Guo W, Hu YY, Yu N, Chen Q, Wang JZ, Fan M, Yang WY. Protective effects of brain-derived neurotrophic factor on the noise-damaged cochlear spiral ganglion. J Laryngol Otol. 2011;125:449–454. doi: 10.1017/S0022215110002112. [DOI] [PubMed] [Google Scholar]