

Background: The mechanism of action of resveratrol on sirtuin and mitochondrial metabolism remains elusive.
Results: Resveratrol increases the mitochondrial NAD+ level by direct stimulation of complex I, leading to a SIRT3-dependent increase in substrate supplies.
Conclusion: Our results link the direct stimulation by resveratrol of NADH oxidation to the SIRT3 activation.
Significance: Mitochondrial NAD+/NADH ratio is a critical parameter mediating resveratrol effect on mitochondrial function.
Keywords: Mitochondria, Mitochondrial Metabolism, NAD, Resveratrol, Sirtuins, Complex I, NADH Dehydrogenase
Abstract
Resveratrol (RSV) has been shown to be involved in the regulation of energetic metabolism, generating increasing interest in therapeutic use. SIRT1 has been described as the main target of RSV. However, recent reports have challenged the hypothesis of its direct activation by RSV, and the signaling pathways remain elusive. Here, the effects of RSV on mitochondrial metabolism are detailed both in vivo and in vitro using murine and cellular models and isolated enzymes. We demonstrate that low RSV doses (1–5 μm) directly stimulate NADH dehydrogenases and, more specifically, mitochondrial complex I activity (EC50 ∼1 μm). In HepG2 cells, this complex I activation increases the mitochondrial NAD+/NADH ratio. This higher NAD+ level initiates a SIRT3-dependent increase in the mitochondrial substrate supply pathways (i.e. the tricarboxylic acid cycle and fatty acid oxidation). This effect is also seen in liver mitochondria of RSV-fed animals (50 mg/kg/day). We conclude that the increase in NADH oxidation by complex I is a crucial event for SIRT3 activation by RSV. Our results open up new perspectives in the understanding of the RSV signaling pathway and highlight the critical importance of RSV doses used for future clinical trials.
Introduction
Resveratrol (RSV),3 a natural polyphenolic antioxidant, possesses a wide range of biological properties, including protective effects on the nervous (1) and cardiovascular systems (2). RSV appears to be a major regulator of energetic metabolism, ameliorating the glucose homeostasis in obese mice (3, 4), increasing fatty acid oxidation (FAO) (5), and inducing the expression of genes involved in mitochondrial biogenesis (4). Mitochondria, encompassing catabolic pathways (FAO and the tricarboxylic acid cycle (TCA)), providers of reduced substrates (NADH and FADH2) from fatty acids and carbohydrates to the oxidative phosphorylation, appear to be a preferential target of RSV. The effects of high RSV doses (10–100 μm) on mitochondrial metabolism have been investigated in various models, and most of the studies have reported an increase in mitochondrial biogenesis through a sirtuin-dependent pathway. Sirtuins are a family of NAD-dependent deacetylases, among which three isoforms (SIRT3, -4, and -5) are located in the mitochondrial compartment (6). Computational studies have shown that up to 20% of mitochondrial proteins can be acetylated on their lysine residues and are therefore putatively regulated by sirtuins (7). SIRT3, the most extensively studied mitochondrial sirtuin, has been shown to regulate the activity of key enzymes of mitochondrial metabolic pathways, such as succinate dehydrogenase (SDH) and isocitrate dehydrogenase (TCA enzymes) and long-chain fatty acid dehydrogenase (FAO) in a nutrient-sensitive fashion (8–12). SIRT3 is also involved in the regulation of oxidative phosphorylation through the deacetylation of complex I and succinate dehydrogenase subunits (8, 9). The other mitochondrial sirtuins, SIRT4 and SIRT5, may target FAO and urea cycle enzymes. Although not found in the mitochondria, SIRT1 is considered as an important regulator of metabolism, able to activate both mitochondrial biogenesis by transcriptional activation of the PGC1-related signaling pathway (11, 13) and the energetic metabolic fluxes by allosteric post-translational modifications of key enzymes. In addition, SIRT1 is reported to be the main target of RSV (10, 12). However, the direct interaction between RSV and SIRT1 has been increasingly challenged during the last few years (14–16), and the signaling pathways linking RSV and sirtuin activation remain to be clarified. The hypothesis of indirect activation of sirtuins through the modulation of NAD+ concentration is now favored (17, 18), and mitochondria concentrate a significant part of the cellular NAD+ pool (19). Thus, in this study, the effect of low RSV dose (1–5 μm) on mitochondrial metabolism and the signaling pathways involved were analyzed by using three different models (in vitro study on isolated enzymes, HepG2 cells treated with RSV, and an aging model of mice fed with RSV).
MATERIALS AND METHODS
Reagents
trans-Resveratrol (3,5,4′-trihydroxy-trans-stilbene), triacetyl-resveratrol (3,5,4′-triacetyl-trans-stilbene), and gallotannin were purchased from Sigma-Aldrich. Compound C (6-[4-(2-piperidin-1-yl-ethoxy)-phenyl)]-3-pyridin-4-yl-pyrrazolo[1,5-a]-pyrimidine), SIRT1 inhibitor III (6-chloro-2,3,4,9-tetrahydro-1H-carbazole-1-carboxamide, alternatively named EX-527; IC50 = 98 nm, 19.6, and 48.7 μm for SIRT1, SIRT2, and SIRT3, respectively) was obtained from Merck. Quality and purity of trans-resveratrol was checked by spectrum analysis before use.
Cell Culture
Human hepatocarcinoma HepG2 cells (ATCC number HB-8065) were cultured in Dulbecco's minimum essential medium (DMEM/F-12, JBOY Institute of Biotechnology, Reims, France) supplemented with 10% fetal bovine serum (FBS), 1% l-glutamine (PAA, Pasching, Austria) at 37 °C, 5% CO2. The medium was supplemented with either vehicle (ethanol, 1:5000) or RSV (1, 5, or 50 μm) for 48 h. Cellular toxicity assays showed no toxicity or antiproliferative effect at up to 5 μm RSV. For knockdown experiments, cells were reverse-transfected with SIRT3 siRNAs or two different scrambled siRNAs (Santa Cruz Biotechnology, Inc.) by incubation with LipofectamineTM RNAiMAX transfection reagent (Invitrogen). 24 h after siRNA transfection, the medium was supplemented with either vehicle or RSV (1 μm) for 48 h. The expression of SIRT3 was decreased by 60% (quantitative PCR measurement; Fig. 1A), and the corresponding protein level was decreased by 80 ± 9% for SIRT3 siRNA (Fig. 1A), whereas scrambled siRNA had no effect on any SIRT isoform expression.
FIGURE 1.
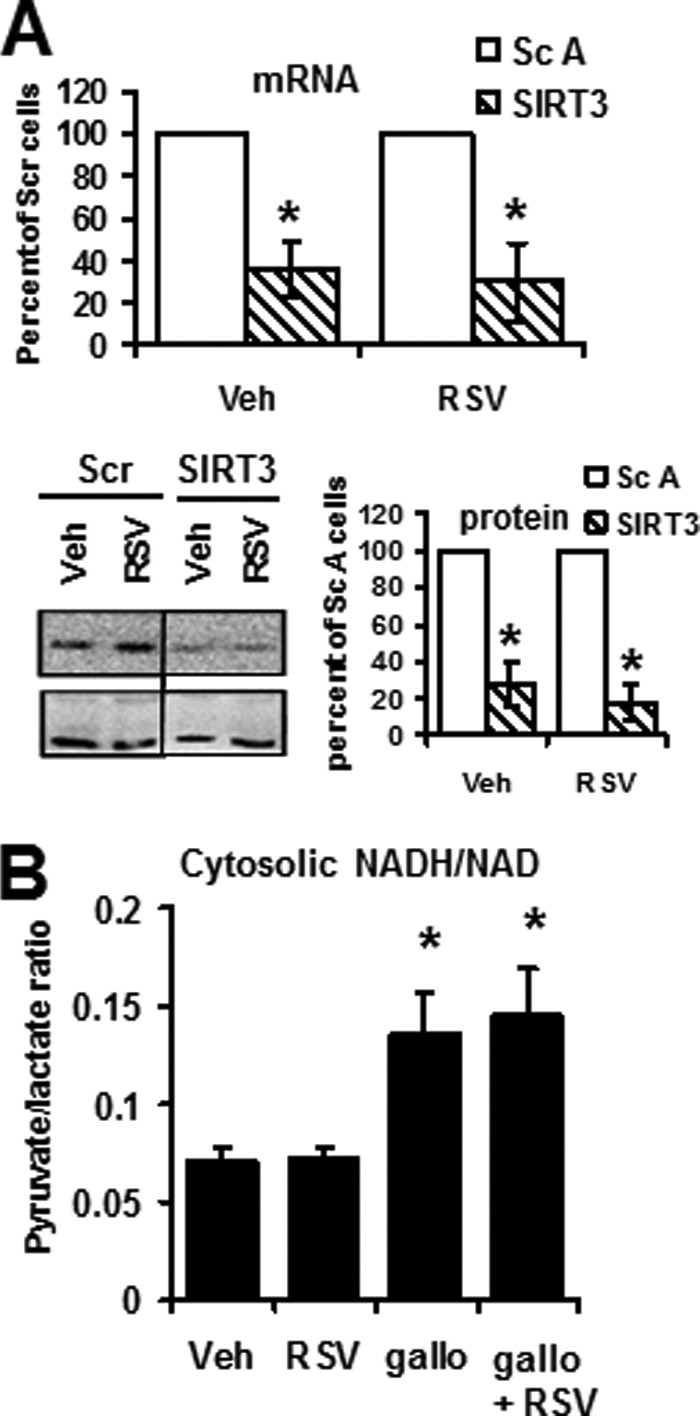
Control of SIRT3 silencing and of the effect of gallotannin treatment in HepG2 cells. A, control of SIRT3 knockdown by siRNA. SIRT3 knockdown was determined at the mRNA level by qPCR (SIRT3/actin ratio calculated with the −2ΔΔCt method for these two genes with similar amplification efficiency) and at the protein level by Western blot (SIRT3 (upper panel)/HSP60 (lower panel) ratio). Results are expressed as a percentage of scrambled transfected cells and represent the mean ± S.E. (error bars) of six experiments. *, significant differences (p < 0.05) compared with scrambled-transfected cells. B, effect of gallotanin versus RSV on the NAD+/NADH cytosolic ratio. The cytosolic NAD+/NADH ratio was calculated as the ratio of pyruvate/lactate concentrations measured in the HepG2 cell culture medium after 48 h of incubation with vehicle (Veh; ethanol, 1:5000), RSV (RSV; 1 μm), gallotannin (gallo; 1 mm) or gallotannin + RSV (gallo + RSV). Results are expressed as the mean ± S.E. of eight experiments.
Animals
Male C57BL/6J strain mice (Janvier, Le Genest-St-Isle, France) were housed in a room at 24 ± 2 °C with a 12-h/12-h light/dark cycle, with diet and water ad libitum. Two groups were used: young (Y) (aged 6 months) and old mice (O) (aged 22 months). Twelve weeks before euthanasia, half of each group received a standard diet (M20 croquettes (SDS®, Y Ctl and O Ctl groups), and the other half received a diet of M20 croquettes supplemented with 0.04% trans-resveratrol (Yvery®, Y RSV and O RSV groups). After 12 weeks of RSV diet, mice were anesthetized with isoflurane before decapitation and dissection of the liver, in accordance with European Community guidelines (directive 86/609/CEE), and the Ethical Committee of the University of Paris-Descartes (CEEA34.SB.008.12). RSV accumulation in liver was checked according to Menet et al. (20); the concentration of RSV and its derivates was 1.29 ± 0.19 and 2.17 ± 0.46 μmol/kg in young and old RSV mice, respectively (undetectable in control groups).
Determination of Cellular Concentrations of NADH and NAD+
NADH and NAD+ concentrations were measured using the NAD/NADH assay kit (Abcam, Paris, France) on lysates from 2 × 10⁶ cells filtered under a 10-kDa column according to the manufacturer's instructions. The cytosolic NAD(H)-redox state was determined using the metabolite indicator method (i.e. the lactate dehydrogenase reaction) (21, 22). Lactate concentration was measured using the lactate oxidase reaction (Lactate Assay Kit, Abbott), and pyruvate concentration was measured using a pyruvate assay kit (DiaSys, Condom, France) according to the manufacturers' instructions.
NAD(P)H Autofluorescence Imaging
HepG2 cells were grown in two-well glass chambers (Lab-TekTM Chamber SlideTM System, Nunc, Langenselbold, Germany) for 2 days and treated with vehicle (ethanol, 1:5000), RSV (1 μm), or rotenone (10 nm). Before acquisition, the cells were thoroughly washed with medium without phenol red, with or without drugs. NAD(P)H autofluorescence signals were acquired with a Leica microscope (DMI6000B, Microsystems, Nanterre, France; excitation wavelength, 330 nm; emission wavelength, 450 nm) equipped with a Roper CoolSnap HQ2 camera (Roper Scientific, Tucson, AZ) and with a high sensitivity CCD camera for quantitative fluorescence microscopy. Metamorph® version 7.6 software (Molecular Devices, Saint-Grégoire, France) was used for acquisition driving (2 s) and image analysis. Measurements were performed at 37 °C. For quantitative analysis, 1 × 10⁷ fresh HepG2 cells were resuspended in DMEM/F-12 without red phenol and placed in an UV quartz cuvette. Cell autofluorescence was measured on a fluorimeter by exciting the cell suspension at 340 nm and reading the fluorescence at 450 nm according to Ref. 23. To measure non-mitochondrial NAD(P)H autofluorescence, 10 μm m-Cl-CCP was added to the cuvette (0% autofluorescence). The 100% autofluorescence was obtained by adding 5 μm rotenone + 1 mm KCN to the cell suspension.
Isolation of Mitochondria from HepG2 Cells
Mitochondria were isolated from a pellet of 8 × 10⁷ HepG2 cells treated for 48 h either with vehicle (ethanol, 1:5000) or with RSV (1 μm). Briefly, cells were harvested, washed once with cold PBS, and resuspended in isolation buffer (100 mm saccharose, 50 mm KCl, 50 mm Tris/HCl, 5 mm EGTA, pH 7.4). Cell membranes were disrupted using digitonin (10 μg/106 cells, 10 min at 4 °C), and mitochondria were pelleted by centrifugation (10,000 × g, 10 min at 4 °C). Mitochondrial pellet was washed twice in isolation buffer and resuspended in respiration buffer (10 mm KH2PO4, 300 mm mannitol, 10 mm KCl, 5 mm MgCl2, 1 mg/ml BSA, pH 7.4). Quality of the mitochondrial preparation was controlled by oxygraphic analysis; more precisely, cytochrome c was added to check membrane integrity, and the absence of NAD+ leakage during the isolation procedure was checked by NAD+ supplementation during maximal, ADP-stimulated, respiration.
Isolation of Mitochondria from Mouse Tissues
Liver and brain mitochondria were isolated as described elsewhere (24, 25). The entire operation was performed at 4 °C and completed in less than 1 h.
Mitochondrial Respiration Rates
Oxygen consumption was measured on isolated mitochondria as described previously (24, 25) at 37 °C on a high resolution oxygraph (Oroboros, Innsbruck, Austria), using substrates of complexes I, I + III, II, IV, FAO, and the glyceraldehyde-3-phosphate dehydrogenase (GAPDH) shuttle as described elsewhere (24, 25): complex I substrate, 5 mm malate and 2.5 mm pyruvate; complex I and II substrate, 5 mm malate, 2.5 mm pyruvate, and 5 mm succinate; complex II substrate, 10 mm succinate supplemented with 10 μm rotenone; complex IV substrate, 5 mm N,N,N′,N′-tetramethyl-p-phenylenediamine reduced with 50 mm ascorbate. 40 μm palmitoyl-l-carnitine + 2.5 mm malate was used to induce liver β-oxidation, and 20 mm glycerol 3-phosphate was used to initiate the GAPDH shuttle. The active state of respiration (coupled respiration) was initiated by the addition of a saturating ADP concentration (0.5 mm). Cytochrome c was added (8 μm) to check the integrity of outer mitochondrial membranes.
Mitochondrial Enzymatic Activities
The activities of the mitochondrial OXPHOS complexes (I–IV) and TCA and FAO enzymes were measured at 37 °C on a UVmc2 spectrophotometer (SAFAS, Monaco) as described elsewhere (26–28). Activity of the NADH ubiquinone reductase (complex I), succinate ubiquinone reductase (complex II), ubiquinol cytochrome c reductase (complex III), cytochrome c oxidase (complex IV), and citrate synthase (CS) were measured according to the method described by Medja et al. (27). NADH ubiquinone reductase activity was assayed in KH2PO4 buffer (50 mm, pH 7.5), containing fatty acid-free BSA (3.75 mg/ml), 0.1 mm decylubiquinone, and 0.10 mm NADH was added to initiate the reaction. Parallel measurement in the presence of rotenone (5 μm) was used to determine the background rate. NADH dehydrogenase activity of complex I was measured in the same medium using 0.05 mm NADH as substrate, but decylubiquinone was replaced by ferricyanide (1 mm FeKCN) as electron acceptor. For the measurement of SDH, the electron acceptor decylubiquinone was replaced by phenazine methosulfate (1 mm), and the reduction of 2,6-dichloroindophenol (50 μm) in the presence of 30 mm succinate, 5 μg/ml antimycin, and 10 μm rotenone was followed at 600 nm. GAPDH activity was measured in 50 mm KH2PO4 buffer, pH 7.5, supplemented with 2.5 mg/ml BSA, 1 mm phenazine methosulfate, and 50 μm 2,6-dichloroindophenol. The addition of 30 mm glycerol 3-phosphate activated the reaction. The same reaction medium was used for measurement of long-chain fatty acid dehydrogenase activity with palmitoyl-CoA as substrate. Isocitrate dehydrogenase activity was measured by following the appearance of NADH using 0.8 mm NAD+ and NADP+ and 10 mm isocitrate as substrates in a mixture containing 2 mm CaCl2, 0.2 mm EDTA, and 10 mm MgCl2, in 50 mm KH2PO4 buffer, pH 7.5 (26). For complex I and l-lactate dehydrogenase (LDH) activity on HepG2 cells, cell pellets were homogenized in cell buffer (250 mm saccharose, 20 mm Tris, 2 mm EGTA, 1 mg/ml bovine serum albumin, pH 7.2). The activity of LDH was measured in a reaction mix comprising 100 mm KH2PO4, pH 7.1, 0.25% Triton X-100, 2.5 mm pyruvate. The reaction was initiated in the presence of 0.1 mm NADH, and the NADH disappearance was recorded at 340 nm at 37 °C. For complex I measurement, cells were further disrupted by one freezing in liquid nitrogen followed by rapid thawing at 37 °C. Lysates were then enriched in mitochondria by centrifugation (16,000 × g, 1 min at 4 °C), washed once in cell buffer (250 μl/106 cells), and sonicated (6 × 5 s with a Branson Sonic Power sonicator (GlaxoSmithKline) on ice. Complex I (NADH ubiquinone reductase) activity was immediately assayed in KH2PO4 buffer (80 mm, pH 7.4), containing 1 mm KCN, 2 mm NaN3, 0.1 mm ubiquinone-1, and 75 μm 2,6-dichlorophenolindophenol. 0.10 mm NADH was added to initiate the reaction. Rotenone (5 μm) was used to determine the background rate. NADH:FMN dehydrogenase (FMNdH; EC 1.5.1.39), formate:NAD+ oxidoreductase (FDH; EC 1.2.1.2), LDH (EC 1.1.1.27), aldehyde:NAD+ oxidoreductase (ADH; EC 1.1.1.1), and l-glutamate:NAD(P)+ oxidoreductase (GDH; EC 1.4.1.3) (Roche Applied Science) activities were measured according to the manufacturer's instructions. FMNdH and FDH activities were measured at 30 °C, GDH and LDH at 37 °C, and ADH at 25 °C. Initial rates (vi) were determined using true initial tangent of the measured optic densities according to time.
UV-visible Spectroscopy
The UV-visible absorption spectra of RSV and BSA in the presence and absence of enzymes were recorded on a SAFAS UVmc2 spectrophotometer equipped with 1.0-cm quartz cells with a slit of 2 nm and scan speed of 200 nm·min−1. The absorbance assessments were performed at pH 7.0 in KH2PO4 50 mm buffer, 25 °C. Each spectrum is an average of at least two scans.
Western Blotting
Mitochondrial proteins (20–50 μg) solubilized in Laemmli buffer were resolved by 8 or 12.5% SDS-PAGE, transferred to PVDF membrane as described elsewhere (24), and incubated with primary monoclonal antibodies overnight at 4 °C (subunits of respiratory chain: mouse monoclonal antibodies (Mitosciences, Eugene, OR); mitochondrial biogenesis, rabbit monoclonal anti-PGC1α and goat anti-TFAM antibodies (Santa Cruz Biotechnology, Inc.); phospho-AMPK/total AMPK, rabbit antibodies against AMPKα1/α2 and phospho-AMPKα (Cell Signaling Technology)).
Deacetylation Analysis
For immunoprecipitations, 50 × 106 HepG2 cells were solubilized in Lysis Buffer (150 mm NaCl, 50 mm Tris, pH 8, 1 mm dithiothreitol, 1% deoxycholate, 0.1% Triton X-100, antiproteases (Complete, Roche Applied Science), 1 mm PMSF, 10 mm nicotinamide, and 1 mm sodium butyrate). Complex II immunocapture kit and p53 immunocapture kit (MitoSciences) were used to purify complex II and p53 from HepG2 cells according to the manufacturer's instructions. The following antibodies were then used for immunoblotting: mouse monoclonal anti-complex II 70 kDa (Mitosciences), mouse monoclonal anti-p53 (Abcam), and rabbit polyclonal anti-acetyl-lysine (Abcam) antibodies.
Computational Modeling
The structures of trans-RSV and triacetyl-RSV were automatically docked into the NADH:FMNdH enzyme using FlexX software (part of the LeadIT software (Biosolve IT)) in the presence of cofactors (NADH and FMN).
Statistical Analysis
Statistical comparisons between Ctl and RSV mice were made with the Mann-Whitney U test. The Wilcoxon test for paired data was used for the analysis of the effects of inhibitors or drugs. Differences were considered statistically significant at p < 0.05.
RESULTS
In Vitro, RSV Inhibits NAD+ Hydrogenases and Activates NADH Dehydrogenases
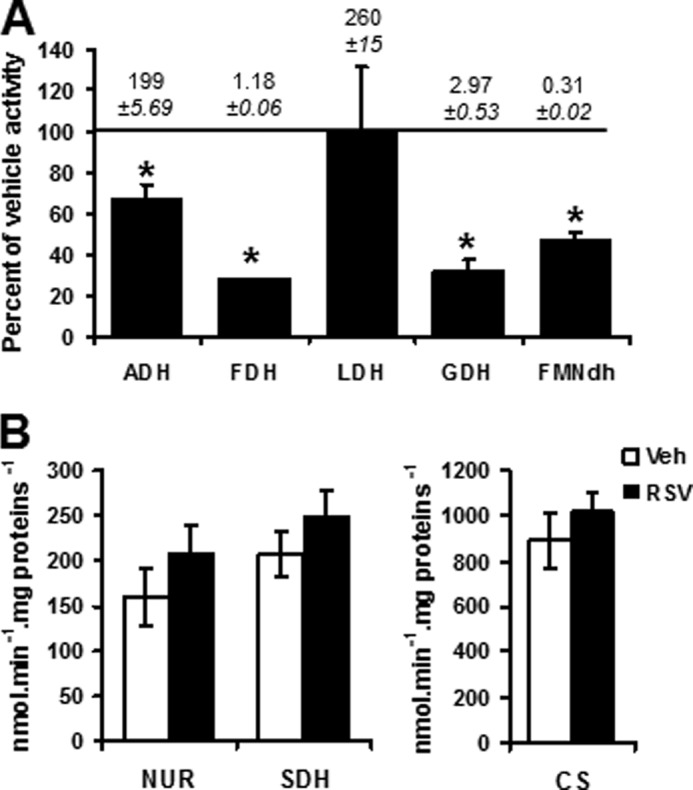
The inhibitory action of 20 μm RSV on an NAD+-dependent enzyme, aldehyde dehydrogenase, has been previously reported (29). This inhibition of NAD+:aldehyde reduction reaction at 5 μm RSV is confirmed by the present results (Fig. 2A). The exact mechanism is currently not precisely known, but it is thought to imply the binding of RSV to the enzyme-NADH complex. Thus, we postulated that RSV could directly alter the kinetic parameters of other NAD+/NADH-metabolizing enzymes. One of the simplest examples of NAD+-dependent dehydrogenation is catalyzed by NAD+-dependent FDH. RSV inhibited the NAD+-dependent FDH reaction in the 1–5 μm range (Fig. 2A, Vmax = 1.187 and 0.740 μmol·min−1·mg protein−1 with vehicle and 5 μm RSV, respectively). The addition of RSV slightly increased the activity of LDH and directly stimulated GDH and FMNdH (Fig. 2A). The strongest increase was observed for FMNdH activity. Lineweaver-Burk plots of FMNdH activity according to NADH concentrations (0.05–0.2 mm) indicated that the addition of RSV altered both the Vmax and the Km of the enzyme for NADH (Fig. 2B, left). The increase in FMNdH activity was not observed using the triacetyl-RSV derivate (Ac; Fig. 2B, right), which possesses acetylated groups instead of the hydroxyl ones and a higher steric hindrance.
FIGURE 2.

RSV in vitro inhibits NAD+ hydrogenases and activates NADH dehydrogenases. A, effect of RSV on activity of isolated ADH, FDH, LDH, GDH, and FMNdH. Activities of NAD+/NADH-dependent enzymes were measured at 30 °C for FMN and FDH, at 37 °C for GDH and LDH, and at 25 °C for ADH on purified enzymes incubated with vehicle (ethanol, 1:5000) or RSV at 1 or 5 μm. Results are expressed as a percentage of vehicle activity. Absolute values were 199 ± 5.69, 1.18 ± 0.06, 260 ± 15, 2.97 ± 0.53, and 0.31 ± 0.02 μmol·min−1·mg of protein−1 for ADH, FDH, LDH, GDH, and FMNdH, respectively. Data represent the mean ± S.E. (error bars) (n = 5). *, significant differences (p < 0.05) compared with vehicle. B, detailed effects of RSV on isolated FMNdH activity. FMNdH activity was monitored on purified enzyme after the addition of vehicle (Veh; ethanol, 1:1000) or RSV. Left, Lineweaver-Burk plot showing the effect of RSV on enzymatic activity in presence of different NADH, H+ (50, 100, or 200 μm), and RSV (0 and 5 μm) concentrations. Vmax values are expressed in nmol·min−1·mg of protein−1, and Km is expressed in mm NADH. Right, effect of RSV on enzymatic activity in the presence of different RSV analogs (trans-RSV or triacetyl-RSV; 0, 1, or 5 μm). Results shown are representative of n = 4 independent preparations. C, in silico prediction of the binding of trans-RSV (C1) or triacetyl-RSV (C2) to the FMNdH in the presence of NAD+ using FlexX software. D, UV-visible adsorption spectra of RSV. D1, adsorption spectra of trans-RSV and triacetyl-RSV in the absence or presence of NAD+, FMNdH, or pyruvate kinase (5 μg·ml−1). D2, adsorption spectra of trans-RSV in the absence or presence of NAD+ and various concentrations of FMNdH (1, 2, 5, 10, and 20 μg·ml−1) or in the absence or presence of various concentrations of BSA (top inset; 50, 250, 375, 500, and 750 μg·ml−1). E, effect of RSV on complex I activity. E1, NUR (rotenone-sensitive) and NFR activities of complex I were measured on preparation of isolated, disrupted liver mitochondria after incubation with increasing RSV concentrations (0.05–5 μm; left). Absolute values for NUR and NFR activities were 193 ± 30 and 573 ± 81 nmol·min−1·mg of protein−1, respectively, for vehicle conditions and 384 ± 19 and 3540 ± 791 nmol·min−1·mg of protein−1, respectively, for RSV 5 μm. E2, dose-response plot normalized to the maximal stimulation of NFR activity for EC50 determination. E3, effect of either trans-RSV or triacetyl-RSV (0, 1, or 5 μm) on NUR activity. Data represented the mean ± S.E. (n = 5). *, significant differences (p < 0.05) compared with vehicle.
It has been shown previously that the biological activity of RSV and its metabolites depends on concurrent direct binding with its various molecular targets, as quinone reductase 2, COX-1/2, aldehyde dehydrogenase, and the mitochondrial F1-ATP synthase among others (30). The loss of potency using triacetyl-RSV, presenting a higher steric hindrance, also suggested a physical interaction of resveratrol with the enzyme. Computational modeling showed that trans-RSV could be located in the core of the FMNdH (Fig. 2, C1), whereas the triacetyl-RSV form would preferentially interact with an external site of the enzyme (Fig. 2, C2). Moreover, it was proposed that RSV and NAD+ substrate mutually cooperate to increase their binding to enzymes (29). UV-visible measurements of RSV derivates in the absence or presence of NAD+ and FMNdH were realized to estimate the quenching of RSV absorption by the enzyme. The absorption spectrum of trans-RSV in 100% ethanol showed absorption peaks at 317 and 306 nm (Fig. 2, D1 and D2), in agreement with published results (31). In the presence of NAD+, a significant increase in UV absorption was observed for trans-RSV, and the maximum absorbance shifted to 303–306 nm. The addition of the FMNdH resulted in a dose-dependent decrease in this UV absorbance (Fig. 2, D2), from 10 to 25% with 1 μg to 20 μg·ml−1 of the enzyme. By contrast, the enzyme addition did not change the absorbance of NAD+ alone. A decrease in RSV absorption was also observed with bovine serum albumin (Fig. 2, D2 (inset)), known to bind to RSV (32). Only a slight reduction (5%) was observed upon the addition of FMNdH to RSV in the absence of NAD+ (Fig. 2, D1). The addition of pyruvate kinase, which was not identified to bind to RSV by computational analysis, did not modify RSV absorption, either in the absence or in the presence of NAD+. Overall, this suggested a direct binding of RSV to the enzyme in the presence of NAD+.
Complex I of the mitochondrial respiratory chain is an essential NADH dehydrogenase for cell metabolism. This enzyme is a multimeric structure comprising an FMN moiety covalently linked to the complex at the active site for NADH oxidation. The mechanism of the complex I redox reaction comprises NADH oxidation by the flavin (NADH:FeKCN reductase (NFR) activity), followed by the transfer of two electrons to bound quinone (NADH:ubiquinone reductase (NUR) activity). On isolated, disrupted mitochondria, the addition of 0.05–5 μm RSV both increased NUR and NFR activity in a dose-dependent manner (Fig. 2, E1), with an EC50 of 0.94 ± 0.087 μm (Fig. 2, E2). A greater increase was observed for NFR than for NUR (Fig 2, E1), suggesting that RSV directly modified the kinetic parameters of the dehydrogenase part of complex I. Here again, the triacetyl-RSV analog had no effect on enzyme activity (Fig 2, E3).
In Situ, RSV Activates NADH Dehydrogenase Enzymes and Mitochondrial NADH Oxidation, Which Increases NAD+/NADH Ratio
We next investigated whether RSV modulated NUR activity in situ at the active dose determined by in vitro study (i.e. roughly 1 μm). In HepG2 cells, the activity of NUR was increased by RSV (+82.4 ± 25.0% for RSV 1 μm and +171.91 ± 43.1% for RSV 5 μm compared with vehicle-treated cells; Fig. 3A, left). These data indicated that RSV also activated NUR in situ. The effect of RSV on cytosolic NADH dehydrogenases was also investigated. The LDH plays a central role in cellular metabolism and NADH/NAD+ equilibrium. Our results showed that RSV also stimulated LDH activity (+20.7 ± 5.1% for 1 μm RSV and +56.9 ± 10.3% for 5 μm RSV compared with vehicle-treated cells; Fig. 3A, right). However, this activity increased with RSV to a lesser extent than the NUR activity (+80 and +20% for NUR and LDH, respectively, at 1 μm RSV). In isolated mitochondria, the stimulation of NUR activity was followed by a higher NADH oxidation by complex I (Fig. 3B), as shown by the increase in complex I-dependent respiration rates in mitochondria from RSV-treated cells.
FIGURE 3.

RSV stimulates NADH dehydrogenase activities in HepG2 cells and increases mitochondrial NAD+ content. A, effect of different RSV doses on two NADH dehydrogenases (NUR and LDH) activities on HepG2 cells. HepG2 cells were incubated for 48 h with vehicle (Veh; ethanol, 1:5000) or RSV (1 or 5 μm). Maximal activities of NUR and LDH were measured on cell extracts. Results are expressed as the mean ± S.E. (error bars) (n = 4). *, significant differences (p < 0.05) compared with vehicle-treated cells. B, effect of RSV on NADH oxidation in isolated mitochondria. Respiration rates were measured on isolated mitochondria of RSV (48 h, 1 μm)-treated or vehicle (Veh; ethanol, 1:5000)-treated HepG2 cells. MP, respiration rate with complex I substrates (i.e. 5 mm malate + 2.5 mm pyruvate; NAD+ addition of 0.5 mm NAD+; cyt c, the addition of 8 μm cytochrome c; MPS, complex I and II substrates (i.e. malate, pyruvate, and 10 mm succinate); SR, the addition of 5 μm rotenone. Results are expressed as the mean ± S.E. (n = 6). *, significant differences (p < 0.05) compared with vehicle-treated cells. C, effect of RSV treatment on cellular NADH and NAD+ levels in HepG2 cells. The cellular free NADH and NAD+ levels were determined on HepG2 cells incubated during 48 h with vehicle (Veh; ethanol, 1:5000) or RSV (1 μm). Results are expressed as the mean ± S.E. of eight experiments. D, effect of RSV treatment on NADH autofluorescence on HepG2 cells. Left, NADH autofluorescence was measured by fluorescent microscopy on HepG2 cells incubated with vehicle (Veh; ethanol, 1:5000) or RSV (1 μm, 4 h). In positive control, rotenone (10 nm) was added 15 min before RSV treatment. Data are shown as a representative picture of n = 3. Right, NADH redox index measured in vehicle- and RSV-treated cells by recording the NADH autofluorescence in basal conditions, following the addition of an uncoupler (m-Cl-CCP, 10 μm) and respiration inhibitors (KCN (1 mm) and rotenone (5 μm)) in both vehicle- and RSV-treated cells. The NADH redox index is then calculated by expressing the basal autofluorescence as a ratio of this range and as the mean ± S.E. of five experiments. *, significant differences (p < 0.05) compared with vehicle-treated cells. E, effect of RSV on cytosolic NAD+/NADH ratio. The cytosolic NAD+/NADH ratio was calculated as the ratio of pyruvate/lactate concentrations measured in culture medium of vehicle (Veh; ethanol, 1:5000)-treated or RSV (RSV, 1 μm; 48 h)-treated cells. *, significant differences (p < 0.05) compared with vehicle-treated cells.
An increase in NADH dehydrogenase activities accompanied by a stimulation of NADH oxidation could increase the NAD+/NADH ratio in situ. To test this hypothesis, the NADH and NAD+ levels were first determined on whole cell extracts. Results presented in Fig. 3C show that RSV significantly increased cellular NAD+ concentration by 56%. The total cellular NAD (NAD+ and NADH) was not significantly modified by RSV treatment. We then analyzed the NADH redox state by the measurement of NAD(P)H autofluorescence in HepG2 cells (Fig. 3D). We observed lesser NAD(P)H autofluorescence (i.e. higher NAD(P)+) in RSV-treated cells compared with vehicle (Fig. 3D, left). Pretreatment of cells with complex I inhibitor rotenone (10 nm) prevented the decrease in NAD(P)H, as evidenced by the similar autofluorescence level in RSV plus rotenone cells compared with vehicle plus rotenone cells. NAD(P)H autofluorescence rose in response to the blockade of the electron transport chain at the complexes I and IV using rotenone and KCN, respectively (+50 ± 12% in vehicle-treated cells) and was reduced by fully stimulating oxygen consumption with the uncoupler m-Cl-CCP (−40 ± 7%; not shown). The NADH redox index was calculated by expressing the basal cellular autofluorescence as a percentage of the fully reduced (respiration inhibition; i.e. KCN + rotenone) and fully oxidized (i.e. m-Cl-CCP) conditions (23). In RSV-treated cells, NAD(P)H autofluorescence was decreased by roughly 30% (p = 0.0423) in RSV-treated cells (Fig. 3D, right), whereas the fluorescence signal with rotenone + KCN did not differ between vehicle- and RSV-treated cells (not shown). Thus, the NADH redox index was lower in RSV-treated cells compared with vehicle ones, indicating an increase in mitochondrial NAD+/NADH ratio. The cytosolic NAD+/NADH ratio (calculated from the pyruvate/lactate ratio) was also determined in HepG2 cell supernatants. The results presented in Fig. 3E show that the cytosolic NAD+/NADH ratio was not modified by RSV treatment. Taken together, these results indicate that complex I stimulation by RSV results in an increase in NADH oxidation, mainly in the mitochondrial compartment, responsible for an increase in mitochondrial NAD+/NADH ratio.
SIRT3 Activity Is Increased by RSV Treatment and Is Involved in the Stimulation of the Krebs Cycle Enzyme Activities but Does Not Stimulate Mitochondrial Biogenesis
We next further investigated the signaling pathways involved in RSV effects on mitochondrial metabolism. NAD+ is a central co-substrate for the sirtuin deacetylases. Thus, we hypothesized that the increase in mitochondrial NAD+ concentration could lead to sirtuin activation. This hypothesis was checked by determining the acetylation status of p53 and SDH, known targets of SIRT1 and SIRT3, respectively. Fig. 4A shows that the acetylation status of p53 was not significantly modified by RSV treatment (left). In contrast, SDHA was hypoacetylated in RSV-treated HepG2 cells (Fig. 4A, right), a situation that was abolished with the SIRT inhibitor EX-527 preincubation. These results supported a SIRT3 activation by RSV treatment in HepG2 cells. Moreover, RSV treatment stimulated SDH (203.73 ± 18.49 nmol·min·mg of protein for vehicle-treated and 269.9 ± 14.6 nmol·min·mg of protein for RSV-treated cells) and CS (701.2 ± 57.2 nmol·min·mg of protein for vehicle-treated and 872.1 ± 29.0 nmol·min·mg of protein of protein for RSV-treated cells) activities, both targets of the mitochondrial SIRT3 isoform (Fig. 4B). In order to control the implication of SIRT3 in these effects, sirtuins were inhibited either by pharmacological inhibitor using a high dose of EX-527 (100 μm; Fig. 4B) or by reducing SIRT3 expression using specific siRNAs (Fig. 4C). The inhibition of sirtuins using EX-527 prevented the increase in SDH and CS activities in RSV-treated cells (Fig. 4B) but did not prevent the increase in NUR activity. Moreover, the specific decrease of SIRT3 expression by siRNA also abrogated the increase in SDH and CS activities induced by RSV (without changing the NUR activity), whereas the enzymatic activity was not modified in scrambled-transfected cells (Fig. 4C). Neither the inhibition of SIRT by EX-527 nor the transfection of cells with scrambled siRNA changed the activity of SDH and CS (data not shown). Thus, the mechanism of SDH and CS activation was closely linked to SIRT3 activity, whereas the stimulation of NUR activity by RSV was sirtuin-independent.
FIGURE 4.
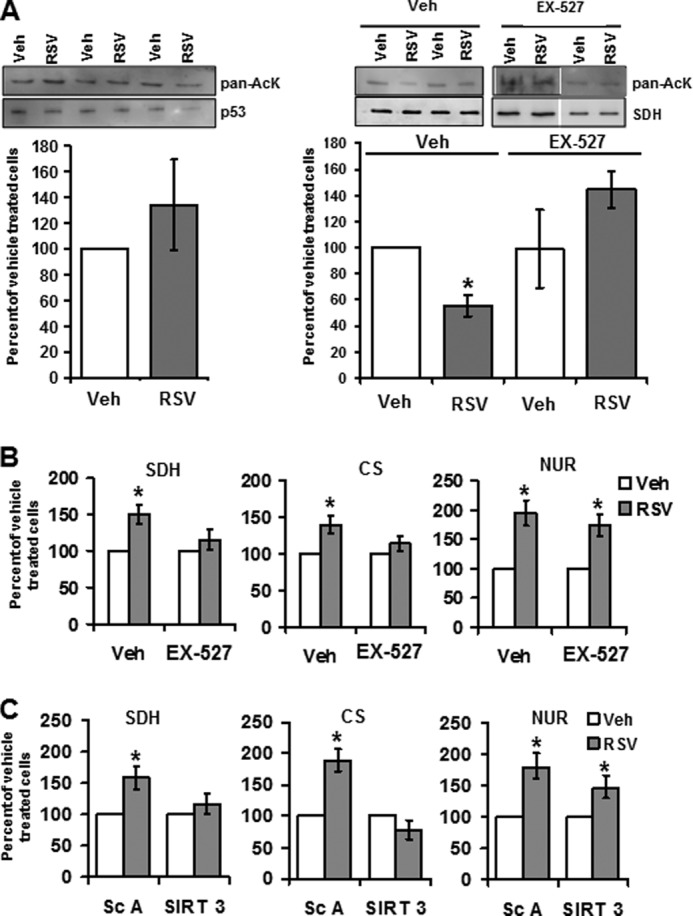
SIRT3 is involved in the effects of RSV on SDH and CS but not NUR activities. A, effect of RSV on acetylation status of sirtuin target proteins. Left, p53 was immunoprecipitated from HepG2 cells incubated with RSV (48 h, 1 μm). Right, SDH was immunoprecipitated from HepG2 cells incubated with RSV (48 h, 1 μm) and/or with EX-527 (100 μm). The graph represents the mean of the acetyl-lysine/SDH protein ratio of n = 11 experiments. *, significant differences (p < 0.05) compared with vehicle-treated cells. B, effect of sirtuin inhibition on RSV-induced stimulation of SDH, CS, and NUR activities. HepG2 cells were incubated with EX-527 (100 μm) or without (vehicle, DMSO (1:1000)) before the addition of RSV (1 μm) or vehicle (Veh; ethanol (1:5000)). Enzymatic activities of SDH, CS, and NUR were measured. Results are expressed as a percentage of vehicle-treated cells and represent the mean ± S.E. (error bars) (n = 4). *, significant differences (p < 0.05) compared with vehicle-treated cells. C, effect of SIRT3 knockdown on RSV-induced stimulation of SDH, CS, and NUR activities. HepG2 cells were transfected with scrambled or SIRT3 siRNAs and incubated with vehicle (ethanol, 1:5000) or RSV (1 μm) for 48 h. Data represent the mean ± S.E. of n = 9 SDH and CS measurements and n = 6 NUR measurements. *, significant differences (p < 0.05) compared with vehicle-treated cells.
RSV has been reported to activate the AMPK pathway in combination with SIRT1 or SIRT3, leading to mitochondrial biogenesis. In our model, SIRT3 activation did not lead to a stimulation of AMPK pathway, as evidenced by the unchanged phospho-AMPK/total AMPK ratio between vehicle and RSV-treated HepG2 cells (Fig. 5A). Pretreatment of cells with compound C (an AMPK inhibitor) did not modify the activity of SDH or CS (data not shown). AMPK inhibition did not prevent the stimulation of NUR, CS, or SDH activities by RSV (Fig. 5B), also suggesting that AMPK was not involved in the RSV effects on the mitochondrial respiratory chain. Moreover, RSV specifically targeted mitochondrial complex I because 1 μm RSV only increased the activity of complex I (96.6 ± 8.7 nmol·min−1·mg of protein−1 for vehicle versus 155.1 ± 25.1 nmol·min−1·mg of protein−1 for RSV 1 μm) but did not significantly modify the activities of complexes III and IV (Fig. 5C). Finally, at the dose of 1 μm used here, RSV increased neither the quantity of respiratory chain complexes (Fig. 5D) nor the mitochondrial yield nor the expression of proteins involved in mitochondrial biogenesis (i.e. the PGC1α co-activator and the mitochondrial transcription factor TFAM) (Fig. 5E).
FIGURE 5.
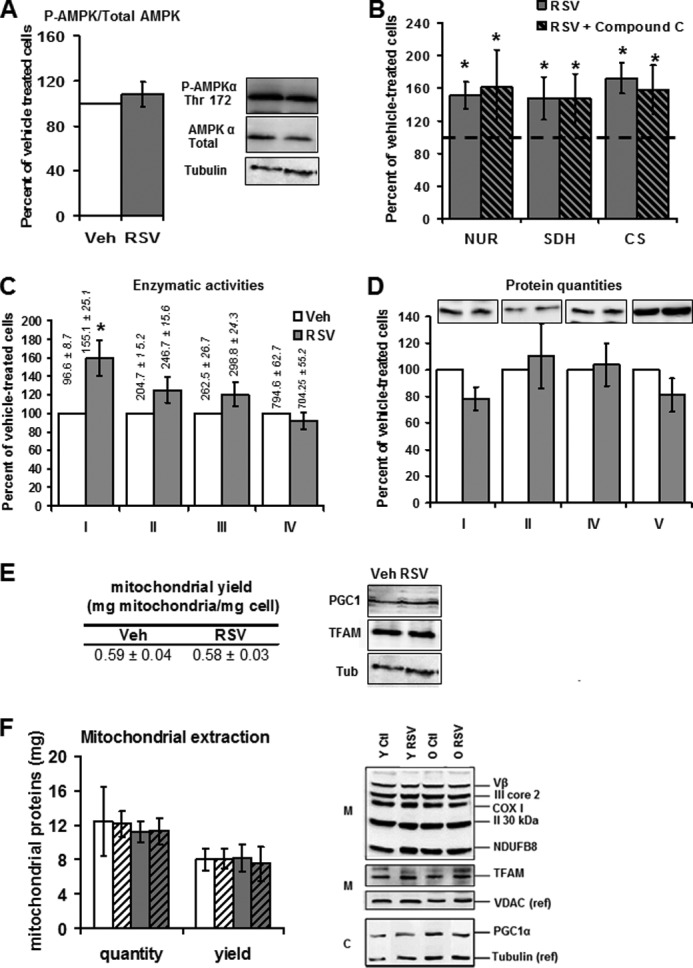
RSV treatment activates mitochondrial biogenesis pathways neither in HepG2 cells (1 μm, 48 h) nor in mice liver (50 mg·kg·day). A, Western blot quantification phospho-AMPK/total AMPK ratio in HepG2 cells treated for 48 h with RSV (1 μm). The blot on the left is a representative blot of eight experiments. B, effect of AMPK inhibition on RSV-induced activation of NUR, SDH, and CS activities. HepG2 cells were first treated with vehicle (ethanol, 1:5000) or compound C (10 μm), an inhibitor of AMPK activity, and then incubated with 1 μm RSV or vehicle (Veh; ethanol, 1:5000). Enzymatic activities of NADH ubiquinone reductase (NUR), succinate dehydrogenase (SDH), and citrate synthase (CS) were then measured on cell lysates. Results are expressed as a percentage of vehicle-matched treated cells and as the mean ± S.E. of four experiments. The dotted line placed at 100% represents the vehicle value. C–E, mitochondrial biogenesis in HepG2 cells treated for 48 h with RSV (1 μm). C, maximal activity of the complexes I, II, III, and IV (n = 8 ± S.E. (error bars)) on HepG2 cells after RSV treatment. Data represent the mean ± S.E. of four experiments. Results are expressed as a percentage of vehicle-treated cells and represent the mean ± S.E. (n = 4). The actual values of complex activities are shown on the top of the corresponding graph bar and are expressed in nmol·min−1·mg protein−1. *, significant differences (p < 0.05) compared with vehicle-treated cells. D, Western blot analysis of one subunit for each mitochondrial respiratory chain complex after 48 h of RSV treatment: NDUFB8 (complex I), SDHB (complex II), COX2 (complex IV), and Vα (Complex V). Shown are representative blots of four experiments. E, left, mitochondrial extraction yield in HepG2 cells treated for 48 h with RSV (1 μm). The results presented are the ratio of mitochondrial versus cellular protein amount. Data represent the mean ± S.E. of four experiments. Right, Western blot analysis of one PGC1α and TFAM expression after 48 h of RSV treatment Representative blots of four experiments. F, mitochondrial biogenesis in liver mitochondria of controls and RSV-treated mice. Left, mitochondrial protein amount was determined in young (Y) and old (O) mice fed on control (Ctl) and RSV-enriched (RSV) diets and expressed as a quantity of mitochondrial proteins (quantity) and normalized to the tissue weight (yield). n = 6 for each group; data represent the mean ± S.E. (right) The protein expression of respiratory chain complex subunits was evaluated by Western blotting using antibodies directed against one subunit of each complex. Nuclear co-activator (PGC1a), nuclear transcription factor NRF1, and TFAM protein expression was assessed by Western blot analysis. Loading was controlled by detection of VDAC (mitochondrial fraction; M) and tubulin (cytoplasmic fraction; C) proteins. Shown is a representative blot of four experiments.
The Stimulation of NUR Activity Induced by RSV Increases the Mitochondrial NAD+ content, a Prerequisite for Stimulation of SDH and CS Activities
RSV stimulated the activities of SDH and CS by activating SIRT3. To test whether the RSV-induced increase in mitochondrial NAD+ was involved in these effects, the NAD+ pool was experimentally depleted using 100 μm gallotannin (Fig. 6A). Cell incubation with gallotannin effectively reduced the cellular NAD+ concentration (Fig. 6A), whereas the cytosolic NAD+/NADH ratio was increased (Fig. 1B), suggesting that gallotannin preferentially depleted the mitochondrial NAD+ pool. Fig. 6B shows that this NAD+ depletion prevented the increase in SDH and CS activities induced by RSV, emphasizing the central role of NAD+ in SIRT3-dependent effects of RSV. We then aimed at determining if activation of TCA enzymes by a mitochondrial NAD+ increase could be linked to RSV effect on NUR activity. For this purpose, SDH and CS activities were measured after cell incubation with a low dose of rotenone (10 nm), a NUR inhibitor (NUR activity after rotenone treatment was decreased by 49% (p = 0.0464), whereas SDH and CS activities were not modified by the rotenone treatment; not shown). Rotenone significantly decreased the cellular NAD+ content and prevented the increase in NAD+ concentration induced by RSV (Fig. 6C, left). In rotenone-treated cells, the deacetylation of SDH induced by RSV was no longer observed (Fig. 6C, right). Rotenone also prevented the RSV-induced stimulation of SDH and CS activities (Fig. 6D). Taken together, these data show that the RSV-induced increase in NAD+ production by complex I mediates the stimulation of TCA cycle enzyme activities by SIRT3.
FIGURE 6.
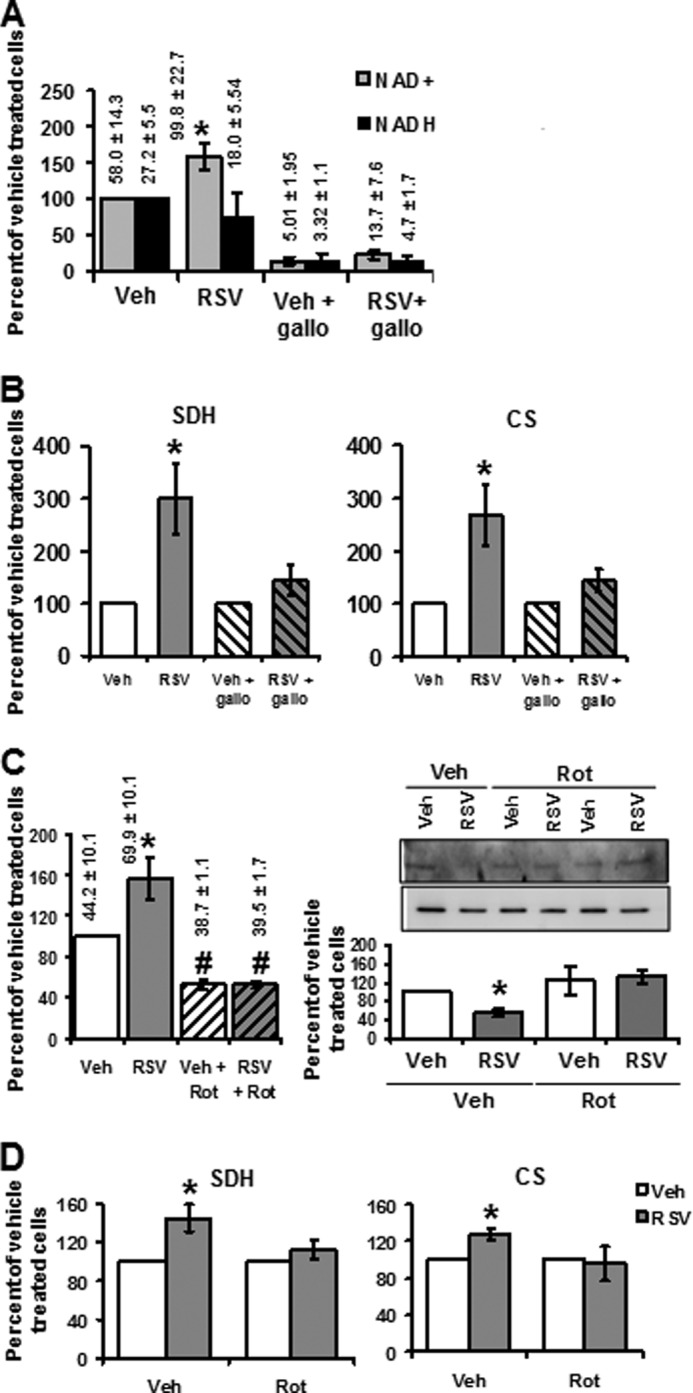
The mitochondrial NAD+ increase induced by RSV is responsible for SDH and CS activation. A, effect of gallotannin pretreatment on RSV-induced increase in the cellular level of NAD+. Cellular NADH and NAD+ levels were determined on HepG2 cells treated for 4 h with vehicle (Veh; ethanol, 1:5000), RSV (1 μm), or gallotannin (Gallo; 1 mm). Results are expressed as a percentage of vehicle-treated cells and represent the mean ± S.E. (error bars) of eight experiments. The actual values are shown on the top of the corresponding graph bar and are expressed in pmol·mg of protein−1. *, significant differences (p < 0.05) compared with vehicle-treated cells. B, effect of NAD+ increase on SDH and CS activities. HepG2 cells were incubated with RSV (1 μm) or gallotannin (1 mm) + RSV (1 μm). Enzymatic activities of SDH and CS were measured. Results are expressed as a percentage of vehicle-treated cells and represent as the mean ± S.E. of four experiments. C, effect of rotenone pretreatment on RSV-induced increase in cellular NAD+ level and SDH acetylation status. Left, NAD+ content was determined in HepG2 cells preincubated with rotenone (10 nm) before RSV (1 μm) or vehicle (Veh; ethanol, 1:5000) treatment. Data represent the mean ± S.E. of four experiments and are expressed as a percentage of RSV-treated cells. The actual values of NAD+ content are shown on the top of the corresponding graph bar and are expressed in pmol·mg proteins−1. *, significant differences (p < 0.05) compared with vehicle; #, significant differences (p < 0.05) between vehicle and rotenone-treated cells. Right, SDH was immunoprecipitated from HepG2 cells incubated with RSV (48 h, 1 μm) and/or with rotenone (10 nm). The graph represents the mean of the acetyl-lysine (upper panel)/SDH protein (lower panel) ratio of n = 6 experiments. *, significant differences (p < 0.05) compared with vehicle-treated cells. D, effect of modulation of NAD+ concentration on SDH and CS activities. Enzymatic activities of SDH and CS were measured on HepG2 cells preincubated with rotenone (Rot; 10 nm) or compared with vehicle (V) before RSV treatment (1 μm). Results are expressed as a percentage of vehicle-treated cells and represent the mean ± S.E. of four experiments. *, significant differences (p < 0.05) compared with vehicle.
High RSV Doses Display Heterogeneous Effects on NADH Dehydrogenases and No Longer Increase Mitochondrial Enzymatic Activities
Most of the studies looking at the mitochondrial effects of RSV used higher concentrations than in our work (above 10 and up to 100 μm of RSV (18, 33–35)). To investigate if the results described in our model were still present at higher RSV concentration, we tested the effect of 50 μm on isolated NAD+/NADH-dependent enzyme activities, on NUR activity, and on SDH and CS activities in HepG2 cells. At the higher dose of 50 μm RSV, we did not see the same results on NAD+/NADH-dependent enzymes (Fig. 7A) compared with 1 and 5 μm RSV (Fig. 2A). Indeed, whereas 50 μm RSV still inhibited ADH and FDH activities, it no longer activated LDH, GDH, and FMNdH and even inhibited the latter two (Fig. 7A). Similarly, in HepG2 cells, a higher RSV dose (50 μm) no longer significantly increased NUR, SDH, or CS activities (Fig. 7B). These results emphasize the importance of the RSV dose used in the study to obtain specific effects on mitochondrial respiratory chain.
FIGURE 7.
High RSV dose (50 μm) inhibits dehydrogenase activities and does not increase the TCA cycle enzymatic activities. A, effect of high RSV dose on activity of isolated dehydrogenases: ADH, FDH, LDH, GDH, and FMN. Actual values of enzyme activities measured at 30 °C for FMNdH and FDH, at 37 °C for GDH and LDH, and at 25 °C for ADH are indicated at the top of the corresponding bar graph (data are expressed in μmol·min−1·mg of proteins−1). B, effect of high RSV dose on TCA enzymatic activities. Enzymatic activities of NUR, SDH, and CS were measured on HepG2 cells (RSV, 5 or 50 μm, 48 h). Results are expressed as a percentage of vehicle-treated cells and represent the mean ± S.E. (error bars) (n = 4). *, significant differences (p < 0.05) compared with vehicle.
RSV Also Stimulates Mitochondrial Metabolism in Liver Mitochondria of an RSV-fed Mouse Model
To confirm the results obtained on HepG2 cells, mice were fed during 12 weeks on an RSV-enriched diet (50 mg/kg/day). During aging, the complex I activity and the NAD+ content are reduced due to mitochondrial dysfunction and oxidative stress (36). Thus, two groups of mice were studied: young (6 months) and old mice (22 months). The maximal NUR activity (Fig. 8A) and respiration rate with complex I substrates (Fig. 8B) was about 60% lower in the old mice compared with the young mice (p < 0.05). First, the impact of RSV on NUR activity in mice was studied at different levels (Fig. 8C): on frozen, disrupted mitochondrial membranes following the addition of 1 μm RSV (isolated NUR activity, Cx + RSV); on mitochondria of control mice incubated for 30 min with 1 μm RSV (Mito + RSV); and in mice fed for 12 weeks with an RSV-enriched diet (Mice + RSV; RSV accumulation in liver, 1.29 μmol/kg). We observed that RSV increased NUR activity on liver mitochondria of RSV-fed mice and on isolated mitochondria incubated with RSV but also directly on disrupted mitochondrial membranes, indicative of a direct effect of the molecule on complex I. This increase in NUR activity can be found both in young (Y) and old (O) RSV-fed mice. However, a subsequent increase in complex I-linked respiration (malate and pyruvate as substrates) was only evidenced in old RSV mice (Fig. 8D). The activity of the complexes oxidizing FADH2, namely complex II and complex III, was also increased by RSV (Fig. 9A), in both groups (complex II), or only in the old one (complex III). The RSV diet also stimulated CS, SDH, and isocitrate dehydrogenase (TCA cycle enzymes; Fig. 9B); malate dehydrogenase and GAPDH (NADH and FADH2 shuttles; Fig. 9C); and long-chain fatty acid dehydrogenase (FAO; Fig. 9D) activities, all key enzymes providing NADH and FADH2 to the respiratory chain. In general, this increase was much higher in the old animals compared with the young ones (from 17% (CS; not significant) to 228% higher effect (GAPDH; p = 0.017) of RSV in old mice than in young ones). Oxygraphic analyses indicated a higher FADH2 oxidation in RSV-treated groups with respect to the complex II-, palmitoyl-, or glycerol 3-phosphate-linked respirations (Fig. 9E). Similarly to the in vitro study on HepG2 cells, the stimulation of mitochondrial enzyme activities by RSV was not associated with greater mitochondrial biogenesis. Indeed, Western blotting did not increase subunits of the respiratory chain or factors responsible for mitochondrial biogenesis (i.e. PGC1α and TFAM) (Fig. 5F).
FIGURE 8.
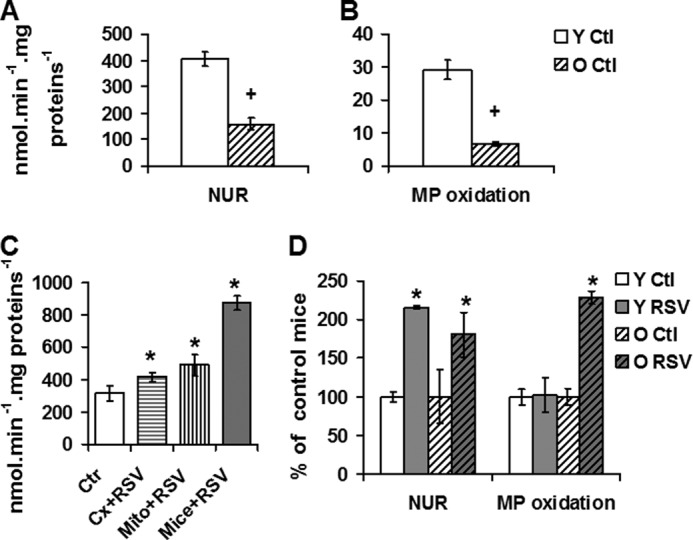
RSV induces an increase in complex I activity in liver. A and B, complex I activity and substrate oxidation by complex I measured on isolated liver mitochondria of young versus old mice. A, enzymatic activities of complex I (NUR). B, oxygraphic measurement of maximal, phosphorylating, complex I-linked respiration using malate and pyruvate (+ADP) as substrates. +, significant differences (p < 0.05) compared with old mice. C and D, effect of RSV on complex I properties of mice liver mitochondria. C, effect of RSV on NUR activity on control mitochondria. Ctr, isolated liver mitochondria of control young mice; Cx + RSV, activity of complex I measured on preparation of isolated, disrupted liver mitochondria after 1 μm RSV addition; Mito + RSV, activity of complex I measured on isolated intact mitochondria incubated (30 min) with 1 μm RSV; Mice + RSV, activity of complex I measured on isolated mitochondria from young mice with RSV diet (1.3 μmol/kg in liver). D, effect of RSV diet on complex I properties in liver mitochondria of young and old mice. Left, NUR activity; right, oxygraphic measurement of maximal, phosphorylating, complex I-linked respiration using malate and pyruvate (+ADP) as substrates. Data represent the mean ± S.E. (error bars) for each group. *, significant differences (p < 0.05) compared with control diet.
FIGURE 9.
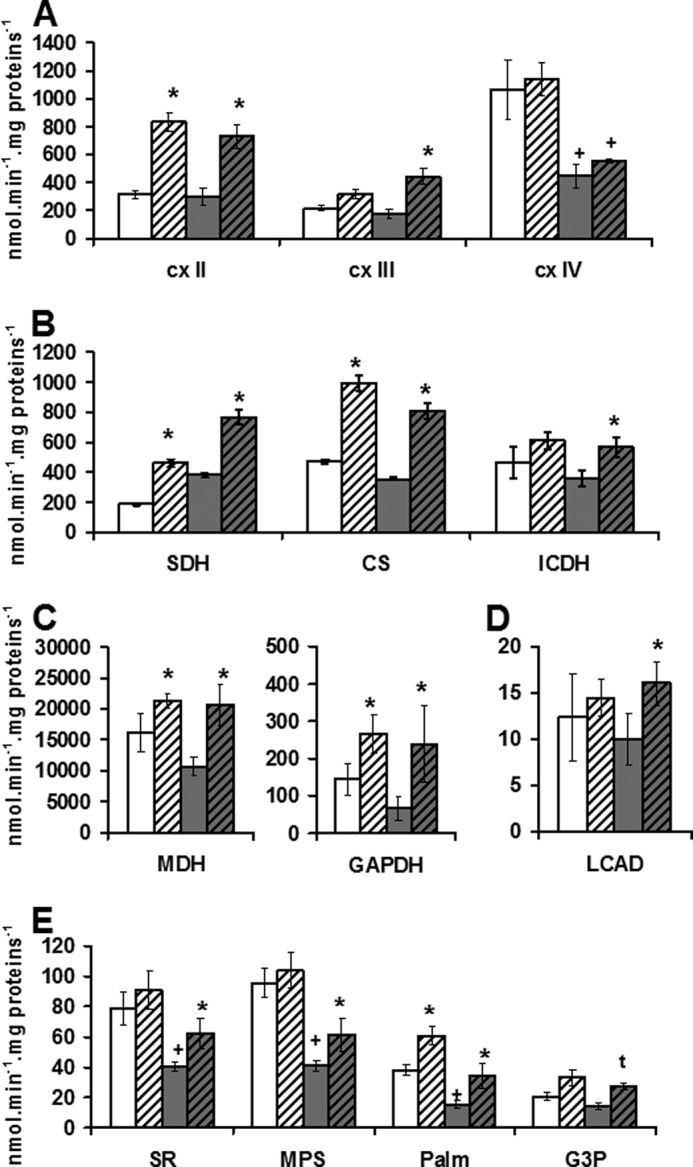
RSV induces an increase in the substrate supply in liver. A, maximal activities of respiratory chain complexes in controls and RSV-fed mice. Activity of complexes II (succinate ubiquinone reductase), III (ubuiquinol cytochrome c reductase), and IV (cytochrome c oxidase) were measured on liver mitochondria of control (Ctl) and RSV-fed (RSV) young and old mice. B, maximal activities of enzymes involved in respiratory chain substrate supply pathways. Activity of Krebs cycle (SDH, CS, and isocitrate dehydrogenase (ICDH)), enzymes were measured on liver mitochondria of control (Ctl) and RSV-fed (RSV) mice. C, maximal activities of enzymes involved in GAPDH shuttle. Activities of malate dehydrogenase (MDH) and GAPDH were measured on liver mitochondria of control (Ctl) and RSV-fed (RSV) mice. D, maximal activities of enzyme involved in fatty acid oxidation. Long-chain acyl-CoA dehydrogenase (LCAD) activity was measured on liver mitochondria of control (Ctl) and RSV-fed (RSV) mice. E, maximal coupled respiration in liver mitochondria. Coupled respiration measured on isolated liver mitochondria using complex I, II, or III or FAO substrates. White bars, control diet mice (Y); gray bars, RSV-fed groups. Shadings are used for old mice. Data represent the mean ± S.E. (error bars) of five animals for each group. +, significant differences (p < 0.05) compared with old mice; *, significant differences (p < 0.05) compared with control diet.
DISCUSSION
The crucial role played by sirtuins in the regulation of metabolism has been extensively studied over the last decade (37–41). The ability of polyphenols to activate SIRT1, and consequently to stimulate energetic metabolism, has opened up new therapeutic perspectives in various diseases involving energetic disorders (33, 37–44). However, numerous reports have challenged the hypothesis of the direct activation of SIRT1 by RSV (14, 16). Some of these recent publications describe the crucial role of the cofactor NAD+ in sirtuin activation (18, 34, 35). However, the precise mechanism linking RSV treatment and the increase in the intracellular concentration of NAD+ has yet to be elucidated. Mitochondria may sequester up to 70% of the NAD+ pool, depending on the tissue considered (19), and mitochondrial redox status could therefore appear as a potential sirtuin regulator (44). However, to our knowledge, no study has yet focused on the direct effect of RSV on mitochondrial metabolism. Here, we examine the impact of RSV on mitochondrial metabolism and identify complex I as a novel direct target of RSV. We demonstrate that the activation of NADH dehydrogenases by RSV occurs in vitro using purified enzyme, excluding the involvement of sirtuins in this effect. We also show that complex I is a key component modulating the mitochondrial NAD+/NADH ratio and then triggering SIRT3 activation and finally stimulating TCA enzyme activities. Several studies have presented AMPK as a signaling intermediate between RSV and the activation of SIRT1 (18, 33–35) and SIRT3 (45). In our study, effects of RSV on mitochondrial metabolism occur in the absence of mitochondrial biogenesis and are AMPK-independent at low dose (1 μm).
RSV Directly Activates Mitochondrial Complex I
Investigation of the interaction between RSV and NAD+ metabolic enzymes has demonstrated the competitive inhibitory effect of RSV on NAD+ hydrogenases (29). Mitochondria are the site of various enzymatic reactions that generate or consume NAD+ (including complex I of the respiratory chain). Our study shows that RSV was responsible for the direct increase of isolated NADH:FMN dehydrogenase activity and of complex I activity in mitochondrial membranes, in HepG2 cells, and in the liver mitochondria of RSV-fed mice. The RSV-induced increase in NADH-ferricyanide reductase activity was greater than the NADH ubiquinone reductase activity. This could indicate that the NADH dehydrogenase part of complex I, which binds the FMN moiety, can be the RSV target. In this study, we show that RSV can directly interact with an in vitro model of NADH dehydrogenase containing an FMN moiety at the catalytic center (Fig. 2, E and F). Further studies would determine if RSV can also directly interact in vivo with complex I of the respiratory chain (a multimeric enzyme), particularly near the FMN cofactor or at the NAD+ binding pocket. In our model, the stimulation of complex I activity was followed by NADH oxidation and electron transfer along the respiratory chain, leading to an increase in respiration rate in HepG2 cells and liver mitochondria of RSV-fed old mice. However, no increase in complex I-linked respiration can be evidenced in the young mice. The FMN moiety is presumed to be almost completely reduced during NADH-linked coupled respiration (46), and reoxidation of the terminal cluster N2 seems to be the rate-limiting step of the overall NADH oxidase (47). Here, electron transfer at the quinone site (NUR activity) effectively appears as a limiting factor; thus, the combined stimulation of complex I NADH dehydrogenase activity by RSV and limitation of reoxidation at the quinone-binding site would increase the reduced state of FMN (decrease FMN/FMNH2 turnover). Fully reduced flavin (FMN) was evidenced as a significant source of superoxide (48, 49). Further studies should analyze if RSV treatment effectively favors “electron leakage” from complex I.
Stimulation of Complex I Activity by RSV Induces an Increase in NAD+ Level
As evidenced by the cellular NAD+ content, RSV treatment induces an increase in NADH oxidation on HepG2 cells. We measured cellular and cytosolic pools and NAD(P)H autofluorescence. In cells, fluorometric measurement of autofluorescence between 420 and 540 nm has been shown to detect mainly the mitochondrial NADH pool (50–53). In HepG2 cells, after 1 μm RSV treatment, the NAD(P)H autofluorescence decreases, suggesting an increase in NAD+. This is reinforced by the higher cellular NAD+ concentration found in HepG2 cells treated with RSV. A previous study demonstrated that complex I activity regulates cellular NAD+/NADH balance (54); a decrease in complex I activity by knockdown of the NDUFV1 subunit reduces the NAD+/NADH ratio, whereas a 25–30% increase in complex activity enhances by this ratio 30%. In our study, rotenone inhibition of complex I in HepG2 cells indeed induces a decrease in NAD+ content, whereas RSV stimulation of complex I activity by roughly 70% is paralleled by an increase in mitochondrial NADH oxidation that could trigger the increase in NAD+/NADH mitochondrial ratio. Pretreatment of HepG2 cells with rotenone abrogated the increase in NADH oxidation induced by RSV. Altogether, these results are consistent with a modulation of the NAD+/NADH ratio by complex I activity and indicate that the complex I is involved in the increase in mitochondrial NAD+ induced by RSV.
RSV Stimulates Mitochondrial Substrate Supply through the Activation of Sirtuins
In the HepG2 cellular model as well as in the liver mitochondria of RSV-fed mice, RSV stimulated the respiratory chain substrate supply pathways (TCA enzymes, SDH and CS activities). These results are in agreement with a recent report indicating increased citrate synthase activity and a higher fatty acid-supported respiration rate in the muscle mitochondria of obese men receiving an oral RSV supplementation (42). Interestingly, we identified that the activation of TCA cycle enzymes by RSV depends on sirtuin activity, since, in HepG2 cells, preincubation with the EX527, a sirtuin inhibitor, prevented the activation of TCA enzymes. Moreover, a decrease in acetylation of SDH (a target of SIRT3) was observed in RSV-treated cells, underlying a stimulation of SIRT3 activity after RSV treatment. By contrast, SIRT1 activity did not appear to be modified after 1 μm RSV treatment because there was no difference in the p53 acetylation status between vehicle- and RSV-treated cells. The increase in NAD+ level is involved in the SIRT3-dependent effects on mitochondrial metabolism that we observed with RSV treatment. Indeed, a decrease in NAD+ synthesis induced by gallotannin, a potent inhibitor of the nicotinamide mononucleotide adenylyltransferase (NMNAT1), suppressed the sirtuin-dependent effects of RSV on TCA enzyme activities. In addition, it has recently been shown that increasing the intracellular and mitochondrial NAD+ by supplementation with the NAD+ precursor, nicotinamide riboside, leads to the activation of both SIRT1 and SIRT3 (44).
The Sirtuin Activation Relies on the Increased NADH Oxidation by Complex I
Our study goes further by identifying the direct activation of complex I by RSV as a key mediator of the RSV-induced increase in NAD+ content. We therefore postulate that RSV may activate the sirtuins by increasing mitochondrial NAD+ content through the stimulation of complex I activity. This hypothesis is supported by our finding that the pretreatment of HepG2 cells by rotenone, a complex I inhibitor, prevents the RSV-induced increase in both the NAD+ level and the TCA enzyme activities and abrogates the SDH deacetylation. It has been suggested that the control of the NAD+/NADH ratio by complex I is at the center of the oxidative process that occurs during aging (55). During this process, mitochondrial dysfunction, responsible for a reduction of complex I activity associated with oxidative stress, leads to a reduction in NAD+ content (36). The action of RSV on complex I activity should therefore help to maintain a high NAD+/NADH ratio, thereby increasing sirtuin activity. Indeed, in the liver mitochondria of old mice, the effects of RSV on the enzymatic activity of TCA and FAO are more pronounced than in young mice.
The Effects of RSV Are Dose-dependent
The concentration of RSV seems to be a crucial parameter responsible for its metabolic effects. Indeed, whereas most studies focusing on the mitochondrial effects of RSV essentially report an increase in mitochondrial biogenesis, our study with RSV at low doses mainly indicates a functional increase in energetic metabolism without AMPK involvement. In our work, the effects of RSV on NUR and TCA enzymes were already seen after 4 h of exposure, a finding that does not support the hypothesis of the activation of mitochondrial biogenesis by RSV. Most of the other studies used moderate to high doses of RSV (ranging from 10 to 100 μm), and although the activation of the same key proteins (i.e. AMPK and SIRT1) was described (4, 33, 43, 56, 57), the signaling pathways leading to these events seem to differ according to the concentration of RSV used. In our study, contrary to the low concentrations of RSV (1–5 μm), a higher dose (50 μm) did not induce the activity of NUR, SDH, or CS anymore. Moreover, Price et al. (17) show that at high RSV dose (50 μm), AMPK activation was no longer coupled to the induction of SIRT1 and that this concentration led to a sharp reduction in mitochondrial oxidative metabolism.
In conclusion, our study further characterizes the effects of RSV on mitochondrial bioenergetics and proposes an original pathway linking RSV, sirtuin activation, and the mitochondrial respiratory chain. This hypothesis is summed up in Fig. 10. Our work demonstrates that the mitochondrial NAD+/NADH ratio is a critical factor of sirtuin activation and depends on complex I activity. Thus, the modulation of the NAD+/NADH ratio appears to be a promising target in the prevention and treatment of metabolic diseases. Furthermore, the concentration of RSV could be a critical parameter and should therefore be taken into account in future clinical trials.
FIGURE 10.

Recapitulative scheme of the suggested resveratrol signaling pathway on mitochondrial metabolism. RSV directly stimulates complex I activity (1), thus turning on the mitochondrial NAD+/NADH balance toward increasing NAD+ concentration (2). This favors sirtuin activation (3), which finally enhances substrates supply to respiratory chain by both tricarboxylic acid cycle and fatty acid oxidation (4). This increase in substrate supplies to the respiratory chain leads to an increase in respiration rates (5) after resveratrol treatment.
Acknowledgments
We are grateful to Marcia Haigis and Kanaya Malkani for critical reading and comments on the manuscript and to M. C. Menet for high performance liquid chromatography analysis of resveratrol. We also gratefully thank Corinne Boudier and Eric Surget for technical assistance during NAD+/NADH measurements.
This work was supported by grants from “Région Pays de la Loire,” “Agence Nationale de la Recherche,” “Fondation pour la Recherche Médicale,” “Union Nationale des Aveugles et Déficients Visuels,” “Retina France,” “Ouvrir les Yeux,” and “Association contre les Maladies Mitochondriales.”
- RSV
- resveratrol
- FAO
- fatty acid oxidation
- SDH
- succinate dehydrogenase
- CS
- citrate synthase
- LDH
- l-lactate dehydrogenase
- FDH
- formate:NAD+ oxidoreductase
- ADH
- aldehyde:NAD+ oxidoreductase
- GDH
- l-glutamate:NAD(P)+ oxidoreductase
- AMPK
- AMP-activated protein kinase
- Ctl
- control
- NFR
- NADH:FeKCN reductase
- NUR
- NADH:ubiquinone reductase
- FMN
- FMN dehydrogenase
- TFAM
- mitochondrial transcription factor A
- m-Cl-CCP
- carbonyl cyanide 3-chlorophenylhydrazone.
REFERENCES
- 1. Richard T., Pawlus A. D., Iglesias M. L., Pedrot E., Waffo-Teguo P., Merillon J. M., Monti J. P. (2001) Neuroprotective properties of resveratrol and derivatives Ann. N.Y. Acad. Sci. 1215, 103–108 [DOI] [PubMed] [Google Scholar]
- 2. Petrovski G., Gurusamy N., Das D. K. (2011) Resveratrol in cardiovascular health and disease Ann. N.Y. Acad. Sci. 1215, 22–33 [DOI] [PubMed] [Google Scholar]
- 3. Baur J. A., Pearson K. J., Price N. L., Jamieson H. A., Lerin C., Kalra A., Prabhu V. V., Allard J. S., Lopez-Lluch G., Lewis K., Pistell P. J., Poosala S., Becker K. G., Boss O., Gwinn D., Wang M., Ramaswamy S., Fishbein K. W., Spencer R. G., Lakatta E. G., Le Couteur D., Shaw R. J., Navas P., Puigserver P., Ingram D. K., de Cabo R., Sinclair D. A. (2006) Resveratrol improves health and survival of mice on a high-calorie diet. Nature 444, 337–342 [DOI] [PMC free article] [PubMed] [Google Scholar]
- 4. Lagouge M., Argmann C., Gerhart-Hines Z., Meziane H., Lerin C., Daussin F., Messadeq N., Milne J., Lambert P., Elliott P., Geny B., Laakso M., Puigserver P., Auwerx J. (2006) Resveratrol improves mitochondrial function and protects against metabolic disease by activating SIRT1 and PGC-1α. Cell 127, 1109–1122 [DOI] [PubMed] [Google Scholar]
- 5. Mercader J., Palou A., Bonet M. L. (2011) Resveratrol enhances fatty acid oxidation capacity and reduces resistin and retinol-binding protein 4 expression in white adipocytes. J. Nutr. Biochem. 22, 828–834 [DOI] [PubMed] [Google Scholar]
- 6. Li X., Kazgan N. (2011) Mammalian sirtuins and energy metabolism. Int. J. Biol. Sci. 7, 575–587 [DOI] [PMC free article] [PubMed] [Google Scholar]
- 7. Kim S. C., Sprung R., Chen Y., Xu Y., Ball H., Pei J., Cheng T., Kho Y., Xiao H., Xiao L., Grishin N. V., White M., Yang X. J., Zhao Y. (2006) Substrate and functional diversity of lysine acetylation revealed by a proteomics survey. Mol. Cell 23, 607–618 [DOI] [PubMed] [Google Scholar]
- 8. Ahn B. H., Kim H. S., Song S., Lee I. H., Liu J., Vassilopoulos A., Deng C. X., Finkel T. (2008) A role for the mitochondrial deacetylase Sirt3 in regulating energy homeostasis. Proc. Natl. Acad. Sci. U.S.A. 105, 14447–14452 [DOI] [PMC free article] [PubMed] [Google Scholar]
- 9. Cimen H., Han M. J., Yang Y., Tong Q., Koc H., Koc E. C. (2010) Regulation of succinate dehydrogenase activity by SIRT3 in mammalian mitochondria. Biochemistry 49, 304–311 [DOI] [PMC free article] [PubMed] [Google Scholar]
- 10. Howitz K. T., Bitterman K. J., Cohen H. Y., Lamming D. W., Lavu S., Wood J. G., Zipkin R. E., Chung P., Kisielewski A., Zhang L. L., Scherer B., Sinclair D. A. (2003) Small molecule activators of sirtuins extend Saccharomyces cerevisiae lifespan. Nature 425, 191–196 [DOI] [PubMed] [Google Scholar]
- 11. Csiszar A., Labinskyy N., Pinto J. T., Ballabh P., Zhang H., Losonczy G., Pearson K., de Cabo R., Pacher P., Zhang C., Ungvari Z. (2009) Resveratrol induces mitochondrial biogenesis in endothelial cells. Am. J. Physiol. Heart Circ Physiol. 297, H13–H20 [DOI] [PMC free article] [PubMed] [Google Scholar]
- 12. Bastin J., Lopes-Costa A., Djouadi F. (2011) Exposure to resveratrol triggers pharmacological correction of fatty acid utilization in human fatty acid oxidation-deficient fibroblasts. Hum. Mol. Genet. 20, 2048–2057 [DOI] [PubMed] [Google Scholar]
- 13. Kitada M., Kume S., Imaizumi N., Koya D. (2011) Resveratrol improves oxidative stress and protects against diabetic nephropathy through normalization of Mn-SOD dysfunction in AMPK/SIRT1-independent pathway. Diabetes 60, 634–643 [DOI] [PMC free article] [PubMed] [Google Scholar]
- 14. Beher D., Wu J., Cumine S., Kim K. W., Lu S. C., Atangan L., Wang M. (2009) Resveratrol is not a direct activator of SIRT1 enzyme activity. Chem. Biol. Drug Des. 74, 619–624 [DOI] [PubMed] [Google Scholar]
- 15. Kaeberlein M., McDonagh T., Heltweg B., Hixon J., Westman E. A., Caldwell S. D., Napper A., Curtis R., DiStefano P. S., Fields S., Bedalov A., Kennedy B. K. (2005) Substrate-specific activation of sirtuins by resveratrol. J. Biol. Chem. 280, 17038–17045 [DOI] [PubMed] [Google Scholar]
- 16. Pacholec M., Bleasdale J. E., Chrunyk B., Cunningham D., Flynn D., Garofalo R. S., Griffith D., Griffor M., Loulakis P., Pabst B., Qiu X., Stockman B., Thanabal V., Varghese A., Ward J., Withka J., Ahn K. (2010) SRT1720, SRT2183, SRT1460, and resveratrol are not direct activators of SIRT1. J. Biol. Chem. 285, 8340–8351 [DOI] [PMC free article] [PubMed] [Google Scholar]
- 17. Price N. L., Gomes A. P., Ling A. J., Duarte F. V., Martin-Montalvo A., North B. J., Agarwal B., Ye L., Ramadori G., Teodoro J. S., Hubbard B. P., Varela A. T., Davis J. G., Varamini B., Hafner A., Moaddel R., Rolo A. P., Coppari R., Palmeira C. M., de Cabo R., Baur J. A., Sinclair D. A. (2012) SIRT1 is required for AMPK activation and the beneficial effects of resveratrol on mitochondrial function. Cell Metab. 15, 675–690 [DOI] [PMC free article] [PubMed] [Google Scholar]
- 18. Park S. J., Ahmad F., Philp A., Baar K., Williams T., Luo H., Ke H., Rehmann H., Taussig R., Brown A. L., Kim M. K., Beaven M. A., Burgin A. B., Manganiello V., Chung J. H. (2012) Resveratrol ameliorates aging-related metabolic phenotypes by inhibiting cAMP phosphodiesterases. Cell 148, 421–433 [DOI] [PMC free article] [PubMed] [Google Scholar]
- 19. Di Lisa F., Ziegler M. (2001) Pathophysiological relevance of mitochondria in NAD+ metabolism. FEBS Lett. 492, 4–8 [DOI] [PubMed] [Google Scholar]
- 20. Menet M. C., Cottart C. H., Taghi M., Nivet-Antoine V., Dargère D., Vibert F., Laprévote O., Beaudeux J. L. (2013) Ultra high performance liquid chromatography-quadrupole-time of flight analysis for the identification and the determination of resveratrol and its metabolites in mouse plasma. Anal. Chim. Acta 761, 128–136 [DOI] [PubMed] [Google Scholar]
- 21. Williamson D. H., Lund P., Krebs H. A. (1967) The redox state of free nicotinamide-adenine dinucleotide in the cytoplasm and mitochondria of rat liver. Biochem. J. 103, 514–527 [DOI] [PMC free article] [PubMed] [Google Scholar]
- 22. Sun F., Dai C., Xie J., Hu X. (2012) Biochemical issues in estimation of cytosolic free NAD/NADH ratio. PLoS One 7, e34525. [DOI] [PMC free article] [PubMed] [Google Scholar]
- 23. Duchen M. R., Biscoe T. J. (1992) Mitochondrial function in type I cells isolated from rabbit arterial chemoreceptors. J. Physiol. 450, 13–31 [DOI] [PMC free article] [PubMed] [Google Scholar]
- 24. Guillet V., Gueguen N., Cartoni R., Chevrollier A., Desquiret V., Angebault C., Amati-Bonneau P., Procaccio V., Bonneau D., Martinou J. C., Reynier P. (2011) Bioenergetic defect associated with mKATP channel opening in a mouse model carrying a mitofusin 2 mutation. FASEB J. 25, 1618–1627 [DOI] [PubMed] [Google Scholar]
- 25. Flamment M., Gueguen N., Wetterwald C., Simard G., Malthièry Y., Ducluzeau P. H. (2009) Effects of the cannabinoid CB1 antagonist rimonabant on hepatic mitochondrial function in rats fed a high-fat diet. Am. J. Physiol. Endocrinol Metab. 297, E1162–E1170 [DOI] [PubMed] [Google Scholar]
- 26. Goncalves S., Paupe V., Dassa E. P., Brière J. J., Favier J., Gimenez-Roqueplo A. P., Bénit P., Rustin P. (2010) Rapid determination of tricarboxylic acid cycle enzyme activities in biological samples. BMC Biochem. 11, 5. [DOI] [PMC free article] [PubMed] [Google Scholar]
- 27. Medja F., Allouche S., Frachon P., Jardel C., Malgat M., Mousson de Camaret B., Slama A., Lunardi J., Mazat J. P., Lombès A. (2009) Development and implementation of standardized respiratory chain spectrophotometric assays for clinical diagnosis. Mitochondrion 9, 331–339 [DOI] [PubMed] [Google Scholar]
- 28. Rustin P., Chretien D., Bourgeron T., Gérard B., Rötig A., Saudubray J. M., Munnich A. (1994) Biochemical and molecular investigations in respiratory chain deficiencies. Clin. Chim. Acta 228, 35–51 [DOI] [PubMed] [Google Scholar]
- 29. Kitson T. M., Kitson K. E., Moore S. A. (2001) Interaction of sheep liver cytosolic aldehyde dehydrogenase with quercetin, resveratrol and diethylstilbestrol. Chem. Biol. Interact. 130, 57–69 [DOI] [PubMed] [Google Scholar]
- 30. Calamini B., Ratia K., Malkowski M. G., Cuendet M., Pezzuto J. M., Santarsiero B. D., Mesecar A. D. (2010) Pleiotropic mechanisms facilitated by resveratrol and its metabolites. Biochem. J. 429, 273–282 [DOI] [PMC free article] [PubMed] [Google Scholar]
- 31. López-Nicolás J. M., García-Carmona F. (2008) Aggregation state and pKa values of (E)-resveratrol as determined by fluorescence spectroscopy and UV-visible absorption. J. Agric. Food Chem. 56, 7600–7605 [DOI] [PubMed] [Google Scholar]
- 32. Jiang Y. G., Peng T., Luo Y., Li M. C., Lin Y. H. (2008) Resveratrol reestablishes spermatogenesis after testicular injury in rats caused by 2, 5-hexanedione. Chin. Med. J. 121, 1204–1209 [PubMed] [Google Scholar]
- 33. Canto C., Auwerx J. (2009) PGC-1α, SIRT1 and AMPK, an energy sensing network that controls energy expenditure Curr. Opin. Lipidol. 20, 98–105 [DOI] [PMC free article] [PubMed] [Google Scholar]
- 34. Cantó C., Gerhart-Hines Z., Feige J. N., Lagouge M., Noriega L., Milne J. C., Elliott P. J., Puigserver P., Auwerx J. (2009) AMPK regulates energy expenditure by modulating NAD+ metabolism and SIRT1 activity. Nature 458, 1056–1060 [DOI] [PMC free article] [PubMed] [Google Scholar]
- 35. Cantó C., Auwerx J. (2012) Targeting sirtuin 1 to improve metabolism. All you need is NAD+? Pharmacol. Rev. 64, 166–187 [DOI] [PMC free article] [PubMed] [Google Scholar]
- 36. Braidy N., Guillemin G. J., Mansour H., Chan-Ling T., Poljak A., Grant R. (2011) Age related changes in NAD+ metabolism oxidative stress and Sirt1 activity in Wistar rats. PLoS One 6, e19194. [DOI] [PMC free article] [PubMed] [Google Scholar] [Retracted]
- 37. Bao J., Sack M. N. (2010) Protein deacetylation by sirtuins. Delineating a post-translational regulatory program responsive to nutrient and redox stressors. Cell Mol. Life Sci. 67, 3073–3087 [DOI] [PMC free article] [PubMed] [Google Scholar]
- 38. Gerhart-Hines Z., Rodgers J. T., Bare O., Lerin C., Kim S. H., Mostoslavsky R., Alt F. W., Wu Z., Puigserver P. (2007) Metabolic control of muscle mitochondrial function and fatty acid oxidation through SIRT1/PGC-1α. EMBO J. 26, 1913–1923 [DOI] [PMC free article] [PubMed] [Google Scholar]
- 39. Rodgers J. T., Puigserver P. (2007) Fasting-dependent glucose and lipid metabolic response through hepatic sirtuin 1. Proc. Natl. Acad. Sci. U.S.A. 104, 12861–12866 [DOI] [PMC free article] [PubMed] [Google Scholar]
- 40. Schenk S., McCurdy C. E., Philp A., Chen M. Z., Holliday M. J., Bandyopadhyay G. K., Osborn O., Baar K., Olefsky J. M. (2011) Sirt1 enhances skeletal muscle insulin sensitivity in mice during caloric restriction. J. Clin. Invest. 121, 4281–4288 [DOI] [PMC free article] [PubMed] [Google Scholar]
- 41. Ungvari Z., Sonntag W. E., de Cabo R., Baur J. A., Csiszar A. (2011) Mitochondrial protection by resveratrol. Exerc. Sport Sci. Rev. 39, 128–132 [DOI] [PMC free article] [PubMed] [Google Scholar]
- 42. Timmers S., Konings E., Bilet L., Houtkooper R. H., van de Weijer T., Goossens G. H., Hoeks J., van der Krieken S., Ryu D., Kersten S., Moonen-Kornips E., Hesselink M. K., Kunz I., Schrauwen-Hinderling V. B., Blaak E. E., Auwerx J., Schrauwen P. (2011) Calorie restriction-like effects of 30 days of resveratrol supplementation on energy metabolism and metabolic profile in obese humans. Cell Metab. 14, 612–622 [DOI] [PMC free article] [PubMed] [Google Scholar]
- 43. Um J. H., Park S. J., Kang H., Yang S., Foretz M., McBurney M. W., Kim M. K., Viollet B., Chung J. H. (2010) AMP-activated protein kinase-deficient mice are resistant to the metabolic effects of resveratrol. Diabetes 59, 554–563 [DOI] [PMC free article] [PubMed] [Google Scholar]
- 44. Cantó C., Houtkooper R. H., Pirinen E., Youn D. Y., Oosterveer M. H., Cen Y., Fernandez-Marcos P. J., Yamamoto H., Andreux P. A., Cettour-Rose P., Gademann K., Rinsch C., Schoonjans K., Sauve A. A., Auwerx J. (2012) The NAD+ precursor nicotinamide riboside enhances oxidative metabolism and protects against high-fat diet-induced obesity. Cell Metab. 15, 838–847 [DOI] [PMC free article] [PubMed] [Google Scholar]
- 45. Palacios O. M., Carmona J. J., Michan S., Chen K. Y., Manabe Y., Ward J. L., 3rd, Goodyear L. J., Tong Q. (2009) Diet and exercise signals regulate SIRT3 and activate AMPK and PGC-1α in skeletal muscle. Aging 1, 771–783 [DOI] [PMC free article] [PubMed] [Google Scholar]
- 46. Krishnamoorthy G., Hinkle P. C. (1988) Studies on the electron transfer pathway, topography of iron-sulfur centers, and site of coupling in NADH-Q oxidoreductase. J. Biol. Chem. 263, 17566–17575 [PubMed] [Google Scholar]
- 47. Vinogradov A. D. (2008) NADH/NAD+ interaction with NADH:ubiquinone oxidoreductase (complex I). Biochim. Biophys. Acta 1777, 729–734 [DOI] [PMC free article] [PubMed] [Google Scholar]
- 48. Kudin A. P., Malinska D., Kunz W. S. (2008) Sites of generation of reactive oxygen species in homogenates of brain tissue determined with the use of respiratory substrates and inhibitors. Biochim. Biophys. Acta 1777, 689–695 [DOI] [PubMed] [Google Scholar]
- 49. Galkin A., Brandt U. (2005) Superoxide radical formation by pure complex I (NADH:ubiquinone oxidoreductase) from Yarrowia lipolytica. J. Biol. Chem. 280, 30129–30135 [DOI] [PubMed] [Google Scholar]
- 50. Mayevsky A., Rogatsky G. G. (2007) Mitochondrial function in vivo evaluated by NADH fluorescence. From animal models to human studies. Am. J. Physiol. Cell Physiol. 292, C615–C640 [DOI] [PubMed] [Google Scholar]
- 51. Eng J., Lynch R. M., Balaban R. S. (1989) Nicotinamide adenine dinucleotide fluorescence spectroscopy and imaging of isolated cardiac myocytes. Biophys. J. 55, 621–630 [DOI] [PMC free article] [PubMed] [Google Scholar]
- 52. Minezaki K. K., Suleiman M. S., Chapman R. A. (1994) Changes in mitochondrial function induced in isolated guinea-pig ventricular myocytes by calcium overload. J. Physiol. 476, 459–471 [DOI] [PMC free article] [PubMed] [Google Scholar]
- 53. Duchen M. R., Biscoe T. J. (1992) Relative mitochondrial membrane potential and [Ca2+]i in type I cells isolated from the rabbit carotid body. J. Physiol. 450, 33–61 [DOI] [PMC free article] [PubMed] [Google Scholar]
- 54. Santidrian A. F., Matsuno-Yagi A., Ritland M., Seo B. B., LeBoeuf S. E., Gay L. J., Yagi T., Felding-Habermann B. (2013) Mitochondrial complex I activity and NAD+/NADH balance regulate breast cancer progression. J. Clin. Invest. 123, 1068–1081 [DOI] [PMC free article] [PubMed] [Google Scholar]
- 55. Stefanatos R., Sanz A. (2011) Mitochondrial complex I. A central regulator of the aging process. Cell Cycle 10, 1528–1532 [DOI] [PubMed] [Google Scholar]
- 56. Dasgupta B., Milbrandt J. (2007) Resveratrol stimulates AMP kinase activity in neurons. Proc. Natl. Acad. Sci. U.S.A. 104, 7217–7222 [DOI] [PMC free article] [PubMed] [Google Scholar]
- 57. Hou X., Xu S., Maitland-Toolan K. A., Sato K., Jiang B., Ido Y., Lan F., Walsh K., Wierzbicki M., Verbeuren T. J., Cohen R. A., Zang M. (2008) SIRT1 regulates hepatocyte lipid metabolism through activating AMP-activated protein kinase. J. Biol. Chem. 283, 20015–20026 [DOI] [PMC free article] [PubMed] [Google Scholar]