

Abstract
3-hydroxy-3-methylglutaryl-Coenzyme A reductase (HMGCR) encodes the rate-limiting enzyme in the cholesterol biosynthesis pathway and is inhibited by statins, a class of cholesterol-lowering drugs. Expression of an alternatively spliced HMGCR transcript lacking exon 13, HMGCR13(−), has been implicated in the variation of plasma LDL-cholesterol (LDL-C) and is the single most informative molecular marker of LDL-C response to statins. Given the physiological importance of this transcript, our goal was to identify molecules that regulate HMGCR alternative splicing. We recently reported gene expression changes in 480 lymphoblastoid cell lines (LCLs) after in vitro simvastatin treatment, and identified a number of statin-responsive genes involved in mRNA splicing. Heterogeneous nuclear ribonucleoprotein A1 (HNRNPA1) was chosen for follow-up since rs3846662, an HMGCR SNP that regulates exon 13 skipping, was predicted to alter an HNRNPA1 binding motif. Here, we not only demonstrate that rs3846662 modulates HNRNPA1 binding, but also that sterol depletion of human hepatoma cell lines reduced HNRNPA1 mRNA levels, an effect that was reversed with sterol add-back. Overexpression of HNRNPA1 increased the ratio of HMGCR13(−) to total HMGCR transcripts by both directly increasing exon 13 skipping in an allele-related manner and specifically stabilizing the HMGCR13(−) transcript. Importantly, HNRNPA1 overexpression also diminished HMGCR enzyme activity, enhanced LDL-C uptake and increased cellular apolipoprotein B (APOB). rs1920045, an SNP associated with HNRNPA1 exon 8 alternative splicing, was also associated with smaller statin-induced reduction in total cholesterol from two independent clinical trials. These results suggest that HNRNPA1 plays a role in the variation of cardiovascular disease risk and statin response.
INTRODUCTION
Elevated plasma cholesterol is a well-established risk factor for cardiovascular disease. Statins are a class of cholesterol-lowering drugs that competitively inhibit 3-hydroxy-3-methylglutaryl-Coenzyme A reductase (HMGCR), the rate-limiting enzyme of the cholesterol biosynthesis pathway, causing reduced intracellular cholesterol, which in turn stimulates hepatic LDL-cholesterol (LDL-C) uptake as well as diminished hepatic cholesterol secretion (1). rs3846662, a functional single nucleotide polymorphism (SNP) within HMGCR intron 13, has been associated with variation in baseline plasma LDL-C among multiple independent populations (2–4) and reduced LDL-C response to statin treatment in the context of haplotype analysis (5,6). rs3846662 has been shown to directly regulate HMGCR exon 13 alternative splicing to modulate the relative levels of an alternatively spliced transcript that lacks exon 13, HMGCR13(−), versus the full-length canonical HMGCR transcript, HMGCR13(+) (2,7); however, the precise molecular mechanism mediating this regulation remains unknown. The HMGCR catalytic domain lacking exon 13 appears to be inactive (2). Altering the relative ratio of the HMGCR13(−) to 13(+) transcripts modulates the statin-mediated inhibition of HMGCR enzyme activity such that inter-individual variation in statin-induced changes in HMGCR alternative splicing has been directly correlated with variation in LDL-C lowering with statin treatment, indicating that HMGCR13(−) expression is both a marker and determinant of statin response (7).
Intracellular cholesterol homeostasis is maintained through tight regulation of both de novo biosynthesis and receptor-mediated plasma LDL-C uptake to balance cellular sterol needs, while preventing toxicity associated with cellular over-accumulation of cholesterol and its precursors (8). We recently reported that alternative splicing appears to be a general mechanism of regulating genes involved in cholesterol metabolism (9), functioning within the context of the SREBF2 transcriptional response. The relative expression of transcripts encoding active versus inactive isoforms of proteins involved in cholesterol metabolism is altered by cellular sterol concentrations, providing a mechanism to fine-tune regulation of cholesterol homeostasis (9). Specifically, sterol depletion suppresses, and sterol loading induces, alternative splicing of not only HMGCR, but also other genes involved in cholesterol biosynthesis including 3-hydroxy-3-methylglutaryl-Coenzyme A synthase 1 (HMGCS1) and mevalonate kinase (MVK), as well as genes involved in cholesterol uptake, such as the low density lipoprotein receptor (LDLR) and proprotein convertase subtilisin/kexin type 9 (PCSK9). These coordinated changes are due in part to sterol regulation of a well-known splicing factor, polypyrimidine tract-binding protein 1 (PTBP1), which we have shown to mediate changes in alternative splicing of HMGCS1, MVK, LDLR and PCSK9, but not HMGCR (9).
Here, we present evidence that heterogeneous nuclear ribonucleoprotein A1 (HNRNPA1) is a sterol-regulated splicing factor that modulates HMGCR alternative splicing, stabilizes the HMGCR13(−) transcript, as well as impacts intracellular cholesterol metabolism. Notably, rs3846662, the HMGCR SNP that promotes exon 13 skipping, alters HNRNPA1 regulation of HMGCR alternative splicing. Moreover, we identify that a sequence variant upstream of HNRNPA1 is associated with alternative splicing of HNRNPA1 itself, as well as with inter-individual variation in the magnitude of cholesterol lowering with statin treatment.
RESULTS
Identification of HNRNPA1 as a candidate splicing factor that regulates sterol-induced changes in HMGCR alternative splicing
We recently performed genome-wide expression profiling lymphoblastoid cell lines (LCLs) following exposure to either 2 µM activated simvastatin or sham buffer, and found that genes involved in mRNA splicing were significantly decreased after statin treatment (10).
We were particularly interested in identifying splicing factors that modulate HMGCR exon 13 skipping, a process known to be regulated by rs3846662, a SNP in intron 13 (2,7). Through the in silico prediction program, Human Splicing Finder (11), we found that the rs3846662 ‘G’ allele was predicted to generate both HNRNPA1 and SRSF1 (aka SF2/ASF)-binding motifs, while the ‘A’ allele predicted HNRNPA1 and SRSF6 (aka SRp55)-binding motifs. HNRNPA1 and SRSF1 are known to compete with each other to promote exon exclusion or retention, respectively (12–14); thus the loss of the SRSF1-binding motif with the rs3846662 ‘A’ allele is consistent with previous reports, demonstrating that the ‘A’ allele promotes HMGCR exon 13 skipping (2). Expression levels of HNRNPA1, SRSF1 and SRSF6 were down-regulated with statin treatment (reduced to 0.88 ± 0.01, 0.96 ± 0.01 and 0.95 ± 0.01-folds of control, respectively); however, since HNRNPA1 was the most reduced of the three, we hypothesized that HNRNPA1 may be involved in sterol-mediated regulation of HMGCR alternative splicing.
HNRNPA1 is sterol-regulated in hepatocytes
Statin inhibition of HMGCR blocks the synthesis of mevalonate, which is a precursor for not only cholesterol but also non-sterol-derived isoprenoid intermediates (1). To determine whether statin-induced reduction of HNRNPA1 gene expression was due to sterol depletion versus non-sterol effects of statin inhibition, HepG2 cells were exposed to conditions of sterol depletion (2 µm activated simvastatin + 10% lipoprotein-deficient serum, LPDS) for 48 h, or sterol depletion for 24 h after which either 50 µg/ml LDL-C or 1 µg/ml 25-hydroxycholesterol (HC) was added and the cells were incubated for an additional 24 h. Sterol regulation was observed in three human hepatoma cell lines (HepG2, Huh7 and Hep3B) with sterol depletion reducing HNRNPA1 transcript levels between 36 and 48% (P < 0.05, Fig. 1 and Supplementary Material, Fig. S1). Add-back of either LDL-C or 25-HC in HepG2 indicated that this reduction was due to reduced sterol concentrations (Fig. 1), consistent with sterol regulation of HNRNPA1 transcript levels. Consistent changes in HNRNPA1 protein levels in response to sterol depletion and add-back were confirmed by western blot analysis (Supplementary Material, Fig. S1).
Figure 1.

Sterol depletion down-regulates HNRNPA1 expression. HepG2 cells (n = 10) were incubated under one of the four conditions: 48-h incubation in media supplemented with 10% FBS, 48-h incubation in media supplemented with 2 µm activated simvastatin and 10% LPDS, 24-h incubation in media supplemented with 2 µm statin and 10% LPDS followed by a 24-h incubation with 50 µg/ml LDL-C add-back, or 24-h incubation in media supplemented with 2 µM statin and 10% LPDS followed by a 24-h incubation with 1 µg/ml 25-HC. Transcript levels of HNRNPA1 lacking exon 8, HNRNPA1 8(−), the predominant variant of HNRNPA1, were quantified using qPCR. Results are shown as mean ± standard error. *P < 0.05 for FBS versus Statins (Student's t-test). See also Supplementary Material, Figure S1.
HNRNPA1 regulates the ratio of HMGCR alternatively spliced versus full-length transcripts
To determine the impact of HNRNPA1 on HMGCR13(−) and 13(+) transcript levels, we transfected HepG2 and Huh7 cells with pCG-A1, a plasmid expressing T7-tagged HNRNPA1 lacking exon 8, the major splice variant expressed in these cell lines, or pCG, a control plasmid containing only the vector backbone, for 48 h. HNRNPA1 8(−) overexpression was confirmed by qPCR and immunoblot (Fig. 2A and B). Overexpression of HNRNPA1 increased the percentage of HMGCR13(−) transcripts in HepG2 and Huh7 cells by 25.5 ± 3.7 and 41.2 ± 8.6%, respectively (P < 0.05) (Fig. 2C) without significantly altering the level of total HMGCR transcripts (Fig. 2D). We observed the reverse relationship in cells transfected with the pLKO.1 HNRNPA1 shRNA plasmid, which reduced HNRNPA1 transcript levels by 38.0 ± 10% in HepG2 cells and by 33.3 ± 8.8% in Huh7 cells (Fig. 2E). The percentage of HMGCR13(−) transcripts in HNRNPA1 shRNA-transfected HepG2 and Huh7 cells was decreased by 24.4 ± 2.5 and 4.3 ± 2.8%, respectively (P < 0.05) (Fig. 2F), without altering total HMGCR mRNA levels (Fig. 2G). Although the effect size was quite modest in Huh7 cells, this finding is consistent with Sanger sequencing results, confirming that HepG2 cells are heterozygous for rs3846662 and thus have one copy of the ‘A’ allele, while Huh7 cells are homozygous for the ‘G’ allele, and thus would be predicted to have reduced response compared with HepG2 cells. In addition, we found that the magnitude of HNRNPA1 knock-down with siRNA transfection was directly proportional to the degree of change in the ratio of HMGCR13(−) to total HMGCR transcripts (r2 = 0.47, P = 0.003; Fig. 2H). Taken together, these results strongly suggest that HNRNPA1 regulates HMGCR exon 13 skipping.
Figure 2.

HNRNPA1 overexpression and knock-down modulate the relative ratio of HMGCR13(−) to total HMGCR transcripts. HepG2 and Huh7 cells were transfected with either the pCG-A1 HNRNPA1 8(−) overexpression or pCG control plasmid for 48 h. (A) HNRNPA1 8(−), (C) HMGCR13(−), and (D) total HMGCR transcripts from pCG-A1 and pCG transfected cells were quantified by qPCR (n = 12 for HepG2 cells; n = 3 for Huh7 cells). (B) After transfection, HepG2 cells were lysed, and 15 µg of total cell lysate was used for western blotting with either anti-HNRNPA1 or anti-β-actin antibodies. HepG2 and Huh7 cells were transfected with either the pLKO.1 HNRNPA1 shRNA or pLKO.1 scramble shRNA plasmid. After 48 h of transfection, (E) HNRNPA1 8(−), (F) HMGCR13(−) and (G) total HMGCR transcripts were quantified using qPCR (n = 6 in HepG2 cells; n = 5 in Huh7 cells). Data are shown as mean ± standard error. (H) HepG2 cells were transfected with either a Silence Select siRNA specific for HNRNPA1, or non-targeting negative control under 16 different experimental conditions created by varying the transfection agent: siRNA complex ratio and length of transfection time between 18–24 h. HMGCR13(−), HMGCR13(+) and HNRNPA1 8(−) transcripts were quantified by qPCR.
HNRNPA1 regulates HMGCR alternative splicing and transcript stability
To test if HNRNPA1 regulates allele-specific HMGCR exon 13 skipping, we created an HMGCR mini-gene by cloning the HMGCR genomic DNA sequence from Hep3B between introns 11 and 14 into the pDEST exon-trap vector. Since the template contained the rs3846662 ‘G’ allele, we used site-directed mutagenesis to introduce the ‘A’ allele to test for an SNP by HNRNPA1 interaction (Fig. 3A). A allele and G allele HMGCR mini-genes were separately co-transfected with either the pCG-A1 HNRNPA1 8(−) overexpression or pCG control plasmid. qPCR assays were designed to specifically detect HMGCR transcripts originating from the mini-gene (called mHMGCR13(−) and mHMGCR13(+)), but not endogenous HMGCR transcripts. Consistent with the hypothesis that HNRNPA1 regulates exon 13 alternative splicing, we found that HNRNPA1 overexpression increased mHMGCR13(−) and decreased mHMGCR13(+) in both Huh7 and Hep3B cells transfected with either the A or G allele mini-genes (Fig. 3B and C). These effects were more pronounced with the A allele mini-gene as HNRNPA1 overexpression increased the mHMGCR13(−)/mHMGCR13(+) ratio ∼40% greater than the G allele mini-gene in both Huh7 (P < 0.05) and Hep3B cells (P = 0.05) (Fig. 3B and C). In addition, this relationship appeared to be dose-dependent as greater HNRNPA1 overexpression was correlated (r2 = 0.89, P = 0.0004) with greater HMGCR exon 13 skipping in HepG2 cells (n = 8) co-transfected with the A allele containing mini-gene (Fig. 3D). As expected, PTBP1 overexpression did not increase mHMGCR13(−) (C.Y., personal communication).
Figure 3.

HNRNPA1 overexpression increases the efficiency of HMGCR exon 13 skipping in an allele-related manner. (A) Scheme of the HMGCR mini-gene construct containing the genomic fragment of HMGCR introns 11 through 14. Arrows on exons indicate the locations of qPCR primers designed to specifically quantify mini-gene-derived HMGCR transcripts. (B) Huh7 (n = 6), (C) Hep3B (n = 6) and (D) HepG2 (n = 8) cell lines were co-transfected with either the rs3846662 ‘A’ allele or ‘G’ allele HMGCR mini-gene construct as well as either the pCG-A1 HNRNPA1 8(−) overexpression or pCG control plasmid. After 48 h, mHMGCR transcripts were quantified by qPCR. The relative ratio of mHMGCR13(−) to mHMGCR13(+) transcripts are shown for co-transfected Huh7 and Hep3B cell lines (n = 6 per cell line). Values shown are expressed as mean ± standard error. The correlation between HNRNPA1 overexpression levels and the ratio of mHMGCR13(−) to mHMGCR13(+) transcripts is shown for co-transfected HepG2 cells.
Next, to determine whether there is a direct interaction between endogenously expressed HNRNPA1 and HMGCR pre-mRNA, we performed RNA immunoprecipitation (RIP) using an anti-HNRNPA1 monoclonal antibody in HepG2 cells, and performed RT-PCR with primers spanning both the 5′ and 3′ exon–intron 13 splice junctions to specifically detect HMGCR intron 13 containing transcripts. While HMGCR intron 13 was detectable in both the anti-HNRNPA1 and mouse IgG control samples prior to pull-down (aka input lysate), after pull-down HMGCR intron 13 containing transcripts were only detected in the anti-HNRNPA1 antibody-treated sample (Fig. 4A). In addition, we co-transfected HepG2 cells with either the rs3846662 ‘A’ or ‘G’ allele containing HMGCR mini-gene construct as well as either the pCG or pCG-HNRNPA1 overexpression vector to assess the effect of rs3846662 on the HNRNPA1-HMGCR interaction. Using RIP and qPCR, we found that HNRNPA1 overexpression led to 3.86 ± 1.15-fold greater enrichment of HMGCR pre-mRNA (intron 13 containing transcripts) expressed from the ‘A’ allele containing mini-gene after HNRNPA1 pull-down compared with transcripts expressed from the ‘G’ allele containing mini-gene (n = 3, P = 0.05, Fig. 4B). Greater enrichment of mini-gene derived HMGCR mRNA from the ‘A’ allele versus ‘G’ allele mini-gene transfected cells was also observed (Supplementary Material, Fig. S2), suggesting a preferential binding of HNRNPA1 to the HMGCR rs3846662 ‘A’ allele containing transcripts compared with the ‘G’ allele containing transcripts. Western blot analysis was performed to validate HNRNPA1 protein pull-down (Fig. 4C). Finally, to confirm that rs3846662 causes differential binding of HNRNPA1, we performed an RNA electrophoretic mobility gel shift assay (RNA EMSA) using N-terminal His-tagged HNRNPA1 (His-HNRNPA1) and biotinylated RNA probes for the HMGCR intronic region containing either the rs3846662 ‘A’ or ‘G’ allele. In addition, a probe containing three repeats of HNRNPA1-binding sequence (aka A1 win probe) (15) was used as a positive control for the gel shift assay. As shown in Figure 4D, His-HNRNPA1 caused a significant shift of A1 win probe, validating the binding capacity of the His-HNRNPA1. Although a shifted band did not appear, we observed reduced amounts of free HMGCR probe after incubation of His-HNRNPA1, suggesting that the HMGCR probes were able to form complexes with His-HNRNPA1, but that these may be trapped in the gel wells. Importantly, quantitation of the free RNA probe intensity found that the presence of His-HNRNPA1 decreased the intensity of free A allele probe ∼40% more than that of free G allele probe (n = 3).
Figure 4.

HNRNPA1 directly interacts with HMGCR intron 13. (A) HepG2 cell lysates were subject to RIP using an anti-HNRNPA1 antibody or normal mouse IgG as control. HMGCR intron 13 containing transcripts in the input and immunprecipitated (IP) RNA was detected by RT-PCR, and visualized on a 2% agarose gel along with PCR negative control (NTC). (B) HepG2 cells (n = 3) were co-transfected with either the rs3846662 ‘A’ allele or ‘G’ allele HMGCR mini-gene construct as well as either the pCG-A1 HNRNPA1 8(−) overexpression or pCG control plasmid. After 48 h, an RIP assay was performed, and the pull-down mHMGCR pre-mRNA was analyzed by qPCR. The fold enrichment of binding was calculated as the amount of mini-gene HMGCR obtained from the anti-HNRNPA1 antibody-immunoprecipitates compared with the quantity of mini-gene HMGCR isolated from the normal mouse IgG complexes (negative control). Values shown are mean ± standard error. (C) Cell lysates from the RIP assays were subject to western blot analysis with anti-human HNRNPA1 antibody to confirm HNRNPA1 protein pull-down. (D) RNA gel shift assay was performed to test whether rs3846662 modulates the direct interaction between HNRNPA1 protein (His-HNRNPA1) and HMGCR intron 13. The upper panel shows the sequences of 3′ biotin-labeled rs3846662 RNA probes containing either ‘A’ or ‘G’ allele. The A1 win probe is a positive control probe containing three repeats of a known HNRNPA1-binding motif (15). Each of the three RNA probes was incubated with varying concentrations of His-HNRNPA1 protein, with reactions separated onto a 4–20% gel, transferred to a membrane, cross-linked and band intensity quantified. Although no shift was observed with the HMGCR probes, complex formation was inferred by the decrease in free RNA probe as RNA–protein complexes may have been trapped in the gel wells. The experiment was performed in triplicate, with a representative gel shown. See also Supplementary Material, Figure S2.
Since HNRNPA1 has been reported to modulate mRNA stability (16), and we found that HNRNPA1 overexpression increased the overall levels of mini-gene-derived HMGCR transcripts (Supplementary Material, Fig. S3), we sought to determine whether changes in the relative ratio of endogenous HMGCR13(−) to HMGCR13(+) transcripts may also be attributable to splice variant-specific effects of HNRNPA1 on transcript half-life. HepG2 cells were transfected with either the pCG-A1 HNRNPA1 8(−) overexpression or pCG control plasmid for 48 h, after which actinomycin D was added to inhibit transcription. HNRNPA1 overexpression increased HMGCR13(−) transcript stability 2.0 ± 0.5-fold compared with control conditions (n = 9, P < 0.05, Fig. 5A and B). In contrast, while there was a trend of greater HMGCR13(+) half-life with HNRNPA1 overexpression, this increase was not statistically significant (P = 0.17). Similar results were observed in Huh7 cells (Supplementary Material, Fig. S4).
Figure 5.
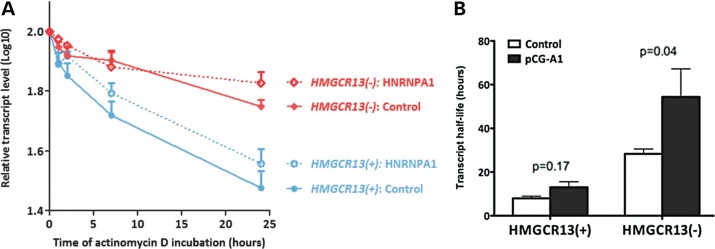
HNRNPA1 preferentially stabilizes HMGCR13(−) transcripts. HepG2 cells were transfected with either the pCG-A1 HNRNPA1 8(−) overexpression or pCG control plasmid for 48 h, after which 1 µg/ml actinomycin D was added (n = 9). Cells were harvested after 0, 0.5, 1, 2, 7 and 24 h of actinomycin D treatment. HMGCR13(−) and 13(+) transcripts were quantified by qPCR. Transcript half-life was calculated using only time points congruous with first-order decay kinetics (17). (A) Transcript levels per time point were log transformed, averaged and plotted versus actinomycin D incubation time. (B) Transcript half-life was calculated from the slope of the log-transformed mRNA quantities of the 0–24-h time points with the following formula: t1/2 (h) = ln2/(−2.303 × slope). Values shown are expressed as mean ± standard error. See also Supplementary Material, Figures S3 and S4.
HNRNPA1 overexpression modulates cellular cholesterol metabolism
When expressed alone, the HMGCR13(−) catalytic domain appears to be inactive (2), suggesting that modulating the relative ratio of the HMGCR13(−) to 13(+) isoforms would impact total cellular HMGCR enzyme activity. To determine whether the HNRNPA1-induced change in HMGCR alternative splicing is functionally relevant, we measured HMGCR enzyme activity in HepG2 cells after 24-h transfection with either the pCG-A1 HNRNPA1 8(−) overexpression or pCG control plasmid and found that HNRNPA1 overexpression decreased HMGCR enzyme activity 33.3 ± 8.9% (n = 6, P = 0.03) compared with control (Fig. 6A). In addition, HNRNPA1 overexpression increased both LDL-C uptake 9.3 ± 3.6% (n = 12, P = 0.01, Fig. 6B) and cellular apolipoprotein B (APOB) 38.0 ± 9.4% (n = 12, P = 0.001, Fig. 6C), but did not generate statistically significant changes in intracellular total cholesterol, free cholesterol or cholesterol ester (Fig. 6D). These results suggest that HNRNPA1-mediated modulation of HMGCR alternative splicing directly impacts intracellular cholesterol metabolism.
Figure 6.

HNRNPA1 overexpression effects on cellular cholesterol metabolism. HepG2 cells (n = 6–12) were transfected with a control plasmid (pCG) or an HNRNPA1 8(−) expression plasmid (pCG-A1) for 24 h. (A) HMGCR enzyme activity was quantified by incubating lysed cells with 14C-HMG-CoA (precursor) to directly assess incorporation rates into 14C-mevalonate (substrate). Radiolabeled HMG-CoA and mevalonate were separated by ion affinity in an AG-1X column, with 3H-mevalonate spiked in to assess recovery rates. Total cellular protein was quantified by the Bradford assay, and pmol of mevalonate formed was normalized to total protein. (B) LDL-C uptake was assayed by FACS following 4-h incubation with 10 µg/ml Dil-LDL. (C) Cellular APOB amount was determined by ELISA. (D) Intracellular cholesterol content was quantified by an Amplex® Red cholesterol assay kit. Values shown are expressed as mean ± standard error.
A genetic variant near HNRNPA1 is associated with HNRNPA1 8(+) transcript expression levels and in vivo statin response
We next sought to determine whether there were functional gene variants impacting HNRNPA1 influence on cholesterol metabolism. Of the more than 300K SNPs genotyped in Cholesterol and Pharmacogenetics (CAP: simvastatin 40 mg/day, 6 weeks) clinical trial participants, only two, rs1920045 and rs10506328, were located <10 kb from HNRNPA1 (Supplementary Material, Fig. S5A). We tested these for association with HNRNPA1 expression levels using array data from 480 statin- and sham-exposed CAP LCLs. The expression array contained two probes for HNRNPA1. One hybridized to the 5′ UTR of HNRNPA1 transcripts and detected most known HNRNPA1 splice variants (including the major HNRNPA1 8(−) variant), while the other hybridized to HNRNPA1 exon 8 and detected only exon 8-containing transcripts (or HNRNPA1 8(+)), Supplementary Material, Figure S3B. rs1920045 was associated with the absolute levels of HNRNPA1 8(+) mRNA in the sham-treated cells but not in the statin-treated cells (Supplementary Material, Fig. S6A and B), resulting in a differential statin-induced change in HNRNPA1 8(+) transcript levels (Fig. 7A). In contrast, there was no association between rs1920045 and total HNRNPA1 levels (predominantly HNRNPA1 8(−)) suggesting the SNP is both a ‘baseline’ and a ‘differential’ splicing quantitative trait locus (sQTL) for HNRNPA1 exon 8 (Supplementary Material, Fig. S6D–I). Specifically, HNRNPA1 8(+) transcript levels were increased in TT homozygotes after statin treatment, whereas either no changes or reductions in HNRNPA1 8(+) were observed in the other two genotypes (P = 0.01 additive model, Fig. 7A). In addition, TT homozygotes had greater increases in statin-induced HNRNPA1 exon 8 retention (Supplementary Material, Figs S6C and S8). Interestingly, western blot analysis of the three human hepatoma cell lines demonstrated preferential nuclear localization of the HNRNPA1 8(+) isoform (Fig. 7B). In addition, we confirmed that similar to HNRNPA1 8(−), HNRNPA1 8(+) regulates HMGCR exon 13 skipping (Supplementary Material, Fig. S7), suggesting that greater HNRNPA1 8(+) expression would be associated with greater HMGCR alternative splicing. Since greater HMGCR13(−) levels have been directly associated with smaller LDL-C reductions with statin treatment (7), we hypothesized that the genotype associated with greater HNRNPA1 8(+) transcript levels after statin treatment would also be associated with reduced cholesterol lowering. Consistent with this hypothesis, we found that rs1920045 TT homozygotes from two independent statin clinical trials, CAP and PRINCE (Pravastatin/Inflammation and CRP Evaluation: pravastatin 40 mg/day, 24 weeks), had smaller reductions in total cholesterol after statin treatment (Fig. 7C and Supplementary Material, Fig. S8). The other HNRNPA1 SNP, rs10506328, was not associated with any of these in vitro or in vivo phenotypes.
Figure 7.

rs1920045 influences HNRNPA1 8(+) transcript expression levels and statin-induced cholesterol-lowering. (A) 480 CAP LCLs were incubated with either sham buffer or 2 µm simvastatin for 24 h after which HNRNPA1 8(+) expression levels were quantified by expression array. Statistically significant differences in statin-induced change in HNRNPA1 8(+) transcript levels between rs1920045 genotype classes were calculated post hoc by Student's t-test. (B) Hep3B, HepG2 and Huh7 cell lines were grown under standard conditions, and cytoplasmic versus nuclear fractions were isolated. HNRNPA1 protein was identified by immunoblot to determine the subcellular localization of the two HNRNPA1 isoforms. (C) Statin-induced plasma cholesterol-lowering was compared across rs1920045 genotype classes in two independent statin clinical trials [CC + CT versus. TT one-tailed t-test P = 0.006, 0.0304 and 0.0362 for CAP + PRINCE, PRINCE (n = 1123 CC + CT and n = 188 TT), and CAP (n = 496 CC + CT and n = 90 TT), respectively]. Graphs depict mean ± standard error, and P-values are uncorrected for multiple testing. See also Supplementary Material, Figures S5–S8.
DISCUSSION
Although functionally relevant alternatively spliced variants of key genes implicated in cholesterol metabolism have long been reported in the literature (2,7,18–22), alternative splicing was only recently recognized as a mechanism of directly modulating these pathways, with sterol depletion reducing expression of splice variants encoding inactive or less functional protein isoforms and sterol loading increasing expression levels of these splice variants (9). Very recently, this mechanism has been shown to be mediated by specific splicing factors. For example, PTBP1 is a splicing suppressor that regulates alternative splicing of not only genes in the cholesterol biosynthesis and uptake pathways (9), but also FADS2, a critical gene in omega-3 and omega-6 fatty acid synthesis (23). TRA2B (aka SFRS10) has also been recently shown to alter splicing of LPIN1, a key regulator of triglyceride synthesis, causing changes in hepatic lipogenesis and very low density lipoprotein secretion (24). Here, we report evidence that HNRNPA1, a well-characterized mRNA splicing repressor (13,25), impacts cellular cholesterol metabolism by both stimulating production and reducing degradation of an alternatively spliced HMGCR transcript, HMGCR13(−), resulting in reduced HMGCR enzyme activity and increased LDL-C uptake. Since expression of HMGCR13(−) has been implicated in the variation of endogenous levels of plasma LDL-C (2) and LDL-C reductions in response to statin treatment (7), these findings suggest that HNRNPA1 plays a role in the variation of both risk and response to treatment of cardiovascular disease.
HNRNPA1 regulates RNA splicing by competing with SRSF1, an essential human splicing factor involved in both constitutive splicing and alternative splicing (26,27). The molar ratio of SRSF1 to HNRNPA1 regulates RNA splicing through antagonistic effects on the selection of alternative 5′ splice sites that compete for a common 3′ splice site in vitro (14,28). A high concentration of SRSF1 tends to activate proximal 5′ splice sites, promoting exon inclusion, whereas an excess of HNRNPA1 favors distal 5′ splice sites to cause exon skipping (13). Strikingly, in silico analysis predicted that the rs3846662 ‘A’ allele would disrupt the SRSF1-binding motif within HMGCR intron 13, but still allows HNRNPA1 binding, thus predicting that the ‘A’ allele would be associated with greater exon 13 skipping (Fig. 8). Consistent with previous reports demonstrating that the ‘A’ allele directly increases exon 13 skipping (2,7), using a mini-gene construct we found not only that HNRNPA1 promotes HMGCR exon 13 skipping, but also that this effect is more pronounced in ‘A’ allele containing mini-gene (Fig. 3). The attenuated interaction between HNRNPA1 and the rs3846662 ‘G’ allele was also seen in the effects of HNRNPA1 knock-down on endogenous levels of HMGCR13(−) expression in HepG2 and Huh7 cells (Fig. 2F). These changes are most likely due to direct effects of HNRNPA1 on HMGCR RNA as we demonstrated an interaction between endogenously expressed HNRNPA1 and HMGCR pre-mRNA (Fig. 4A). In addition, we verified that rs3846662 impacts this relationship using RIP-qPCR and RNA EMSA (Fig. 4B, Supplementary Material, Fig. S2 and 4D), where we found a greater interaction between HNRNPA1 and HMGCR RNA that contained the rs3846662 ‘A’ allele versus the ‘G’ allele. These results demonstrate that HNRNPA1 directly binds the HMGCR transcript, and that rs3846662 directly impacts this interaction. Together with our finding that sterol depletion reduces HNRNPA1 transcript levels (Fig. 1), these results corroborate our previous result that statin-induced suppression of HMGCR exon 13 skipping was only observed in LCLs that carried at least one copy of the rs3846662 ‘A’ allele versus no change in ‘G’ allele homozygotes (9). These results strongly suggest that HNRNPA1 plays a role in mediating both genetic (rs3846662) and environmental (changes in the intracellular sterol content) regulation of HMGCR alternative splicing.
Figure 8.

Hypothetic model of rs3846662 regulation of HMGCR exon 13 alternative splicing. Putative HNRNPA1 and SRSF1-binding motifs within the HMGCR intron 13 sequence containing either the rs3846662 ‘G’ or ‘A’ allele were identified using the Human Splicing Finder (11) with the default threshold values. SRSF1 and HNRNPA1 have similar binding motifs and are known antagonists. SRSF1 promotes utilization of the proximal 5′ splice donor resulting in exon retention, while HNRNPA1 promotes utilization of the distal 5′ splice donor to cause exon skipping (14). Although both HNRNPA1 and SRSF1 are predicted to compete for a binding motif containing the rs3846662 ‘G’ allele, only HNRNPA1 is predicted to bind the rs3846662 ‘A’ allele, and thus is expected to promote exon 13 skipping.
The rs3846662 ‘A’ allele, but not the ‘G’ allele, was predicted to generate a binding motif for SRSF6, another splicing factor with known roles in both constitutive and alternative splicing (29,30). Unlike SRSF1, there are no known interactions between SRSF6 and HNRNPA1; however, since all three of these genes (HNRNPA1, SRSF1 and SRSF6) are expressed in both liver tissue and LCLs, the role and interplay of these three splicing factors in the regulation of HMGCR alternative splicing remain an area of future study.
Cytoplasmic HNRNPA1 can recognize and bind to adenylate-uridylate-rich elements (AREs) in the 3′ untranslated region (UTR) of mRNAs to modulate the RNA turnover (16). Consistent with this activity, we found that HNRNPA1 not only stimulates production of the HMGCR13(−) transcript, but also preferentially stabilizes it over the HMGCR13(+) transcript (Figs 3 and 5). Interestingly, HMGCR13(−) and 13(+) are thought to share the same 3′ UTR. In addition, we found that HNRNPA1 overexpression increased levels of total mini-gene derived HMGCR transcripts (Supplementary Material, Fig. S3), which contain only exons 12–14 and do not have the HMGCR 3′ UTR. These results suggest the possibility that HNRNPA1 binding to the HMGCR transcript between exons 12 and 14 promotes transcript stability.
The dual effects of HNRNPA1 on HMGCR alternative splicing and transcript stability are consistent with our finding that HNRNPA1 is localized to both the nucleus and the cytoplasm. Interestingly, this localization appears to be influenced by alternative splicing of HNRNPA1 itself, as the major splice variant expressed in human hepatoma cell lines lacks exon 8, HNRNPA1 8(−), and encodes an isoform found in both the nucleus and the cytoplasm, while the minor splice variant that contains exon 8, HNRNPA1 8(+), encodes an isoform seen preferentially in the nucleus (Fig. 7B). It is possible that the inclusion of exon 8 changes access to the nuclear import/export signal encoded in HNRNPA1 exon 9 (31,32). Based on their subcellular localization, one would predict that the nuclear HNRNPA1 regulates HMGCR alternative splicing while the cytoplasmic HNRNPA1 modulates transcript stability.
Consistent with the effect of increasing HMGCR13(−) expression levels, we also found that HNRNPA1 overexpression reduces HMGCR enzyme activity, increases LDL uptake and increases cellular concentrations of APOB (Fig. 6). The increased LDL uptake is presumably due to the reduction of intracellular cholesterol levels resulting from lower HMGCR enzyme activity, and consequent up-regulation of LDLR expression. In addition, the greater cellular APOB is consistent with the likelihood that HNRNPA1 overexpression reduces cholesterol synthesis and thus limits cholesterol secretion. However, given the fact that HNRNPA1 has been shown to interact with the promoter of APOE (MIM 107741), another key gene involved in lipoprotein metabolism (33), it is also possible that HNRNPA1 effects on cellular cholesterol metabolism may be mediated by changes in alternative splicing or transcript stability of genes beyond HMGCR that influence these pathways. In addition, since HNRNPA1 has been shown to regulate mRNA translation rates (34), we cannot discount the possibility that HNRNPA1 effects on HMGCR enzyme activity are also due to regulation of protein synthesis.
Here, we report that HNRNPA1 transcript levels are down-regulated with sterol depletion, an effect partially reversed by LDL-C add-back or 25-HC. This finding is consistent with our current finding that HNRNPA1 stimulates HMGCR13(−) expression, as well as our previous report demonstrating that sterol depletion reduces HMGCR13(−) levels relative to 13(+) (9). Although the SREBF2/INSIG/SCAP transcriptional regulatory system is well known to mediate sterol-induced changes in transcription (35–38), neither in silico prediction programs including PROMO, TFBIND and TFSEARCH, nor SREBF2 ChIP-seq analysis have identified a potential SREBF2-binding site in the HNRNPA1 promoter (39), suggesting that sterol-induced changes in HNRNPA1 transcript levels are not directly mediated by SREBF2. Thus, additional study is necessary to determine the molecular mechanism underlying sterol regulation of HNRNPA1.
The role of HNRNPA1 in cholesterol metabolism and statin response was further supported by the discovery of a genetic variant upstream of HNRNPA1, rs1920045, that was correlated with greater statin-induced expression of the HNRNPA1 8(+) transcript (Fig. 7A). Since HNRNPA1 8(+) is found mainly in the nucleus, greater HNRNPA1 8(+) would be predicted to promote HMGCR exon 13 skipping. We have previously shown that increasing the relative ratio of the HMGCR13(−) to 13(+) transcripts reduces the statin sensitivity of the resulting HMGCR enzyme (7), and thus, rs1920045 carriers would be predicted to have reduced cholesterol lowering with statin treatment. Consistent with this hypothesis, we found a modest association between rs1920045 and statin response as minor allele homozygotes in two independent clinical trials of simvastatin and pravastatin had smaller cholesterol reductions (Fig. 7C). rs1920045 is in strong linkage disequilibrium (LD) with rs3809162 (r2 = 1, HapMap CEU) located within the HNRNPA1 promoter (Supplementary Material, Fig. S5). Although HNRNPA1 is known to undergo self-splicing (40), since rs1920045 is not associated with overall HNRNPA1 transcript levels, it is unlikely that SNP-induced changes in overall HNRNPA1 protein levels would explain its association with exon 8 utilization. Furthermore, no SNPs within HNRNPA1 are known to be in LD with rs1920045. However, since previous reports have demonstrated how promoter variation may ultimately impact the transcript structure (41,42), given the LD between rs1920045 and the promoter SNP rs3809162, it is likely that rs1920045 is not the causal variant. Further testing will be required to assess the true functional variant as well as the precise mechanism by which it is related to statin-induced changes in LDL-C. These results suggest that both cis-acting and trans-acting gene variants that impact HMGCR alternative splicing contribute to inter-individual variation in statin-induced plasma cholesterol reduction.
Here, we have shown that HNRNPA1, an mRNA splicing regulator, modulates the expression level of an alternatively spliced transcript of HMGCR by both regulating splicing in an allele-related manner and altering RNA stability, resulting in reduced HMGCR enzyme activity and increased LDL-C uptake. While HNRNPA1 has been previously implicated in a wide variety of cellular processes and disease states, these results for the first time demonstrate that HNRNPA1 also plays a role in cellular cholesterol metabolism. In addition, since genetic variation in HNRNPA1 may contribute to inter-individual differences in statin efficacy, these findings highlight the importance of considering both specific splice variants, and the splicing factors that regulate them, in the identification of markers and determinants of statin response.
MATERIALS AND METHODS
Genome-wide expression analyses
LCLs were established from all participants in the CAP trial and cultured as previously described (7,43–46). Informed consent was obtained under protocols approved by the Committee for the Protection of Human Subjects at Children's Hospital and Research Center Oakland. LCLs (N = 480) normalized to a uniform cell density were exposed to 2 µm simvastatin (Merck) or sham buffer for 24 h. RNA was extracted using a Qiagen RNAeasy kit (Qiagen) with on-column DNAse treatment and converted to biotin-labeled cRNA using the Illumina TotalPrep-96 RNA amplification kit (Applied Biosystems). cRNA was hybridized to Illumina HumanRef-8 v3 expression beadchips (Illumina). Data were analyzed using GenomeStudio (Illumina). All beadchips had a Signal P95/P05 > 10. The GEO DataSet accession number for the CAP gene expression data reported in this paper is GSE36868.
Cell culture
HepG2, Huh7 and Hep3B were grown in Eagle's minimum essential medium (ATCC) supplemented with 10% heat inactivated fetal bovine serum (FBS) (Hyclone). Cultures were maintained at 37°C with 5% CO2. LDL-C was isolated as previously described (47). Cells were exposed in replicate to conditions of sterol depletion [10% lipoprotein-deficient serum (LPDS) and 2 µm activated simvastatin], and after 24 h, either 50 µg/ml LDL-C or 1 µg/ml 25-HC (Sigma-Aldrich) was added for an additional 24 h.
Plasmids
The HNRNPA1 8(−) overexpression plasmid, pCG-A1, was kindly provided by Dr Adrian R. Krainer. The pCG control plasmid was generated by removing the HNRNPA1 8(−) complementary DNA (cDNA) sequence. pLKO.1 scramble shRNA (a non-targeting shRNA control plasmid) was purchased from Sigma-Aldrich. pLKO.1 HNRNPA1 8(−) shRNA (a silence select shRNA construct specific for HNRNPA1) was cloned using the manufacturer's protocol from Addgene. To create the HMGCR mini-genes, a 2-Kbp segment of the HMGCR gene was amplified from introns 11 to 14 using 5′-CACC TGG ATA CAC AGT GAA ACA GTG-3′ and 5′-CCA CTG CGC CCA GTC ACA-3′ forward and reverse primers, cloned into pENTRTMTOPO® vector (Invitrogen), and then subcloned into the pDEST exon-trap vector kindly provided by Dr Stephan Stamm using the Gateway® LR clonase™ enzyme mix (Invitrogen). Site-directed mutagenesis was performed using the Stratagene QuikChange™ kit to generate the rs3846662 ‘A’ allele mini-gene construct from the ‘G’ allele construct. The DNA sequences of all the plasmids were verified by Sanger sequencing.
Transfection experiments
HepG2 and Huh7 plasmid transfections were performed using the GenJet™ In Vitro DNA Transfection Reagent (Ver. II) (SignaGen Laboratories), while Hep3B cells were transfected with Lipofectamine 2000 (Invitrogen). 8 × 10⁵ HepG2, 5 × 10⁵ Huh7 or 2.5 × 10⁵ Hep3B cells were seeded in six-well plates 24 h prior to transfection with pCG-A1, pCG, pLKO.1 HNRNPA1 shRNA or pLKO.1 scramble shRNA. Cellular phenotypes were measured 24 or 48 h after transfection. HNRNPA1 knock-down was also achieved by 18–24 h transfection of 2.5 × 10⁵ HepG2 cells/well in six-well plates with 5–12.5pmol Silencer Select siRNA (Applied Biosystems) using a pSPORTNeoFX transfection agent (Applied Biosystems) and compared with cells transfected with the Silencer Select Negative Control #1 (Applied Biosystems). To assess the effects of HNRNPA1 overexpression on HMGCR exon 13 skipping, pDEST mini-gene plasmids containing either the rs3846662 ‘A’ or ‘G’ allele were co-transfected with either pCG-A1 or pCG for 48 h. In order to measure the effects of HNRNPA1 overexpression on HMGCR transcript stability, the cells were transfected with either pCG-A1 or pCG plasmid for 48 h, treated with 1 µg/ml actinomycin D and harvested over 24 h. Transcript half-life was calculated as previously described (17).
Immunoblotting
HepG2 cells were lysed with the CelLytic™ M Cell Lysis Reagent (Sigma-Aldrich), and protein concentration was determined by a Bradford protein assay (Bio-Rad). Fifteen micrograms of total protein was subjected to sodium dodecyl sulfate-polyacrylamide gel electrophoresis, transferred onto a nitrocellulose membrane, and incubated with anti-human HNRNPA1 (Santa Cruz Biotechnology, sc-56700) and β-actin (Santa Cruz Biotechnology, sc-81178) antibodies at the dilution of 1:200. Blots were then incubated with a horseradish peroxidase-conjugated anti-mouse IgG antibody (Santa Cruz Biotechnology, sc-2005). The SuperSignal West Femto Substrate (Thermo Scientific, 34095) was used for detection of peroxidase activity. Nuclear and cytoplasmic fractions were isolated using the NE-PER Nuclear and Cytoplasmic Extraction Reagents (Pierce Biotechnology).
Transcript quantification
RNA was isolated using the Qiagen RNAeasy kit with DNase I digestion, and cDNA was synthesized using the Applied Biosystems cDNA archive kit. HNRNPA1 8(−) mRNA levels were quantified by SYBR Green assays using an exon 7–9 forward primer (5′-GGT AAT GAT GGA AGC AAT TTT GGA G-3′) and exon 9 reverse primer (5′-TTT CGT GGT TTT GCA AAG TAT TGG-3′), while HNRNPA1 8(+) transcripts were measured by SYBR Green assays with an exon 7 forward primer (5′- GGA TGG CTA TAA TGG ATT TGG TAA-3′) and exon 8 reverse primer (5′-TTA TAG CTG TCA TAG CTG CCA CTC-3′). Endogenous HMGCR splice variants were quantified and normalized to CLPTM1 as previously described (7,9). HMGCR mini-gene derived transcripts were quantified using the pDEST forward primer (5′-GAA GCT CTC TAC CTG GTG TG-3′), coupled with one of the three reverse primers to measure total mHMGCR: 5′-ACA CCA CGC TCA TGA GTT TCC ATC-3′, mHMGCR13(−): 5′-ACC TCC ACC AAG CAA GGA GT-3′, or mHMGCR13(+): 5′-CAT TCT CAC AAC AAG CTC CCA-3′. For RIP assays, endogenous HMGCR intron 13 containing transcripts (or HMGCR pre-mRNA) was detected using a forward primer that spans the HMGCR exon 13–intron 13 splice junction (5′- AGC AAT AGG TGT AAG TTG GCA-3′) and a reverse primer that spans the HMGCR exon 14–intron 13 splice junction (5′- CTC CAC CAA GCT ACA CAG TA-3′). To detect mini-gene-derived transcripts, mHMGCR pre-mRNA levels were quantified by the pDEST spacer forward primer (5′- GGT GGT GAC GGG TGG CTA-3′) and the HMGCR intron 11 reverse primer (5′- GGT ACC ACT GTT TCA CTG TG), while the mHMGCR mRNA amount was analyzed by the primer set detecting total mHMGCR.
RIP assays
HepG2 cells (6 × 10⁶) were plated in a T-75 flask 24 h prior to transfection. Co-transfections were carried out as described above with 7.5 µg of either the pCG control or pCG-A1 overexpression construct as well as 7.5 µg of either the ‘A’ or ‘G’ allele containing the HMGCR mini-gene construct. After 48 h, cell pellets were washed twice with ice-cold PBS and subject to RIP using the Imprint RIP kit (Sigma-Aldrich) following the manufacturer's protocol with the harsh lysis buffer. Briefly, the cell lysate was equally divided with 10% of each saved as input (before antibody pull-down sample). 2.5 µg of either mouse monoclonal anti-human HNRNPA1 (Santa Cruz Biotechnology, sc-56700) antibody or mouse normal IgG (Sigma-Aldrich) was added to the remaining lysates, and rotated at 4°C overnight. Twenty microliters of washed protein A magnetic beads were added to each tube, rotated at 4°C for 1 h, and protein A magnetic beads were washed five times. Immunoprecipitated RNA was isolated using the TRI reagent (Sigma-Aldrich) and RNA quantified by qPCR as described above. The relative enrichment of the HMGCR rs3846662 ‘A’ allele versus ‘G’ allele containing mini-gene transcripts after HNRNPA1 pull-down was calculated by normalizing values first to its respective pCG and IgG control, and then to the relative degree of HNRNPA1 overexpression quantified by HNRNPA1 transcript levels. Protein from immunoprecipitation was also subject to anti-HNRNPA1 western blot as described above to verify HNRNPA1 protein pull-down.
RNA EMSA
3′-end-biotinylated RNA oligonucleotides were synthesized from Sigma-Aldrich. Purified N-terminal His-tagged human recombinant HNRNPA1 (His-HNRNPA1) protein was purchased from Prospec. An RNA gel shift assay was carried out using a LightShift Chemiluminescent RNA EMSA kit (Thermo Scientific). RNA oligos with either the HMGCR rs3846662 ‘A’ or ‘G’ allele were incubated for 30 min in the presence or absence of His-HNRNPA1 protein in 1× binding buffer, 5% glycerol, 2 µg tRNA and 6.25 nm biotin-labeled RNA oligos. A positive control probe (aka A1 win probe) containing three repeats of the HNRNPA1-binding motif was also used to validate the binding ability of the recombinant His-HNRNPA1 protein. 5× loading dye was added to each reaction, loaded onto a 4–20% Novex® TBE Gel (Life Technologies), and run at 100 V for 2 h in 0.5× Novex® TBE Running Buffer (Invitrogen) at 4°C. The RNA–protein complexes were transferred from the gel to a nylon membrane (Thermo Scientific) at 35 V for 40 min in a 4°C cold room, and crosslinked using the Stratalinker UV crosslinker (Stratagene). Biotin-labeled RNA oligos were detected by the chemiluminescent nucleic acid detection module (Thermo Scientific), and quantified using the GelQuant.NET software.
Measurement of cellular phenotypes
HMGCR enzyme activity, LDL-C uptake and cellular APOB were assayed in HepG2 cells after 24 h of HNRNPA1 8(−) overexpression. HMGCR enzyme activity was quantified in 1 × 10⁶ cells as previously described (7). To quantify LDL-C uptake, cells were incubated with 10 µg/ml of Dil-LDL (Biomedical Technologies Inc., bt904) for 3–4 h at 37°C, washed twice with ice-cold PBS and scraped from the wells. Dil was quantified by fluorescence-activated cell sorting on the BD FACS Calibur Flow Cytometer, with values obtained as the average of 10 000 gated events. Cells were lysed with 0.25% Triton X-100, and APOB concentrations were quantified by enzyme-linked immunosorbent assay (ELISA) and normalized to total cellular protein as previously described (48,49). Intracellular cholesterol was measured using the Amplex® Red cholesterol assay kit (Invitrogen). Briefly, washed cell pellets were resuspended in 500 µl of hexane/isopropyl alcohol (3:2, v/v), nitrogen flushed, vortexed at 3000 r.p.m. for 1 h and centrifuged at 14 000 r.p.m. (Eppendorf rotor FA-45-24-11) for 5 min. The clear lipid extract was dried under N2 and assayed based on manufacturer's instructions.
Genetic association analyses
Self-reported Caucasian individuals from the CAP (43) and PRINCE (6) clinical trials had been genotyped on the Illumina HumanHap 300K or HumanHap 610K-Quad platforms as described previously (50). Informed consent was obtained under protocols approved by the institutional review boards of the respective institutions. Two genotyped SNPs on these platforms were identified within 10 kb of HNRNPA1 (rs1920045 and rs10506328). Expression array probe ILMN_1663447 was used as a proxy for total HNRNPA1 transcript levels and had the sequence 5′-AAGGTAGGCTGGCAGATACGTTCGTCAGCTTGCTCCTTTCTGCCCGTGGA-3′, while ILMN_1815882 with the sequence 5′-TTATGGAGGAGGCGGCCCTGGTTACTCTGGAGGAAGCAGAGGCTATGGAA-3′ represented HNRNPA1 8(+) transcript levels. HNRNPA1 expression phenotypes were derived from expression array probe levels by first adjusting for sex, statin exposure batch, RNA batch and array batch using linear regression and subsequently adding the residuals from this regression to the mean unadjusted values before covariate adjustment for each probe. Statin-induced changes (ln(statin)-ln(baseline)) in in vivo total cholesterol and LDL-C were adjusted for sex, age, BMI, smoking status and study (in the case of the CAP and PRINCE combined analyses) using linear regression, and the residuals from this regression were added to the mean unadjusted values before covariate adjustment for each phenotype. Additive association analyses were conducted using linear regression with genotypes coded as the number of minor alleles, and recessive association analyses were conducted using unpaired, one- or two-sided Student's t-tests.
SUPPLEMENTARY MATERIAL
FUNDING
This work was supported by the NIH (R01 HL104133, U19 HL069757).
Supplementary Material
ACKNOWLEDGEMENTS
We thank Dr Ronald M. Krauss for his scientific discussion and critical review of this manuscript.
Conflict of Interest statement. None declared.
REFERENCES
- 1.Goldstein J.L., Brown M.S. Regulation of the mevalonate pathway. Nature. 1990;343:425–430. doi: 10.1038/343425a0. [DOI] [PubMed] [Google Scholar]
- 2.Burkhardt R., Kenny E.E., Lowe J.K., Birkeland A., Josowitz R., Noel M., Salit J., Maller J.B., Pe'er I., Daly M.J., et al. Common SNPs in HMGCR in micronesians and whites associated with LDL-cholesterol levels affect alternative splicing of exon13. Arterioscler Thromb. Vasc. Biol. 2008;28:2078–2084. doi: 10.1161/ATVBAHA.108.172288. [DOI] [PMC free article] [PubMed] [Google Scholar]
- 3.Aulchenko Y.S., Ripatti S., Lindqvist I., Boomsma D., Heid I.M., Pramstaller P.P., Penninx B.W., Janssens A.C., Wilson J.F., Spector T., et al. Loci influencing lipid levels and coronary heart disease risk in 16 European population cohorts. Nat. Genet. 2009;41:47–55. doi: 10.1038/ng.269. [DOI] [PMC free article] [PubMed] [Google Scholar]
- 4.Teslovich T.M., Musunuru K., Smith A.V., Edmondson A.C., Stylianou I.M., Koseki M., Pirruccello J.P., Ripatti S., Chasman D.I., Willer C.J., et al. Biological, clinical and population relevance of 95 loci for blood lipids. Nature. 2010;466:707–713. doi: 10.1038/nature09270. [DOI] [PMC free article] [PubMed] [Google Scholar]
- 5.Krauss R.M., Mangravite L.M., Smith J.D., Medina M.W., Wang D., Guo X., Rieder M.J., Simon J.A., Hulley S.B., Waters D., et al. Variation in the 3-hydroxyl-3-methylglutaryl coenzyme a reductase gene is associated with racial differences in low-density lipoprotein cholesterol response to simvastatin treatment. Circulation. 2008;117:1537–1544. doi: 10.1161/CIRCULATIONAHA.107.708388. [DOI] [PubMed] [Google Scholar]
- 6.Chasman D.I., Posada D., Subrahmanyan L., Cook N.R., Stanton V.P., Jr, Ridker P.M. Pharmacogenetic study of statin therapy and cholesterol reduction. JAMA. 2004;291:2821–2827. doi: 10.1001/jama.291.23.2821. [DOI] [PubMed] [Google Scholar]
- 7.Medina M.W., Gao F., Ruan W., Rotter J.I., Krauss R.M. Alternative splicing of 3-hydroxy-3-methylglutaryl coenzyme A reductase is associated with plasma low-density lipoprotein cholesterol response to simvastatin. Circulation. 2008;118:355–362. doi: 10.1161/CIRCULATIONAHA.108.773267. [DOI] [PMC free article] [PubMed] [Google Scholar]
- 8.Brown M.S., Goldstein J.L. Multivalent feedback regulation of HMG CoA reductase, a control mechanism coordinating isoprenoid synthesis and cell growth. J. Lipid Res. 1980;21:505–517. [PubMed] [Google Scholar]
- 9.Medina M.W., Gao F., Naidoo D., Rudel L.L., Temel R.E., McDaniel A.L., Marshall S.M., Krauss R.M. Coordinately regulated alternative splicing of genes involved in cholesterol biosynthesis and uptake. PLoS One. 2011;6:e19420. doi: 10.1371/journal.pone.0019420. [DOI] [PMC free article] [PubMed] [Google Scholar]
- 10.Mangravite L.M., Engelhardt B.E., Medina M.W., Smith J.D., Brown C.D., Chasman D.I., Mecham B.H., Howie B., Shim H., Naidoo D., et al. A statin-dependent QTL for GATM expression is associated with statin-induced myopathy. Nature. 2013 doi: 10.1038/nature12508. doi:10.1038/nature12508. [DOI] [PMC free article] [PubMed] [Google Scholar]
- 11.Desmet F.O., Hamroun D., Lalande M., Collod-Beroud G., Claustres M., Beroud C. Human splicing finder: an online bioinformatics tool to predict splicing signals. Nucleic Acids Res. 2009;37:e67. doi: 10.1093/nar/gkp215. [DOI] [PMC free article] [PubMed] [Google Scholar]
- 12.Bai Y., Lee D., Yu T., Chasin L.A. Control of 3′ splice site choice in vivo by ASF/SF2 and hnRNP A1. Nucleic Acids Res. 1999;27:1126–1134. doi: 10.1093/nar/27.4.1126. [DOI] [PMC free article] [PubMed] [Google Scholar]
- 13.Mayeda A., Krainer A.R. Regulation of alternative pre-mRNA splicing by hnRNP A1 and splicing factor SF2. Cell. 1992;68:365–375. doi: 10.1016/0092-8674(92)90477-t. [DOI] [PubMed] [Google Scholar]
- 14.Caceres J.F., Stamm S., Helfman D.M., Krainer A.R. Regulation of alternative splicing in vivo by overexpression of antagonistic splicing factors. Science. 1994;265:1706–1709. doi: 10.1126/science.8085156. [DOI] [PubMed] [Google Scholar]
- 15.Burd C.G., Dreyfuss G. RNA Binding specificity of hnRNP A1: significance of hnRNP A1 high-affinity binding sites in pre-mRNA splicing. EMBO J. 1994;13:1197–1204. doi: 10.1002/j.1460-2075.1994.tb06369.x. [DOI] [PMC free article] [PubMed] [Google Scholar]
- 16.Hamilton B.J., Burns C.M., Nichols R.C., Rigby W.F. Modulation of AUUUA response element binding by heterogeneous nuclear ribonucleoprotein A1 in human T lymphocytes. The roles of cytoplasmic location, transcription, and phosphorylation. J. Biol. Chem. 1997;272:28732–28741. doi: 10.1074/jbc.272.45.28732. [DOI] [PubMed] [Google Scholar]
- 17.George T.N., Miakotina O.L., Goss K.L., Snyder J.M. Mechanism of all trans-retinoic acid and glucocorticoid regulation of surfactant protein mRNA. Am. J. Physiol. 1998;274:L560–e19566. doi: 10.1152/ajplung.1998.274.4.L560. [DOI] [PubMed] [Google Scholar]
- 18.Houten S.M., Koster J., Romeijn G.J., Frenkel J., Di Rocco M., Caruso U., Landrieu P., Kelley R.I., Kuis W., Poll-The B.T., et al. Organization of the mevalonate kinase (MVK) gene and identification of novel mutations causing mevalonic aciduria and hyperimmunoglobulinaemia D and periodic fever syndrome. Eur. J. Hum. Genet. 2001;9:253–259. doi: 10.1038/sj.ejhg.5200595. [DOI] [PubMed] [Google Scholar]
- 19.Holla O.L., Nakken S., Mattingsdal M., Ranheim T., Berge K.E., Defesche J.C., Leren T.P. Effects of intronic mutations in the LDLR gene on pre-mRNA splicing: comparison of wet-lab and bioinformatics analyses. Mol. Genet. Metab. 2009;96:245–252. doi: 10.1016/j.ymgme.2008.12.014. [DOI] [PubMed] [Google Scholar]
- 20.Zhu H., Tucker H.M., Grear K.E., Simpson J.F., Manning A.K., Cupples L.A., Estus S. A common polymorphism decreases low-density lipoprotein receptor exon 12 splicing efficiency and associates with increased cholesterol. Hum. Mol. Genet. 2007;16:1765–1772. doi: 10.1093/hmg/ddm124. [DOI] [PMC free article] [PubMed] [Google Scholar]
- 21.Schmidt R.J., Zhang Y., Zhao Y., Qian Y.W., Wang H., Lin A., Ehsani M.E., Yu X., Wang G., Singh J., et al. A novel splicing variant of proprotein convertase subtilisin/kexin type 9. DNA Cell Biol. 2008;27:183–189. doi: 10.1089/dna.2007.0667. [DOI] [PubMed] [Google Scholar]
- 22.Gil G., Smith J.R., Goldstein J.L., Brown M.S. Optional exon in the 5′-untranslated region of 3-hydroxy-3-methylglutaryl coenzyme A synthase gene: conserved sequence and splicing pattern in humans and hamsters. Proc. Natl Acad. Sci. USA. 1987;84:1863–1866. doi: 10.1073/pnas.84.7.1863. [DOI] [PMC free article] [PubMed] [Google Scholar]
- 23.Reardon H.T., Park W.J., Zhang J., Lawrence P., Kothapalli K.S., Brenna J.T. The polypyrimidine tract binding protein regulates desaturase alternative splicing and PUFA composition. J. Lipid Res. 2011;52:2279–2286. doi: 10.1194/jlr.M019653. [DOI] [PMC free article] [PubMed] [Google Scholar]
- 24.Pihlajamaki J., Lerin C., Itkonen P., Boes T., Floss T., Schroeder J., Dearie F., Crunkhorn S., Burak F., Jimenez-Chillaron J.C., et al. Expression of the splicing factor gene SFRS10 is reduced in human obesity and contributes to enhanced lipogenesis. Cell Metab. 2011;14:208–218. doi: 10.1016/j.cmet.2011.06.007. [DOI] [PMC free article] [PubMed] [Google Scholar]
- 25.Del Gatto-Konczak F., Olive M., Gesnel M.C., Breathnach R. hnRNP A1 recruited to an exon in vivo can function as an exon splicing silencer. Mol. Cell Biol. 1999;19:251–260. doi: 10.1128/mcb.19.1.251. [DOI] [PMC free article] [PubMed] [Google Scholar]
- 26.Ge H., Manley J.L. A protein factor, ASF, controls cell-specific alternative splicing of SV40 early pre-mRNA in vitro. Cell. 1990;62:25–34. doi: 10.1016/0092-8674(90)90236-8. [DOI] [PubMed] [Google Scholar]
- 27.Krainer A.R., Conway G.C., Kozak D. The essential pre-mRNA splicing factor SF2 influences 5′ splice site selection by activating proximal sites. Cell. 1990;62:35–42. doi: 10.1016/0092-8674(90)90237-9. [DOI] [PubMed] [Google Scholar]
- 28.Mayeda A., Helfman D.M., Krainer A.R. Modulation of exon skipping and inclusion by heterogeneous nuclear ribonucleoprotein A1 and pre-mRNA splicing factor SF2/ASF. Mol. Cell Biol. 1993;13:2993–3001. doi: 10.1128/mcb.13.5.2993. [DOI] [PMC free article] [PubMed] [Google Scholar]
- 29.Nowak D.G., Woolard J., Amin E.M., Konopatskaya O., Saleem M.A., Churchill A.J., Ladomery M.R., Harper S.J., Bates D.O. Expression of pro- and anti-angiogenic isoforms of VEGF is differentially regulated by splicing and growth factors. J. Cell Sci. 2008;121:3487–3495. doi: 10.1242/jcs.016410. [DOI] [PMC free article] [PubMed] [Google Scholar]
- 30.Screaton G.R., Caceres J.F., Mayeda A., Bell M.V., Plebanski M., Jackson D.G., Bell J.I., Krainer A.R. Identification and characterization of three members of the human SR family of pre-mRNA splicing factors. EMBO J. 1995;14:4336–4349. doi: 10.1002/j.1460-2075.1995.tb00108.x. [DOI] [PMC free article] [PubMed] [Google Scholar]
- 31.Siomi H., Dreyfuss G. A nuclear localization domain in the hnRNP A1 protein. J. Cell Biol. 1995;129:551–560. doi: 10.1083/jcb.129.3.551. [DOI] [PMC free article] [PubMed] [Google Scholar]
- 32.Michael W.M., Choi M., Dreyfuss G. A nuclear export signal in hnRNP A1: a signal-mediated, temperature-dependent nuclear protein export pathway. Cell. 1995;83:415–422. doi: 10.1016/0092-8674(95)90119-1. [DOI] [PubMed] [Google Scholar]
- 33.Campillos M., Lamas J.R., Garcia M.A., Bullido M.J., Valdivieso F., Vazquez J. Specific interaction of heterogeneous nuclear ribonucleoprotein A1 with the -219T allelic form modulates APOE promoter activity. Nucleic Acids Res. 2003;31:3063–3070. doi: 10.1093/nar/gkg435. [DOI] [PMC free article] [PubMed] [Google Scholar]
- 34.Cammas A., Pileur F., Bonnal S., Lewis S.M., Leveque N., Holcik M., Vagner S. Cytoplasmic relocalization of heterogeneous nuclear ribonucleoprotein A1 controls translation initiation of specific mRNAs. Mol. Biol. Cell. 2007;18:5048–5059. doi: 10.1091/mbc.E07-06-0603. [DOI] [PMC free article] [PubMed] [Google Scholar]
- 35.Brown M.S., Goldstein J.L. A proteolytic pathway that controls the cholesterol content of membranes, cells, and blood. Proc. Natl Acad. Sci. USA. 1999;96:11041–11048. doi: 10.1073/pnas.96.20.11041. [DOI] [PMC free article] [PubMed] [Google Scholar]
- 36.Sakai J., Duncan E.A., Rawson R.B., Hua X., Brown M.S., Goldstein J.L. Sterol-regulated release of SREBP-2 from cell membranes requires two sequential cleavages, one within a transmembrane segment. Cell. 1996;85:1037–1046. doi: 10.1016/s0092-8674(00)81304-5. [DOI] [PubMed] [Google Scholar]
- 37.Smith J.R., Osborne T.F., Brown M.S., Goldstein J.L., Gil G. Multiple sterol regulatory elements in promoter for hamster 3-hydroxy-3-methylglutaryl-coenzyme A synthase. J. Biol. Chem. 1988;263:18480–18487. [PubMed] [Google Scholar]
- 38.Horton J.D., Goldstein J.L., Brown M.S. SREBPs: activators of the complete program of cholesterol and fatty acid synthesis in the liver. J. Clin. Invest. 2002;109:1125–1131. doi: 10.1172/JCI15593. [DOI] [PMC free article] [PubMed] [Google Scholar]
- 39.Chen M., Zhang J., Manley J.L. Turning on a fuel switch of cancer: hnRNP proteins regulate alternative splicing of pyruvate kinase mRNA. Cancer Res. 2010;70:8977–8980. doi: 10.1158/0008-5472.CAN-10-2513. [DOI] [PMC free article] [PubMed] [Google Scholar]
- 40.Blanchette M., Chabot B. Modulation of exon skipping by high-affinity hnRNP A1-binding sites and by intron elements that repress splice site utilization. EMBO J. 1999;18:1939–1952. doi: 10.1093/emboj/18.7.1939. [DOI] [PMC free article] [PubMed] [Google Scholar]
- 41.Cramer P., Pesce C.G., Baralle F.E., Kornblihtt A.R. Functional association between promoter structure and transcript alternative splicing. Proc. Natl Acad. Sci. USA. 1997;94:11456–11460. doi: 10.1073/pnas.94.21.11456. [DOI] [PMC free article] [PubMed] [Google Scholar]
- 42.Cramer P., Caceres J.F., Cazalla D., Kadener S., Muro A.F., Baralle F.E., Kornblihtt A.R. Coupling of transcription with alternative splicing: RNA pol II promoters modulate SF2/ASF and 9G8 effects on an exonic splicing enhancer. Mol. Cell. 1999;4:251–258. doi: 10.1016/s1097-2765(00)80372-x. [DOI] [PubMed] [Google Scholar]
- 43.Simon J.A., Lin F., Hulley S.B., Blanche P.J., Waters D., Shiboski S., Rotter J.I., Nickerson D.A., Yang H., Saad M., et al. Phenotypic predictors of response to simvastatin therapy among African-Americans and Caucasians: the Cholesterol and Pharmacogenetics (CAP) Study. Am. J. Cardiol. 2006;97:843–850. doi: 10.1016/j.amjcard.2005.09.134. [DOI] [PubMed] [Google Scholar]
- 44.Anderson M.A., Gusella J.F. Use of cyclosporin A in establishing Epstein-Barr virus-transformed human lymphoblastoid cell lines. In Vitro. 1984;20:856–858. doi: 10.1007/BF02619631. [DOI] [PubMed] [Google Scholar]
- 45.Boyum A. Separation of white blood cells. Nature. 1964;204:793–794. doi: 10.1038/204793a0. [DOI] [PubMed] [Google Scholar]
- 46.Pressman S., Rotter J.I. Epstein-Barr virus transformation of cryopreserved lymphocytes: prolonged experience with technique. Am. J. Hum. Genet. 1991;49:467. [PMC free article] [PubMed] [Google Scholar]
- 47.Shen M.M., Krauss R.M., Lindgren F.T., Forte T.M. Heterogeneity of serum low density lipoproteins in normal human subjects. J. Lipid Res. 1981;22:236–244. [PubMed] [Google Scholar]
- 48.Wilcox L.J., Barrett P.H., Newton R.S., Huff M.W. Apob100 secretion from HepG2 cells is decreased by the ACAT inhibitor CI-1011: an effect associated with enhanced intracellular degradation of ApoB. Arterioscler. Thromb. Vasc. Biol. 1999;19:939–949. doi: 10.1161/01.atv.19.4.939. [DOI] [PubMed] [Google Scholar]
- 49.Miwa Y., Mitsuzumi H., Yamada M., Arai N., Tanabe F., Okada K., Kubota M., Chaen H., Sunayama T., Kibata M. Suppression of apolipoprotein B secretion from HepG2 cells by glucosyl hesperidin. J. Nutr. Sci. Vitaminol. 2006;52:223–231. doi: 10.3177/jnsv.52.223. [DOI] [PubMed] [Google Scholar]
- 50.Barber M.J., Mangravite L.M., Hyde C.L., Chasman D.I., Smith J.D., McCarty C.A., Li X., Wilke R.A., Rieder M.J., Williams P.T., et al. Genome-wide association of lipid-lowering response to statins in combined study populations. PLoS One. 2010;5:e9763. doi: 10.1371/journal.pone.0009763. [DOI] [PMC free article] [PubMed] [Google Scholar]
Associated Data
This section collects any data citations, data availability statements, or supplementary materials included in this article.