

Abstract
Inherent chemical programmability available in peptide-based hydrogels has allowed diversity in the development of these materials for use in biomedical applications. Within the 20 natural amino acids, a range of chemical moieties are present. Here we used a mixing-induced self-assembly of two oppositely charged peptide modules to form a peptide-based hydrogel. To investigate electrostatic and polar interactions on the hydrogel, we replace amino acids from the negatively charged acidic glutamic acid (E) to the uncharged polar glutamine (Q) on a negatively charged peptide module, while leaving the positively charged module unchanged. Using dynamic rheology, the mechanical properties of each hydrogel were investigated. It was found that the number, but not the location, of electrostatic interactions (E residues) dictate the elastic modulus (G′) of the hydrogel, compared to polar interactions (Q residues). Increased electrostatic interactions also promote faster peptide assembly into the hydrogel matrix, and result in the decrease of T2 relaxation times of H2O and TFA. Small-angle X-ray scattering (SAXS) showed that changing from electrostatic → polar interactions affects the ability to form fibrous networks: from the formation of elongated fibers to no fiber assembly. This study reveals the systematic effects that the incorporation of electrostatic and polar interactions have when programmed into peptide-based hydrogel systems. These effects could be used to design peptide-based biomaterials with predetermined properties.
Keywords: hydrogels, dynamic rheometry, viscoelasticity, transport properties, small-angle X-ray scattering (SAXS), nuclear magnetic resonance (NMR)
Introduction
Peptide-based materials are being developed as a simple and versatile class of materials with applications in drug delivery,1,2 tissue engineering,3 and biosensing.4 For example, PuraMatrix™, a peptide hydrogel, is now commercially available for 3D cell culture applications. The advantages of using peptides as biomaterials over synthetic polymers or small molecules include their chemical accessibility via solid phase peptide synthesis (SPPS),5,6 propensity to assemble into defined three-dimensional structures,7 and inherent biocompatibility.8 In particular, the molecular characteristics of peptides, including sequence, chain length, charge density, and chirality, can be precisely controlled. A range of chemical functionalities are present within the 20 natural amino acids, allowing the design of peptide materials that are responsive to an array of chemical stimuili.9 These advantages displayed by peptide materials led to their development for novel biotechnology applications.10
Hydrogels are water swollen viscoelastic networks that can stay insoluble and maintain shape, supported by non-covalent or covalent interactions. 11 Non-covalent cross-links can be introduced by electrostatic, polar, or hydrophobic interactions for the formation of physical hydrogels. Using a balance between electrostatic and polar interactions to prompt gelation has gained recognition in hydrogel design.3, 12, 13 Manipulation of non-covalent interactions can be a useful method to control hydrogel self-assembly, and also to alter mechanical properties of the hydrogel.14 Self-assembly driven by electrostatic interactions can be triggered by a change of pH or ionic strength.3 Polar interactions such as hydrogen bonding by amino acid side chains have also shown to be important in hydrogel design. We previously developed a pair of mutually complementary and self-repulsive peptides that upon mixing form a hydrogel via electrostatic attraction.15, 16 One peptide contained alternating positively charged (e.g., lysine (K)) and neutral amino acids (e.g., tryptophan (W), alanine (A)) in its sequence while the other contained alternating negatively charged (e.g., glutamic acid (E)) and neutral amino acids (e.g., W and A) in its sequence. Each peptide was highly soluble in phosphate-buffered saline (PBS), and upon mixing, the two oppositely charged peptides co-assembled into a hydrogel. This approach makes it possible to avoid using external chemical stimuli to induce gelation. In turn it allows precise control of the chemical composition of the hydrogel system.
To enhance chemical control in peptide hydrogels, it is essential to know how hydrogel properties are affected by the molecular characteristics of its constitutive peptides. Previously, we investigated the effect of temperature, 16 peptide terminal chemistries,17 and chain length18 on the mechanical properties of peptide hydrogels. We also investigated how the lipophilicity of small encapsulated molecules affected their diffusion coefficients within a hydrogel.19 In this work, we investigated how electrostatic and polar interactions programmed into our peptide sequence influence the mechanical, transport, and structural properties of peptide hydrogels. To this end, two closely related amino acids, negatively charged glutamic acid (E) and polar but neutral glutamine (Q), were incorporated into our peptide module for a systematic comparison of the effect of electrostatic and polar interactions on the hydrogel assembly. Glutamic acid (E) contains a carboxylic group (-COO−) on its side chain for electrostatic interactions, while glutamine (Q) contains an amide group (-CONH2) for polar interactions. This simple variation in the amino acid side chain allowed us to attribute all differences in the resulting hydrogels to electrostatic vs. polar interactions. Here, polar interactions include potential hydrogen bonding interactions.
Here we designed a series of negatively charged peptide modules with different numbers and locations of E → Q substitutions that upon mixing with a positively charged peptide module form hydrogels. The gelation process was monitored by nuclear magnetic resonance (NMR) spectroscopy and dynamic rheometry. Structural aspects of the matured hydrogels were characterized by small-angle X-ray scattering (SAXS), NMR diffusion, and nuclear spin relaxation parameters.
Materials and Methods
Peptide Design and Synthesis
Sequences of the five peptide modules, one positive and four negative, are shown in Figure 1. All peptides were synthesized by Fmoc Chemistry on Rink Amide MBHA resin using a CEM Liberty Microwave Peptide Synthesis system. All amino acids were purchased from aapptec Inc. and used without further purification. In the last step of the solid-phase synthesis, the N-terminal of each peptide was acetylated using 10% acetic anhydride in DMF. Using a cleavage cocktail (95% trifluoroacetic acid with 2.5% triisopropyl silane and 2.5 % water), peptides were cleaved off the resin. The cleavage products were concentrated under nitrogen gas flow and then precipitated and washed multiple times with cold ether. The crude products were then dissolved in a H2O/CH3CN (80:20 v/v) mixture and lyophilized. Using reverse-phase liquid chromatography (HPLC), the crude peptides were purified on a ZORBAX 300SB- C8 21.2 × 250 mm, 7 μm column. All purifications used a two-eluent linear gradient method as previously described20 on a HP1100 chromatograph system. Peptide 1 (P1) used 0.1% TFA in H2O as eluent A and 0.1% TFA in MeOH as eluent B; peptides 2–5 (P2-P5) used 20 mM NH4HCO3 in H2O at pH 7.4 as eluent A and 20 mM NH4HCO3 in H2O/MeOH (20:80v/v) at pH 7.4 as eluent B. Pure fractions were collected, combined and lyophilized. Following column purification, each peptide was dialyzed against water at room temperature for 2–3 days using a 100–500 Da molecular weight cutoff cellulose ester dialysis membrane, and then lyophilized leaving a white peptide powder. The molecular weight and purity of each purified peptide were verified using ESI-MS and analytical HPLC, respectively. See Supporting Information for MS and analytical HPLC analysis results for each peptide.
Figure 1.
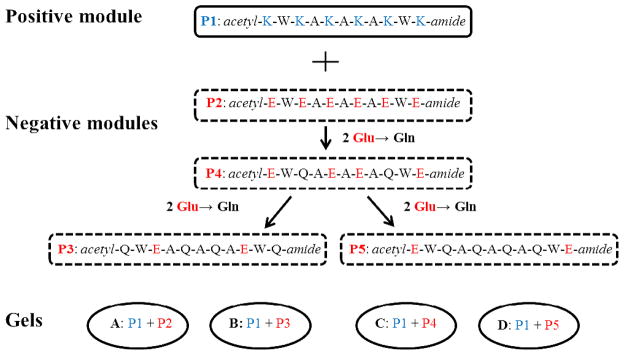
Sequences of a positive peptide module (P1) and four negative peptide modules (P2 – P4). Four hydrogels were formed by pairing the positive module with one of the four negative modules.
A, alaine; E, glutamic acid; K, lysine; Q, glutamine; W, tryptophan. The N-, C-termini of each peptide were acetylated (acetyl-) and amidated (-amide), respectively.
Sample Preparation
Each peptide powder was dissolved in PBS (50 mM NaHPO4, 100 mM NaCl, pH 7.4). The solvent was H2O for rheology experiments and D2O for NMR and SAXS measurements. The peptide concentration of each sample was determined based on the UV absorption of the two tryptophan (W) residues in each peptide, using an extinction coefficient of 5690 M−1 cm−1 at 280 nm for each W.18 The conductivity of each solution was adjusted to 25 mS/cm by addition of saturated NaCl to PBS solution to keep the ionic strength the same in all solutions. The final concentration of each peptide samples was 16 mM prior to mixing. Two peptide solutions of equal volume were mixed to form the hydrogel, leaving the concentration of each peptide equal to 8 mM in the hydrogel for NMR, rheological and SAXS measurements. All sample preparation procedures and measurements were performed at 25°C with a final pH of 7.4.
NMR Spectroscopy Measurements
All samples were prepared as stated above in D2O PBS and transferred into a 5-mm NMR tube. Trace amounts of TSP (trimethylsilyl-2,2,3,3-tetradeuteropropionic acid) were added to each sample as a 1H chemical shift reference at 0.0 ppm. A Varian 400 MHz NMR spectrometer was used for all experiments at 25°C. Proton signal intensity of the peptide was recorded every 10 minutes during the first 3 hours of gelation, then every 2 hours until reaching 15 hours, and again at 24 hours of gelation. Diffusion coefficients (D) and relaxation times T1 and T2 of H2O and trifluoroacetic acid (TFA) were measured for each peptide solution and hydrogels by 1H and 19F NMR spectroscopy, respectively. These measurements were conducted ~48 hours after mixing when the hydrogels were matured and their mechanical stiffness (G′), detected from rheological experiments, reached its plateau value. All samples contained trace amounts of TFA from the cleavage step, which served as a probe to evaluate small molecule diffusion and relaxation inside the hydrogels using 19F NMR. The diffusion coefficient (D) was measured using a pulsed-field gradient (PFG) method (BPP-LED pulse sequence).21 To measure spin-lattice and spin-spin relaxation times, T1 and T2, the inversion-recovery22 and CPMG23 pulse sequences were used, respectively.
Dynamic Rheometry
Sample Loading
Four samples in H2O PBS were made from the mixing of two oppositely charged peptides pairs: P1+P2 (Gel A), P1+P3 (Gel B), P1+P4 (Gel C), P1+P5 (Gel D). Aliquots of 200 μL of 16 mM peptide solution were centrifuged for 10 min at 8000 rpm, and then degassed at house vacuum (14 torr) in a dessicator for 1 min. Equal aliquots of each solution of a peptide pair were then mixed through a Y-shaped connector in the rheometer cell. Rheological monitoring of the gelation process started immediately after mixing.
Rheological Measurements
Dynamic rheological measurements were completed using a NOVA Rheometer. The rheometer is equipped with a null balance system that allows for control and analysis of nano-torque and nano-strain measurements. To prevent dehydration of water-based samples during prolonged measurements, this instrument is also equipped with sealed-cell geometry and with an in-house designed system that was used to humidify the incoming air for the sealed-cell bearing as previously shown.18 Rheological characterizations were performed using a 25-mm diameter cone-and-plate steel geometry (4° angle). To monitor gelation kinetics, time-sweep measurements were conducted at 0.2% strain amplitude and 1 rad/s angular frequency, with each data point taken every 180 s. Following time-sweep measurements, frequency-sweep measurements were collected at 25°C with a 0.2% strain amplitude and angular frequencies that varied from 0.01 to 100 rad/s in log mode with 18 points per decade. In the frequency-sweep experiment, the number of integration cycles, Nc, was varied from 1 to 500. The greater number of integration cycles corresponds to higher frequency values. Nc ≈ 1 + 500 × (ωi/ωmax), where ωi is the angular frequency of the i-th measurement, ωmax is the maximum angular frequency, and here ωmax = 100 rad/s. The delay time between the start of application of the respective frequency, stress, and the start of data acquisition for calculations was varied from 65 s to 5 s in reciprocal proportion to the angular frequency. Following frequency-sweep, a 3-hr equilibration time-sweep of each sample was done at 0.2% strain amplitude and 1 rad/s angular frequency to confirm that the gel was not disturbed by the frequency-sweep (see Supporting Information). Using a single integration cycle at 1 rad/s angular frequency, strain-sweep measurements were done from 0.1 to 100% in log mode with 23 data points per decade, as previously shown.15
Small-Angle X-ray Scattering (SAXS)
Sample preparation
To prepare gels for SAXS measurements, 10–15 μL equal volumes of each peptide solution (10–15 μL) were centrifuged (20 sec at 500 RPM) into a cylindrical glass capillary (Charles Supper Co.) with a diameter of 1.0 mm and a wall thickness of 0.01 mm. Scattering data were taken 72 hrs after mixing.
SAXS Data Collection
SAXS data were collected using the beamline 12ID-B of the Advanced Photon Sources (APS) at the Argonne National Laboratory. Gel samples in the capillaries after 72 hrs of gelation were fixed horizontally in the sample rack, and the monochromic X-ray beam (λ = 0.689 Å) with a size of 0.07 mm × 0.20 mm (H × W) was adjusted to pass through the centers of the capillaries. The SAXS instrument has pinhole geometry. The exposure time for all samples was set to 0.5 sec to avoid detector saturation and radiation damage to the samples. X-ray scattering intensities were collected using the 2D detector Pilatus 2M (DECTRIS Ltd).
SAXS Data Analysis
The 2D scattering images were converted into 1D scattering profiles of I(Q) vs. Q in the Q-range from 0.007 Å−1 to 0.7 Å−1 by means of azimuthal averaging after solid angle correction. The resulting 1D profiles were normalized over the intensity of the transmitted X-ray beam, using the software package at the beamline 12ID-B. I(Q) is the scattering intensity of X-rays, and Q is the scattering vector amplitude which is related to the X-ray wavelength λ and the scattering angle θ by
| (1) |
Subtraction of the blank solvent scattering (PBS in D2O) involved normalization based on the ratio of incident and transmitted X-ray photon counts to account for the slight differences in the scattering path length of different capillaries.
Gel D (P1+P5) was very weak and its scattering showed larger assemblies only at very low Q (0.007–0.017 Å−1). At higher Q, a fairly linear Guinier plot, lnI(Q) vs. Q2, was observed which suggests the formation of finite size aggregates. SAXS data of Gel D were processed using the ATSAS software. The analysis of pairwise distance distribution functions for globular particles P(r) (Eq. 2) was performed using the linear regularization method of indirect Fourier-transformation using the program GNOM.24
| (2) |
P(r) reflects the probability that two randomly chosen points in a scattering particle are at r distance apart from each other, and P(r) = 0 happens at the maximum linear dimension of the scattering particle, dmax. The radius of gyration of the scattering globular particle, Rg, is derived from the second moment of P(r) as:
| (3) |
Rg is the root mean square distance of all unit-volume elements from the center of gravity of the scattering particle, and in the case of X-rays, the distribution of the mass is defined by the electron density distribution within the scattering particle. A simulated annealing algorithm was used to restore probable low resolution 3D structures of the finite size aggregates in Gel D. Such ab initio models are built from densely packed dummy atoms based on the algorithm implemented in the DAMMIN program. To get the most probable 3D model, multiple low resolution shapes generated in separate DAMMIN runs (at least 20 runs) were aligned with respect to their principal axes of inertia. Then, the structural discrepancies were minimized using the SUPCOMB25 program and averaged by means of the DAMAVER routine.26
From the linearity of the Guinier plots (Figure 5(b)), one might suggest that Gels A–C are assembled from asymmetrical elongated particles with the length much greater than the dimensions of their cross-sections. Moreover, the length of the fibers exceeded the upper detection limits of our SAXS instrument (~500 Å). Therefore, the scattering data of Gels A–C were analyzed in terms of the cross-sectional dimensions of the scattering particles, based on the standard approach of multiplying I(Q) by Q. Such multiplication essentially removes information about one dimensionality (the length) of the scattering particles.27 ATSAS software (PRIMUS) 24, 28 also was used to estimate the zero-angle scattering intensity of the hydrogel fiber cross-section, Ic(0), based on Guinier analysis of rod-like particles from lnQI(Q) vs. Q2 plots. Since Ic(0) is proportional to the mass per unit length of the hydrogel fiber, it could be used to compare the density of the fibers formed in Gels A–C. Guinier analysis for rod-like particles also allows one to get the reliable value of the radius of gyration of the fiber cross-section, Rc. Rc is the contrast-weighted mean distance of all area elements from the center of scattering density and is the basic dimensional characteristic of the fiber cross-section. For example, for the ideal cylinder rod, the radius of the cylinder equals Rc.27
Figure 5.

(a) SAXS scattering profiles I(Q) vs. Q of Gels A–D after 72 hours of gelation; (b) Guinier plots for rod-like particles, lnQ×I(Q) vs. Q2, for Gels A–C, the inset shows the lnQ×I(Q) vs. Q2 plot for Gel D with the upturn characteristic for the finite length elongated assemblies. Gel A, Blue; Gel B, black; Gel C, red; Gel D, green.
The same two-dimensional approach was used to compare the cross-sectional correlation length Lc of Gels AC. 2D scattering data (QI(Q) vs. Q) were processed using the IGOR Pro 6.2/IRENA29 software to estimate the cross-sectional mesh size of the cross-linking networks in the samples, by means of the Debye-Bueche model30 which has been suggested for hydrogels:
| (4) |
where Lc is the cross-sectional correlation length. Lc provides a measure of the spatial extent of the cross-linking regions in the 2D plane and reflects the average cross-sectional mesh size. Larger Lc is indicative of larger average cross-sectional mesh size.30
Fractal analysis is used to analyze materials that have a repetitive unit, an elementary “building brick” which is often characteristic for the fibers of a peptide hydrogel where such repetitive units could be assembled from several individual peptide modules. Fractal analysis is done in the high-Q region of the I(Q) vs. Q plot (Q ~ 0.04–0.06 Å−1). This region corresponds to a range of distances (below 50–70 Å) smaller than the size of the scattering objects (in our case, several hundreds of Å, up to the upper detection limit of our SAXS setup, ~ 500 Å) so that the scattered X-rays are probing the local structure of the fibrous hydrogel network. The fractal dimension (d) in mass-fractal analysis is a number ranging from 1 to 3, and defines the structural characteristics of the “building brick.” For instance, df is 1 in the case of stiff rod-like repetitive units; df is 2 for the Gaussian-coil-shaped structures; and df is 5/3 for the swollen Gaussian-coils in a good solvent; whereas df ≥ 2 corresponds to branched cross-linked polymers.31 Mass-fractal analysis is based on the following formula for the SAXS scattering intensity (eq. 5)
| (5) |
where df is the slope of the logI(Q) vs. logQ plot, B is the prefactor indicative of dimensional characteristics of a repetitive unit. For example for rod-like repetitive units (df =1), B is proportional to the end-to-end length of the rod.
Results and Discussion
Mechanical properties of peptide hydrogels
Using rheology to understand the mechanical properties of peptide hydrogels is essential in the development of this class of biomaterials.32 Through rheology, the gelation kinetics of each peptide hydrogel was monitored by a time-sweep experiment over 48 h (Figure 2(a)). The results show the formation of two stronger gels, Gel A (G′~180 kPa) and Gel C (G′~140 kPa), and two weaker gels, Gel B (G′~70 Pa) and Gel D (G′~60 Pa). In this study we link the number of E → Q substitutions to the number of electrostatic → polar interactions, allowing a quantitative understanding of each interaction. Gels A and C contained more electrostatic interactions whereas Gels B and Gel D had more polar interactions. Interestingly, Gel C had two E→Q substitutions but still was able to reach a high G′ value (~140 kPa) close to that of Gel A (~180 kPa). However with two more E → Q replacements a drastic decrease in G′ was observed in Gels B and D (~70 Pa and ~60 Pa). The plateau G′ values for Gels B and D were over three orders of magnitude lower than Gels A and C. From this result, we concluded that electrostatic interactions dictate the elastic modulus (G′); hence when more electrostatic groups (E) are incorporated into the peptide, stronger hydrogels are formed. However, this contribution is location-independent as Gels B and D had the same G′ value even though the locations of the two remaining Q residues were different in these two gels, e.g., in Gel D, the negatively charged E residues are in the terminal position at the both ends of the peptide module P5.
Figure 2.
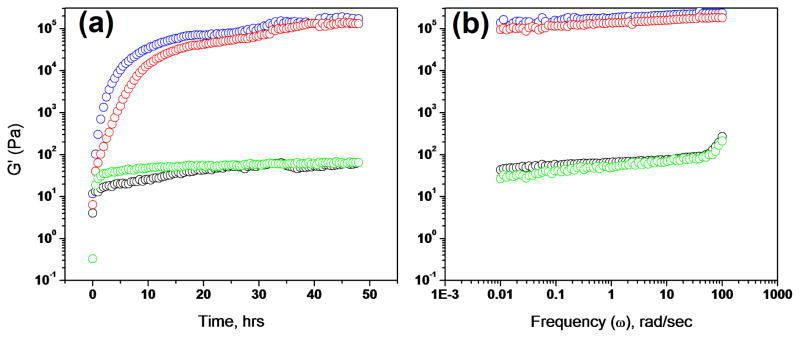
Monitoring gelation at 25°C by dynamic rheometry. (A) Time-sweep experiment monitoring gelation process by G′, the elastic modulus. Gel A (blue, peptides P1+P2) has plateau G′ ~ 180 kPa; Gel C (red, peptides P1+P4) has plateau G′ ~ 140 kPa; Gel B (black, peptides P1+P3) has plateau ~ G′ 70 Pa; Gel D (green, P1+ P5) has plateau G′ ~ 60 Pa. (B) Frequency-sweep of each gel. Color coding is the same in Panels A and B.
To determine the dynamic properties of the networks formed by each hydrogel, a frequency-sweep experiment was performed (Figure 2(b)). In these experiments, Gels A and C demonstrated the linearity of log G′ (ω) dependence which favors the formation of a solid like hydrogel network. The less stable Gels B and D showed evident relaxation at angular frequencies close to 100 rad/sec. Overall the stronger Gels A and C were more rigid than the weaker Gels B and D.
Gelation kinetics via NMR signal decay
From rheological measurements, Gels B and D were equally weak; hence NMR characterization was conducted on Gel A, Gel C, and Gel D, representing respectively 0, 2 and 4 E → Q substitutions in the original negative peptide module (P2). The decrease of the 1H signal intensity was used to monitor gelation kinetics. In Figure 3, the 1H signal intensity in the chemical shift range 7.0–7.8 ppm, corresponding to the aromatic protons of tryptophan, is shown at various time points. This 1H signal comes from unincorporated peptides, because upon incorporation into the gel network, peptide 1H signals become too broad to be observed.14 There was a clear peptide signal intensity decrease over time and the signal disappeared almost completely for Gels A and C. However for Gel D, the peptide 1H signal intensity does not decrease, indicating that the two peptides in Gel D are not forming an immobile matrix.
Figure 3.
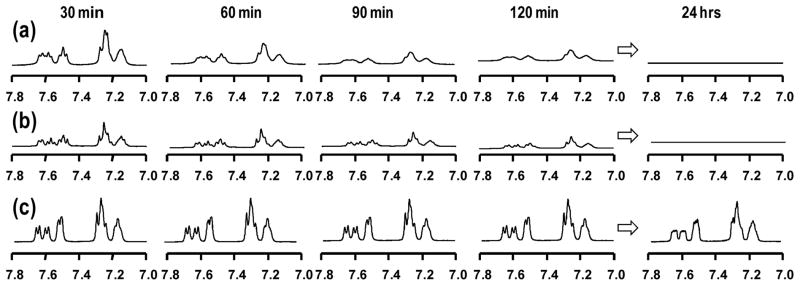
1H NMR spectra of peptides at different gelation time points. The signal in the range of 7.0–7.8 ppm is the aromatic proton signal from tryptophan in each peptide. (a) Gel A (P1 + P2); (b) Gel C (P1 + P4); (c) Gel D (P1 + P5).
To gain a quantitative understanding of gelation kinetics, the 1H signal intensity was normalized to peptide concentration using the boundary condition that at time t = 0 (prior to mixing), the 1H signal intensity corresponds to 16 mM of the peptides. C(t) of the three gels were plotted in Figure 4. It is clear that the concentration of free peptides in Gel D did not decrease, consistent with its extremely low G′ value (Figure 4(c)). For gels A and C, C(t) decreased as gelation proceeded and the decrease was more rapid for Gel A than for Gel C. C(t) vs t data for Gel A and Gel C was fitted using the bimolecular reaction equation: 19
Figure 4.
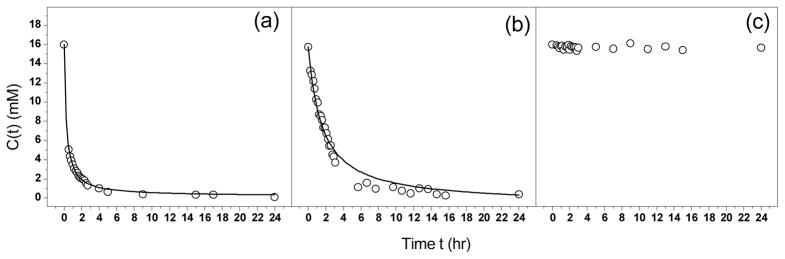
Peptide concentration C(t) vs. time t. (a) Gel A (P1 + P2); (b) Gel C (P1 + P4); (c) Gel D (P1 + P5). The curve in Gel A and Gel C represents fitting experimental data to Eqn. (6). For Gel A, keff = 1.03 mM−1s−1, Cmobile = 0.2mM, and R2 = 0.99. For Gel C, keff = 0.163 mM−1s−1, Cmobile = 0.2mM, and R2 = 0.98. R2 is the goodness of fitting.
| (6) |
The effective gelation rate constant, keff, is 1.03 mM−1s−1 for Gel A and 0.163 mM−1s−1 for Gel C. Therefore, the (P1+P2) pair gels 6 times faster than the (P1+P4) pair. This result indicates, compared with polar interaction, electrostatic interactions not only make the resulting hydrogel stiffer, but also speed up the gelation process by faster incorporation of the peptides into the hydrogel matrix. On the other hand, the extent of gelation after 24 hr is the same for both gels, which is ca. 99% judged by 1 − Cmobile/C0, consistent with their close values of mechanical strength.
Diffusion and relaxation behavior measured by NMR
Diffusion coefficient (D), longitudinal NMR relaxation time (T1) and transverse NMR relaxation time (T2) of H2O (solvent) and TFA (small molecule inside hydrogel) were measured to probe the microenvironment inside the hydrogels (Table 1 and 2). Hydrogels are defined as water swollen polymer networks,32 hence it is interesting to see how the movement of water is affected by gelation. From Table 1, it can be seen that water has shorter T1 and T2 in hydrogels than in their precursor solutions. Apparent relaxation rate of water is an average of bound and free water molecules. Within the peptide solutions water is bound to the free peptide forming the hydration layer, however in the hydrogel water is bound to a macromolecular fibrous peptide network which imposes motion restrictions. Therefore any water molecules bound to this network will also be restricted, which was seen by the decrease in T2 relaxation time, indicating gelation. Previously we observed that the NMR relaxation rate of peptides increased with the shear modulus of the hydrogel.19 Here we observed that NMR relaxation rate of water also increases with the shear modulus of the hydrogel. In Table 1, stiffer Gels A and C have shorter water relaxation times compared to the softer hydrogel Gel D. In contrast, the diffusion coefficient of water, D, varies only slightly after gelation, illustrating that the translational motion of water overall is not restricted by the hydrogel fiber network.
Table 1.
Diffusion coefficient D, relaxation times, T1 and T2, of water in 16mM in D2O PBS peptide solution and hydrogels (in D2O PBS).
| Samples | D (10−10 m2·s−1) | T1 (s) | T2 (ms) |
|---|---|---|---|
| Solution of P1 | 14.4 | 7.874 | 157.48 |
| Solution of P2 | 15.0 | 7.83 | 212.0 |
| Solution of P4 | 15.4 | 9.54 | 146.04 |
| Solution of P5 | 15.5 | 11.29 | 265.8 |
| Gel A (P1+P2) | 14.7 | 2.33 | 98.150 |
| Gel C (P1+P4) | 14.5 | 4.92 | 104.4 |
| Gel D (P1+P5) | 15.2 | 8.85 | 195.94 |
Table 2.
Diffusion coefficient D, relaxation times, T1 and T2, of trifluoroacetic acid (TFA) in 16mM in D2O PBS peptide solution and hydrogels (in D2O PBS).
| Samples | D (10−10 m2·s−1) | T1 (s) | T2 (s) |
|---|---|---|---|
| Solution of P1 | 6.72 | 3.03 | 2.75 |
| Solution of P2 | 6.98 | 3.05 | 2.77 |
| Solution of P4 | 6.66 | 3.10 | 2.92 |
| Solution of P5 | 7.75 | 3.20 | 2.10 |
| Gel A (P1+P2) | 3.44 | 3.19 | 0.404 |
| Gel C (P1+P4) | 3.38 | 3.07 | 0. 595 |
| Gel D (P1+P5) | 3.34 | 3.12 | 2.351 |
TFA is present in the system as an intrinsic small molecular probe, and contains three symmetrical fluorine atoms that produce a singlet 19F NMR signal. Using this 19F NMR signal is an ideal method to detect a small molecule because it can be done without any interference of the background proton signals from the peptide. TFA displays uniformly smaller diffusion coefficient (D) inside the hydrogel. This decrease in diffusion could be attributed to TFA being a larger and charged molecule compared to water. At pH 7.4, TFA is negatively charged. However, this decrease in diffusion is more likely due to the hydrogel containing only trace amounts of TFA. Therefore the number of TFA molecules bound to the network would have more weight on the average diffusion of TFA all together. Compared to the abundant amounts of water molecules present as the solvent, where the number of molecules bound to the hydrogel will not drastically affect the apparent diffusion coefficient of water. No change in T1 was observed from peptide to hydrogel solution; however a decrease in T2 relaxation was seen in stiffer hydrogels. These results indicate that T2 is a more sensitive probe for detecting small molecules within the hydrogel matrix. Among the three hydrogels, stiffer Gels (A and C) with the most electrostatic interactions have shorter T2 relaxation times for water and TFA than the softer gels (D).
SAXS Analysis of the Structural Effects of Electrostatic Interactions
Small-angle X-ray scattering (SAXS) was used to explore how changes in electrostatic interactions between peptide modules translate into structural differences in hydrogels. As seen from Figure 5(a), after 72 hours of gelation, three Gels A–C demonstrate noticeably high SAXS scattering intensities suggesting the formation of large molecular assemblies. However, Gel D shows only slight (and very noisy) signs of aggregation at lower Q-values (Q < 0.015 Å−1) (Figure 5(a)). Indirect Fourier transform of the scattering data to get the pair-wise distance distribution function P(r) (not shown) indicated that the size of the scattering particles for Gels A–C exceeded the limits of reliable measurement for our SAXS setup (~ 500 Å). On the other hand, all four Gels, AD, have fairly linear Guinier plots for rod-like particles, ln Q×I(Q) vs. Q2 (Figure 5(b)), which suggest the formation of asymmetric elongated aggregates. Therefore we first analyzed the data in terms of cross-sectional parameters. For Gels A–C, the linearity of Guinier plots for rod-like particles (Figure 5(b)) allows the use of ATSAS software24 to derive the values of the radius of gyration of the cross-section, Rc, of the hydrogel fibers (from the slope of linear plot, ~ Rc2/2), and the zero-angle scattering intensity, Ic(0), of the fiber cross-section (from the intercept of the linear plot). The results of the Guinier analysis for rod-like particles (Table 3) show that Gels A and C are assembled from fibers with highest and similar cross-sectional dimensions (Rc ~ 19–20 Å). The similarity of the fibers of Gels A and C is also evident from the close values of their mass per unit length (proportional to the corresponding Ic(0) values, Table 3). This is in a good agreement with the data from dynamic rheometry (Figure 2), suggesting that both Gels A and C have the highest elastic modulus G′ after 72 hrs of gelation (~ 180 kPa and 140 kPa, respectively). Much weaker Gels B and D (G′ ~ 70 Pa and ~ 60 Pa, respectively, Figure 2) consistently show significantly lower Rc values (~ 11 Å and ~ 5 Å, respectively) and almost 10 times lower values of the mass per unit length of their elongated aggregates (Table 3).
Table 3.
Dimensional Characteristics and Structural Data of Hydrogels A–D from SAXS Data Analysis.a
| Samples | Rc, Å | Ic(0) × 102, arb. unit | df | Lc, Å |
|---|---|---|---|---|
| Gel A (P1+P2) | 19.8 ± 0.8 | 1.75 ± 0.06 | 1.83 ± 0.01 | 31.8 ± 0.9 |
| Gel B (P1+P3) | 10.7 ± 1.0 | 0.27 ± 0.01 | 1.63 ± 0.03 | 60.6 ± 1.8 |
| Gel C (P1+P4) | 19.2 ± 0.5 | 1.85 ± 0.07 | 2.42 ± 0.01 | 42.7 ± 1.2 |
| Gel D (P1+P5) | 5.2 ± 0.5 | 0.10 ± 0.01 | — b | — b |
Rc is the radius of gyration of the fiber cross-section in Å; Ic(0) is the zero-angle scattering intensity of the cross-section in arbitrary units which is proportional to the mass per unit length of the fiber; df is the mass-fractal dimension reflecting the morphology of the repetitive unit of the fiber; Lc is the correlation length (mesh size) in the cross-section in Å.
Due to low intensity of the SAXS scattering of the fibrous network in Gel D it was not possible to get reliable estimates of these parameters.
Of special interest is Gel D, where the characteristic upturn of the Guinier plot for rod-like particles (inset in Figure 5(b)) points to the formation of finite sized aggregates. The Guinier plot for globular particles, ln I(Q) vs. Q2 (inset in Figure 6(a)), is also linear in the range Q ~ 0.04 – 0.07 Å−1, and suggests that despite Gel D having the signs of large aggregation at Q < 0.015 Å−1, these aggregates are still of a finite size, with essentially uniform dimensional characteristics. Indirect Fourier transformation of the scattering data of Gel D by means of GNOM28 results in the pair-wise distance distribution function P(r) typical for elongated assemblies with radius of gyration Rg = 12.5 ± 0.6 Å and maximum dimension dmax = 40 Å (Figure 5(a)). Of course, despite the similarity in dimensional characteristics, the finite size aggregates in Gel D could have certain shape variations. However, to get a pictorial image of the average 3D shape of the Gel D assemblies, their low resolution shape has been restored from the scattering data using the ab initio program DAMMIN.28 Average 3D shape of the scattering particles in Gel D has been obtained from a set of 20 models generated by 20 separate runs of DAMMIN. These models were superimposed with respect to their main axes of inertia by means of the best-matching alignment program SUPCOMB34 and averaged using a DAMAVER26 routine. Alignment, superimposition and averaging involve the minimization of the normalized structural discrepancy parameter (NSD). NSD is a quantitative measure of the similarity between the 20 separately generated models in our set, and NSD = 0 for ideally identical structures, and > 1 for systemically different models. In our case, NSD ~ 0.5, suggesting that all these 20 structures generated independently in 20 separate program runs are structurally very similar to each other. Therefore, the ultimate averaged 3D model shown in Figure 6(b) reliably reflects the most probable shape of the proposed finite size aggregates.
Figure 6.

(a) Pair-wise distance distribution function P(r) of Gel D (quality fit parameter of GNOM regularization ~0.7, for ideal fit it is 1.0); the inset shows the linear Guinier plot for globular particles, lnI(Q) vs. Q2; (b) Two projections of the average ab initio low resolution 3D model of finite size aggregates in Gel D, different shades of green were used only to better visualize the dimensions in different projections.
Differences in the bulk mechanical properties of Gels A and C could also be understood from the comparison of the mass-fractal dimension, df, which describes the morphology of the repetitive unit (a “building brick”) of the hydrogel fibers. As seen from Table 3, Gel A is assembled from the Gaussian-coil building bricks (df ~ 5/3), while Gel C is assembled from much less compact randomly branched building bricks (df > 2). Evidently, this difference contributes to the slightly stiffer Gel A as compared to Gel C (G′ ~ 180 kPa vs. ~ 140 kPa, respectively) despite the similarity in the dimensional characteristics of their fibers.
Also of significant importance to the bulk mechanical properties is the cross-section correlation length, Lc. Lc is derived from the 2D SAXS scattering profile, QI(Q) vs. Q, where the multiplication of I(Q) by Q removes the information of the longest dimension/length of the hydrogel fiber.27 The concept of cross-section correlation length Lc was successfully applied to hydrogels14 and is better understood from the schematic shown in Figure 7. As such, Lc reflects the averaged distances between the cross-sections of the fibers, tantamount to the “mesh size” of the network in the plane cross-section the network. The results listed in Table 3 show that Gel A forms the network with the smallest mesh size, i.e., its network density is highest of all hydrogels and this additionally contributes to its strongest storage modulus G′ observed in dynamic rheometry experiments.
Figure 7.
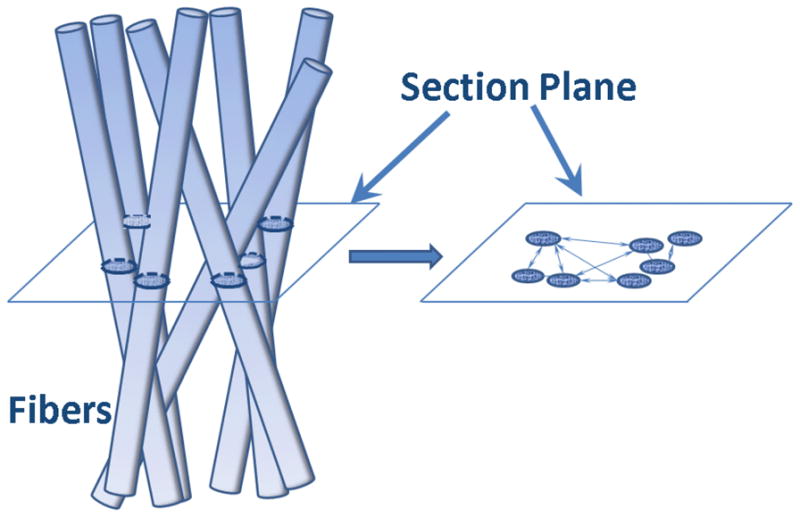
Pictorial schematic explaining the concept of the cross-section correlation length. Lc is the averaged value of all distances between fiber cross-sections in the section plane (right).
Of note, Gels B and D have very similar mechanical strength (G′ ~ 70 Pa and ~ 60 Pa, respectively). However, the scattering intensity of Gel B is noticeably higher compared to Gel D (Figure 5(a)). Based on the comparison of SAXS data, one might suggest that Gel B is comprised of long fiber aggregates, opposed to Gel D which is comprised of finite size aggregates (Figure 6(b)). At the same time, the fibers of Gel B have rather small cross-section (Rc ~ 10 Å vs. ~19–20 Å for Gels A and C, Table 3) and very low mass per unit length (more than 5 times lower as compared to Gels A and C, Table 3). Moreover, high values of mesh size (Lc > 60 Å, Table 3) suggest that the fiber network in Gel B is much looser than those in Gels A and C. It is probably the combination of the above structural features of Gel B leads to its small elastic modulus.
From the mechanical studies, it has been concluded that the impact of E→Q replacement on the elastic modulus of the hydrogel is location independent. Gels B and D, which differ in the locations of E→Q replacements, have similar G′ values (~70 Pa and ~60 Pa, respectively). However, from SAXS data, it was evident that the assembly of the fibers depends on the locations of E→Q replacements. Gel B has two glutamic acid residues staggered at positions 3 and 9 in peptide P3, whereas Gel D has two terminal glutamic acid residues capping the peptide sequence at positions 1 and 11 in peptide P5 (Figure 1). With the staggered glutamic acid residues, the peptide modules P1 and P3 are capable to assemble into long fibrous aggregates of Gel B. However in Gel D, with the capping terminal glutamic acid residues, the peptide modules P1 and P5 only form finite length aggregates whose dimension parameters are consistent with heterodimers (Figure 6(b)).
Conclusion
Engineered biomaterials are formed by the chemical manipulation of the building blocks from which they evolve. With the promise of hydrogels for an array of biomedical applications, it is important to systematically examine how different chemistries affect the structure and properties of hydrogel networks. In this study we showed how exchanging electrostatic interactions for polar interactions (E → Q) within our peptide design, can affect the resulting properties of our hydrogels. Many molecular forces contribute to peptide-based hydrogel assembly, such as electrostatic, polar and hydrophobic interactions as well as β-sheet formation, etc. In our design, two co-assembling peptide modules bear oppositely charged amino acids, and their electrostatic attraction controls the mutual diffusion of the two modules towards each other. Therefore, one could expect that the increased electrostatic interaction will promote the hydrogel assembly.
It has been shown that the number of electrostatic interactions between the building blocks of biomaterials dictates the mechanical stiffness of the system. Increased electrostatic interactions foster faster peptide incorporation into the gel matrix and restrict the motion of solvent and solute molecules inside the matrix. From SAXS analysis of the hydrogel system, it was shown that the number of electrostatic interactions also defines the structural characteristics of the hydrogel fibers, but the location of the points of such electrostatic interaction influences the capability of fibrillization, in general.
Although these conclusions can only be specific for our peptide design, the observed trends may provide insight about the general effects of the electrostatic interactions in this class of materials. This work has unveiled that altering electrostatic and polar interaction is an effective mechanism of chemical programmability for peptide based biomaterials.
Acknowledgments
This work was supported by the NIH under grant EB004416. Use of the Advanced Photon Source, an Office of Science User Facility operated for the U.S. Department of Energy (DOE) Office of Science by Argonne National Laboratory, was supported by the U.S. DOE under Contract No. DE-AC02-06CH11357. Beamtime was awarded through the program of General User Proposals to GUP-24524.
References
- 1.Hoare TS, Kohane DS. Polymer. 2008;49:1993–2007. [Google Scholar]
- 2.Schmidt JJ, Rowley JR, Kong HJ. J Biomed Mater Res. 2008;87:1113–1122. doi: 10.1002/jbm.a.32287. [DOI] [PubMed] [Google Scholar]
- 3.Haines-Butterickm L, Rajagopal K, Branco M, Salick D, Rughani R, Pilarz M, Lamm MS, Pochan DJ, Schneider J. P Proc Natl Acad Sci. 2007;104:7791–7796. doi: 10.1073/pnas.0701980104. [DOI] [PMC free article] [PubMed] [Google Scholar]
- 4.Yemini M, Reches M, Rishpon J, Gazit E. Nano Lett. 2005;5:183–186. doi: 10.1021/nl0484189. [DOI] [PubMed] [Google Scholar]
- 5.Benoiton NL. Chemistry of Peptide Synthesis. CRC; 2006. [Google Scholar]
- 6.Coin I, Beyermann M, Bienert M. Nat Protoc. 2007:3247–3256. doi: 10.1038/nprot.2007.454. [DOI] [PubMed] [Google Scholar]
- 7.Banwell EF. Nat Mater. 2009;8:596–600. doi: 10.1038/nmat2479. [DOI] [PMC free article] [PubMed] [Google Scholar]
- 8.Peppas NA, Huang M, Torres-Lugo M, Ward JH, Zhang J. Annu Rev Biomed Eng. 2000;02:9–29. doi: 10.1146/annurev.bioeng.2.1.9. [DOI] [PubMed] [Google Scholar]
- 9.McCoy CP, Christopher B, Cowley JF, McGlinchey MM, McGoldrick N, Kinnear DJ, Andrews G, Jones DS. Expert Opin Drug Deliv. 2010;7:605–616. doi: 10.1517/17425241003677731. [DOI] [PubMed] [Google Scholar]
- 10.Collier JH, Segura T. Biomaterials. 2011;32:4198–4204. doi: 10.1016/j.biomaterials.2011.02.030. [DOI] [PMC free article] [PubMed] [Google Scholar]
- 11.Peppas NA, Keys KB, Torres-Lugo M, Lowman AMJ. Control Release. 1999;62:81–87. doi: 10.1016/s0168-3659(99)00027-9. [DOI] [PubMed] [Google Scholar]
- 12.Langer R, Peppas NA. AICHE J. 2003;49:2990–3006. [Google Scholar]
- 13.Ramachandran S, Yu YB. Bio Drugs. 2006;20:263–269. doi: 10.2165/00063030-200620050-00001. [DOI] [PubMed] [Google Scholar]
- 14.Feng Y, Taraban M, Yu YB. Soft Matter. 2012 doi: 10.1039/c2sm26572a. published online September 27, 2012. [DOI] [PMC free article] [PubMed] [Google Scholar]
- 15.Hyland LL, Taraban MB, Feng Y, Hammouda B, Yu YB. Biopolymers. 2012;97:177–188. doi: 10.1002/bip.21722. [DOI] [PMC free article] [PubMed] [Google Scholar]
- 16.Ramachandran S, Tseng Y, Yu YB. Biomacromolecules. 2005;6:1316–1321. doi: 10.1021/bm049284w. [DOI] [PMC free article] [PubMed] [Google Scholar]
- 17.Ramachandran S, Tseng Y, Yu YB. Chem Mater. 2006;18:6157–6162. [Google Scholar]
- 18.Taraban MB, Ramachandran S, Gryczynski I, Gryczynski Z, Trewhella J, Yu YB. Soft Matter. 2011;7:2624–2631. doi: 10.1039/C0SM00919A. [DOI] [PMC free article] [PubMed] [Google Scholar]
- 19.Feng Y, Tarban M, Yu YB. Soft Matter. 2011;7:9890–9893. doi: 10.1039/C1SM06389H. [DOI] [PMC free article] [PubMed] [Google Scholar]
- 20.Joyner K, Wang W, Yu YB. J Fluorine Chem. 2011:114–122. doi: 10.1016/j.jfluchem.2010.12.005. [DOI] [PMC free article] [PubMed] [Google Scholar]
- 21.Cohen Y, Liat A, Frish L. Angew Chem Int Ed. 2005;44:520–554. doi: 10.1002/anie.200300637. [DOI] [PubMed] [Google Scholar]
- 22.Vold RL, Waugh JS, Klein MP, Phelps DE. J Chem Phys. 1986;48:3831. [Google Scholar]
- 23.Meiboom S, Gill S. Rev Sci Instrum. 1958;29:688. [Google Scholar]
- 24.Konarev PV, Volkov VV, Sokolova AV, Koch MHJ, Svergun DI. J Appl Cryst. 2003;36:1277–1282. [Google Scholar]
- 25.Svergun DI. Biophys J. 1999;76:2879–2886. doi: 10.1016/S0006-3495(99)77443-6. [DOI] [PMC free article] [PubMed] [Google Scholar]
- 26.Volkov VV, Svergun DI. J Appl Cryst. 2003;36:860–864. [Google Scholar]
- 27.Glatter O, Kratky O, editors. Small Angle X-Ray Scattering. Academic Press; 1982. [DOI] [PubMed] [Google Scholar]
- 28.Svergun DI. J Appl Cryst. 1992;25:495–503.7. [Google Scholar]
- 29.Ilavsky J, Jemian P. J Appl Crystallogr. 2009;42:347–353. [Google Scholar]
- 30.Debye P, Bueche AM. J Appl Phys. 1949;20:518–525. [Google Scholar]
- 31.Soni VK, Stein RS. Macromolecules. 1990;23:5257–5265. [Google Scholar]
- 32.de Gennes PG. Scaling Concepts in Polymer Physics. Cornell University Press; 1979. [Google Scholar]
- 33.Yan C, Pochan D. Chem Soc Rev. 2010;39:3528–3540. doi: 10.1039/b919449p. [DOI] [PMC free article] [PubMed] [Google Scholar]
- 34.Feng Y, Lee M, Taraban M, Yu YB. Chem Commun. 2011;47:10455–10457. doi: 10.1039/c1cc13943f. [DOI] [PMC free article] [PubMed] [Google Scholar]
- 35.Kozin MB, Svergun DI. J Appl Cryst. 2001;34:33–41. [Google Scholar]